Abstract
Background. Osteoarthritis (OA), particularly knee and hip osteoarthritis (KOA and HOA), is a leading cause of disability. Although diabetes-related factors and lipid abnormalities have been implicated in OA development, the causal nature of these associations remains unclear.
Objectives. This study investigates the relationships between diabetes-related factors (type 2 diabetes (T2D), fasting insulin and glycated hemoglobin (HbA1c)), blood lipid risk factors (high-density lipoprotein cholesterol (HDL-C), low-density lipoprotein cholesterol (LDL-C) and triglycerides), and OA using Mendelian randomization (MR) analysis.
Materials and methods. A bidirectional MR design was applied, using genetic data from publicly available genome-wide association studies (GWAS) that included 403,124 KOA cases and 393,873 HOA cases, along with datasets on diabetes-related and blood lipid risk factors. Genetic variants were used as instrumental variables, and causal relationships were assessed using the TwoSampleMR (v. 0.5.7) package in R. The primary analytical methods included inverse-variance weighted (IVW) analysis, weighted median (WM) analysis, and MR-Egger regression.
Results. The forward MR analysis did not identify a causal relationship between diabetes-related factors or blood lipid markers and OA. However, this does not exclude the possibility of indirect pathways or small effects that may not have been detected. In the reverse MR analysis, fasting insulin demonstrated a potential causal relationship with HOA (odds ratio (OR) = 2.568, 95% confidence interval (95% CI): 1.192–5.536, p = 0.016). Additionally, HbA1c (OR = 1.675, 95% CI: 1.254–2.238, p < 0.01), T2D (OR = 1.082, 95% CI: 1.008–1.162, p = 0.03), and LDL-C (OR = 0.799, 95% CI: 0.688–0.928, p < 0.01) were associated with KOA. Glycated hemoglobin and T2D appeared to be potential risk factors for KOA, whereas LDL-C showed a protective association.
Conclusions. This study provides evidence supporting causal associations between diabetes-related factors, blood lipid levels, and the risk of KOA and HOA. These findings suggest that effective blood glucose control and lipid management may help prevent or slow the progression of OA.
Key words: Mendelian randomization, diabetes, osteoarthritis, causal inference, blood lipids
Background
Osteoarthritis (OA) is a common joint disorder and a leading cause of functional disability in adults and older individuals. Highly prevalent forms such as knee osteoarthritis (KOA) and hip osteoarthritis (HOA) markedly reduce quality of life and impose substantial clinical and socioeconomic burdens.1 Globally, the prevalence of OA increased by 28% from 2010 to 2019, affecting approx. 6% of the global population (over 500 million individuals). This trend, driven by an aging population, rising obesity rates and an increase in sport-related joint injuries, underscores the growing public health burden posed by OA.2
Osteoarthritis is characterized by the degeneration of joint cartilage and changes in periarticular structures, with clinical symptoms including pain that worsens with activity and eases with rest, stiffness during inactivity, swelling, and reduced range of motion.3, 4 The pathophysiology of OA is complex, with cartilage degradation at its core, caused by an imbalance between anabolic and catabolic activities within the joint. Despite significant advancements in understanding OA, the causal role of diabetes-related and lipid metabolic abnormalities in OA progression remain unclear. Observational studies have linked abnormalities in lipid metabolism – such as elevated low-density lipoprotein cholesterol (LDL-C) and reduced high-density lipoprotein cholesterol (HDL-C) – to an increased risk of developing OA. Accumulation of LDL-C in joint cartilage may impair local blood supply and activate pro-inflammatory pathways, thereby accelerating cartilage degradation.5 High LDL-C levels may lead to accumulation in cartilage, causing microcirculatory impairment through vascular deposition.6 In contrast, HDL-C may help protect joint cartilage via reverse cholesterol transport, and through anti-inflammatory and antioxidant mechanisms. However, these findings are often confounded by external factors, and the role of triglycerides remains poorly understood.
Type 2 diabetes (T2D), a chronic condition characterized by insulin resistance and elevated blood glucose levels, has also been linked to OA through mechanisms involving inflammation and cellular stress.7 Long-term metabolic markers, such as fasting insulin and glycated hemoglobin (HbA1c) , provide insight into average blood glucose levels over several months, allowing for the evaluation of how metabolic control influences joint health. Nonetheless, traditional observational studies are limited by confounding variables and reverse causation, making it difficult to determine whether these associations are truly causal.
Objectives
To address these limitations, this study employs Mendelian randomization (MR), a robust causal inference approach that uses genetic variants as instrumental variables (IVs) to approximate the effects of randomized controlled trials, thereby reducing confounding and eliminating the possibility of reverse causation.8, 9, 10 This approach is well-suited for investigating potential causal relationships between blood glucose and lipid risk factors and OA. The study specifically focuses on evaluating the causal effects of T2D, fasting insulin, HbA1c, LDL-C, HDL-C, and triglycerides on KOA and HOA. By integrating large-scale genetic datasets with OA phenotypes, this research aims to uncover causal links and provide a genetic framework to inform prevention and therapeutic strategies.
Materials and methods
Study design
This study adopted a bidirectional multi-sample MR approach to explore the causal relationships between diabetes-related (T2D, fasting insulin and HbA1c) and blood lipids (HDL-C, LDL-C and triglycerides) risk factors with KOA and HOA. A bidirectional MR approach was chosen because it allowed to examine causality in both directions, whether diabetes-related factors and blood lipids influenced OA, and vice versa. This approach was particularly useful for understanding the complex, interdependent relationships between metabolic factors and OA. The MR study was based on 3 fundamental assumptions: 1) The relevance assumption: where the selected single nucleotide polymorphisms (SNPs) must be significantly associated with the exposure. 2) The independence assumption: the association between the IV and the outcome cannot be influenced by confounders. 3) The exclusion assumption, the IV affects the outcome only through the exposure. To strengthen the relevance assumption, SNPs were selected based on well-established associations with diabetes-related traits and blood lipid levels. Specifically, SNPs were chosen from publicly available datasets that directly linked these genetic variants to T2D, fasting insulin, HbA1c, HDL-C, LDL-C, and triglycerides (Table 1). The SNP selection process was further guided by known genetic correlations between these SNPs and the target exposures, ensuring the instruments were robustly connected to the exposures of interest.
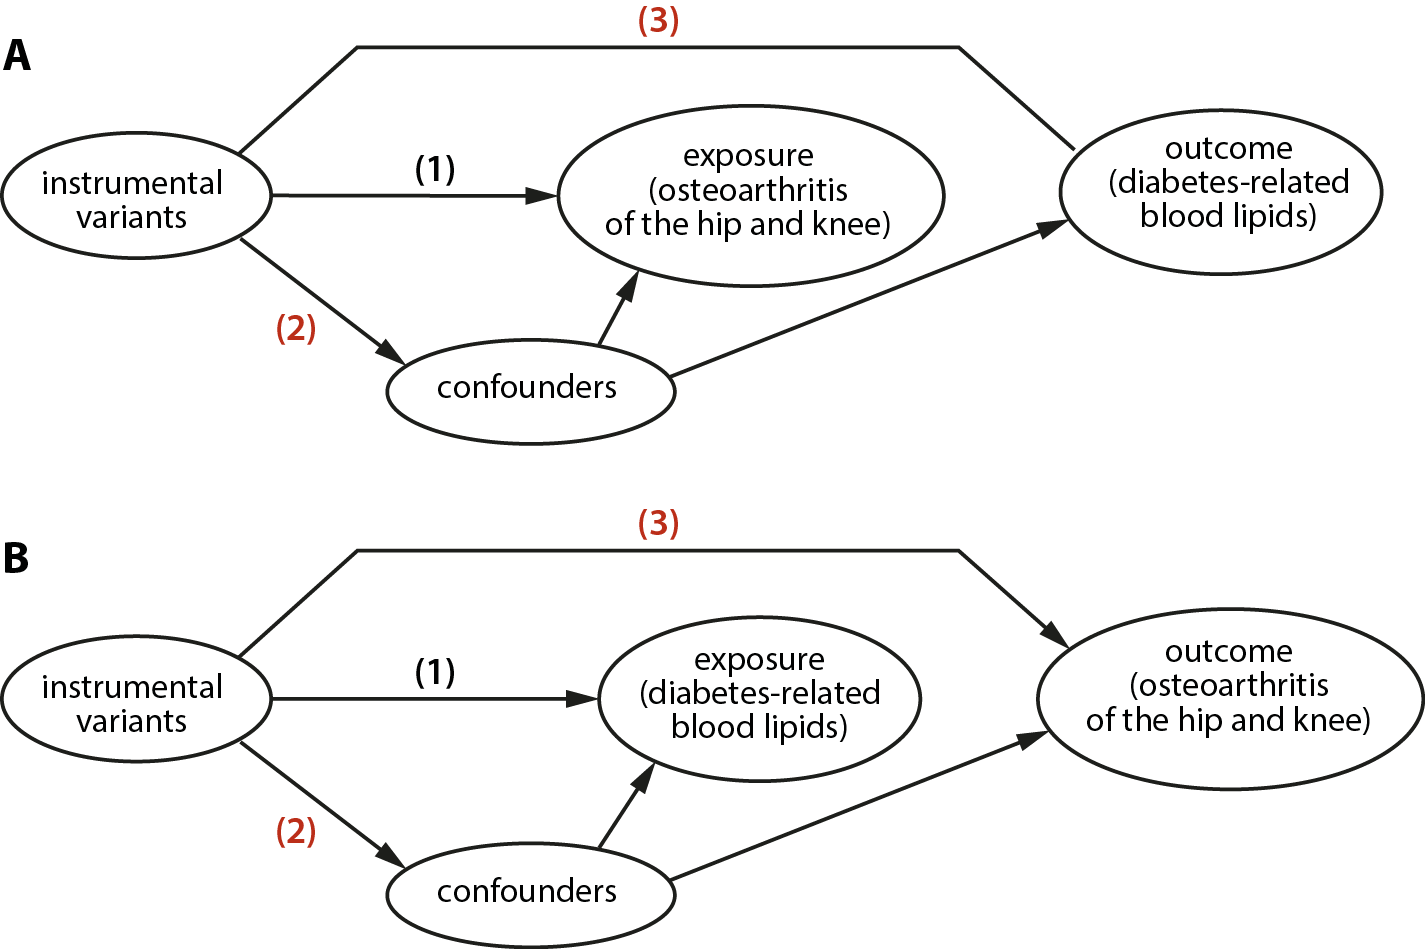
The MR analysis was conducted in 2 stages. In the 1st step, OA was treated as the exposure, and diabetes-related factors and blood lipid measures were treated as the outcomes. Methods such as inverse-variance weighted (IVW) were employed to test for causal relationships (Figure 1A). In the 2nd step, the process was reversed, with diabetes-related and blood lipid risk factors as exposures and OA as the outcome (Figure 1B).
Data sources
The data for this study were obtained from publicly available genome-wide association study databases, primarily from the genome-wide association study (GWAS) catalog. (https://gwas.mrcieu.ac.uk/). Datasets were selected from the MRC IEU OpenGWAS database (https://gwas.mrcieu.ac.uk/) in April 2024. Datasets were selected based on their recency,9 sample size, and data quality, with priority given to the most updated and curated sources. Newer GWAS datasets often feature larger cohorts, improved imputation accuracy and stronger statistical power. To maintain consistency and avoid bias caused by population stratification, only samples from European populations were included. This selection was informed by previous studies showing that European populations exhibit greater genetic homogeneity, thereby reducing the potential for confounding arising from population differences. The datasets covered diabetes-related risk factors and blood lipid traits, as well as samples from individuals with KOA and HOA. The KOA sample included 403,124 cases and covered 29,999,696 SNPs, while the HOA sample included 393,873 cases and covered 29,771,219 SNPs. Detailed information on the diabetes-related and blood lipid risk factors is provided in Table 1. In the table, GWAS ID represented the unique identifier for each GWAS dataset, including various exposures such as T2D, fasting insulin, HbA1c, LDL-C, HDL-C, and triglycerides.
Data measurements
Instrumental variables were selected based on genetic variants associated with diabetes-related risk factors and blood lipid levels. The criteria for filtering these IVs were set with a p-value threshold of less than 5 × 10⁻⁸. If no instrumental variables were identified at this threshold, the significance level was relaxed to a minimum of 5 × 10–6.10 This adjustment ensured that some valid IVs could be identified, considering the challenges in finding SNPs that met such stringent criteria across all traits. To ensure the independence of IVs in the analysis, an LD threshold of r2 < 0.001 was applied, retaining independent SNPs. The strength of IVs was assessed using the F-statistic, with an F-value ≥10 indicating a strong IV. The formula was as follows:
R2 represented the proportion of variance in the exposure variable explained by the IV, N denoted the sample size, and K indicated the number of IVs. Weak IVs (F < 10) were excluded due to their potential to reduce statistical power and introduce bias in causal estimates. Obesity is a well-known confounder that influences both metabolic risk factors and OA risk. To address this issue, datasets were carefully selected to account for obesity as a potential confounder, as many of the included GWAS controlled for body mass index (BMI) and other related variables. This helped ensure that the observed relationships between metabolic factors and OA were not confounded by obesity.
Mendelian randomization analysis
Mendelian randomization analysis was conducted using the TwoSampleMR package v. 0.5.7 in R v. 4.4.0 (R Foundation for Statistical Computing, Vienna, Austria). A bidirectional MR framework was used to investigate the causal relationships between diabetes-related traits, blood lipid levels and the risks of KOA and HOA. This approach was particularly useful because it enabled the assessment of causality in both directions, providing a more comprehensive understanding of the complex and interdependent relationships among these variables. Inverse-variance weighting was used as the primary analytical method. This approach estimates the causal effect of an exposure on an outcome by combining SNP-specific effects, assuming that all instrumental variables are valid and independent.14 To increase the reliability of the causal estimates, 2 additional methods were used as complementary analyses: weighted median (WM) and MR-Egger regression. The WM method provided consistent causal estimates when at least 50% of the instrumental variables were valid, even if some instruments were weak or invalid. Mendelian randomization–Egger regression was used to account for pleiotropy, which occurs when an instrumental variable influences the outcome through pathways other than the exposure of interest. This method can help correct for potential biases even when all instruments are invalid or pleiotropy is present. Therefore, causal inference is strengthened when results are consistent across all 3 analytical methods.
To ensure reproducibility and clarity, we have included key excerpts of the R script used for MR analyses in the shared data. The script outlines the instrument selection criteria (p < 5 × 10⁻⁸, linkage disequilibrium (LD) r2 < 0.001), data harmonization steps, and the use of multiple MR methods including IVW, MR-Egger, WM, and others.
Robustness analysis
The heterogeneity of the IVW model was assessed with Cochran’s Q test. When pleiotropy was observed in the sensitivity analysis, Mendelian Randomization Pleiotropy RESidual Sum and Outlier (MR-PRESSO) was employed to test for horizontal pleiotropy and outliers were removed before re-analysis. If pleiotropy still existed, the analysis would be excluded. The leave-one-out method was employed to sequentially remove each IV, and the meta-effect of the remaining variables was calculated to check for any changes in the results. If removing a particular instrumental variable substantially altered the results, that variable was excluded.15
Statistical analyses
The statistical significance was defined based on the consistency of the β-direction across the IVW, WM and MR-Egger methods. A p < 0.05 for IVW was considered statistically significant. Heterogeneity tests were performed to assess the presence of any inconsistencies in the data. If heterogeneity was present (Q_pval < 0.05), results from the random-effects model were used; otherwise, fixed-effects models were applied.16 Pleiotropy was evaluated using the MR–Egger intercept test, with p-values greater than 0.05 indicating no evidence of pleiotropy.
Results
Causal relationships between SNPs associated with diabetes-related risk factors and blood lipid levels
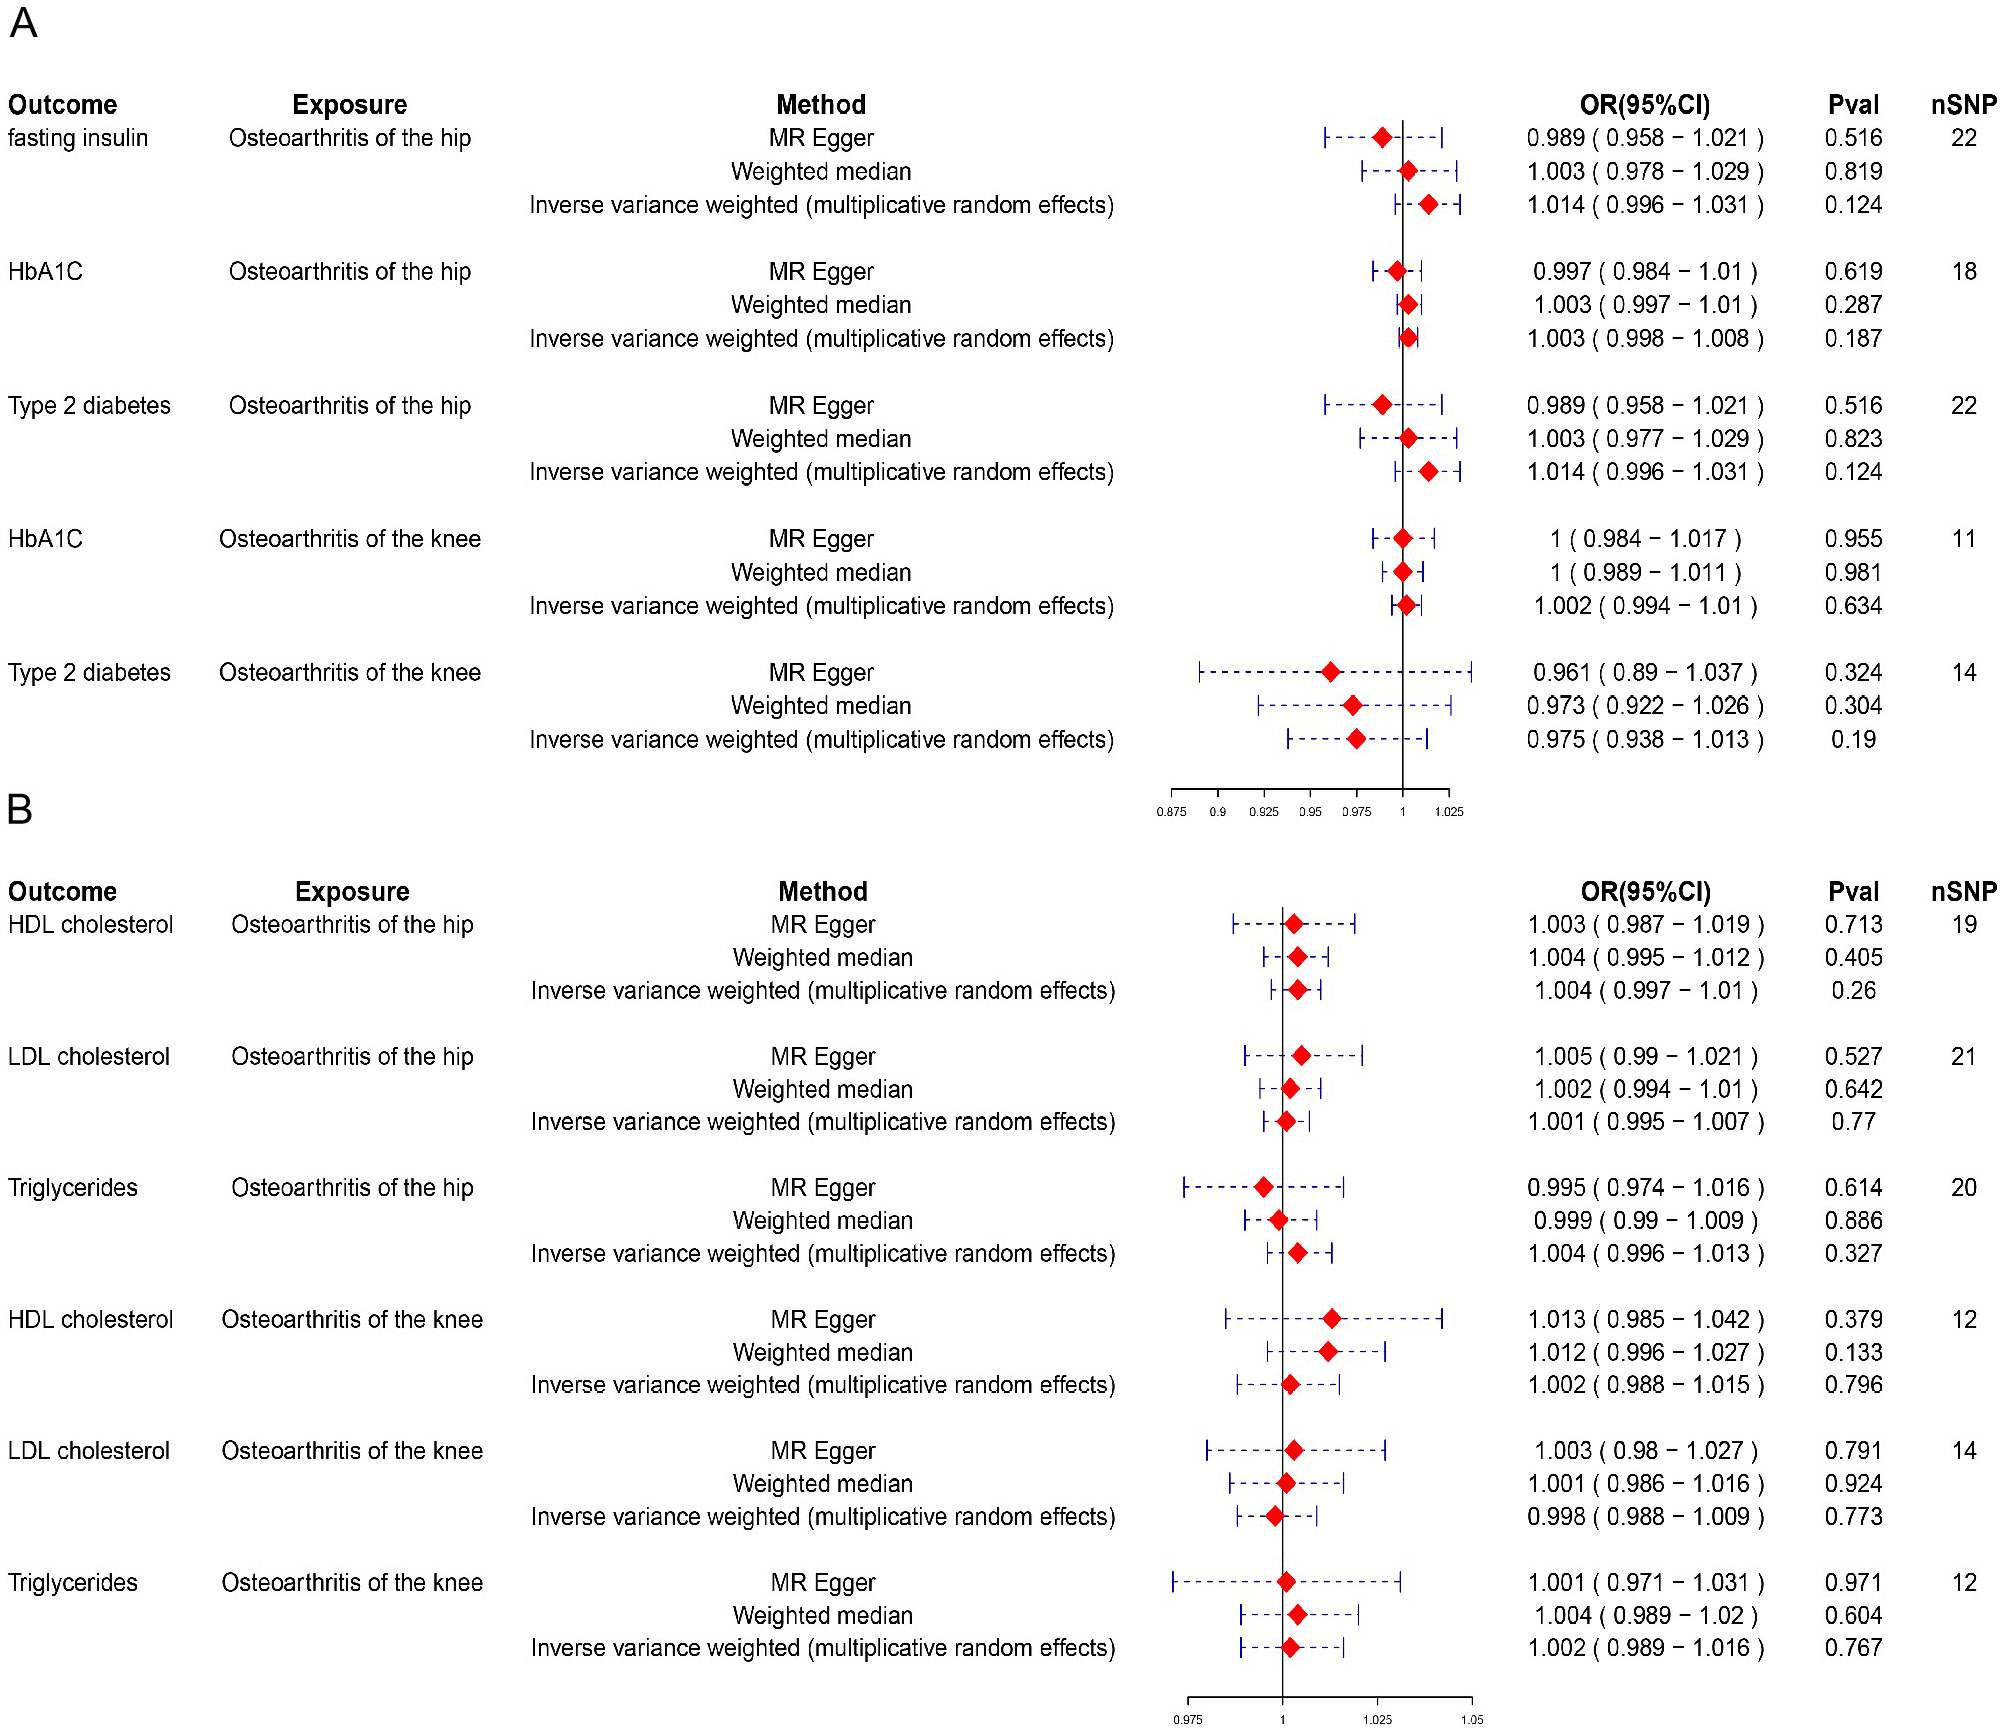
To assess the causal relationships between diabetes-related and blood lipid factors and OA, we first conducted MR analyses using KOA and HOA as the exposures and diabetes-related traits and blood lipid measures as the outcomes. These analyses did not yield statistically significant results. (Figure 2). In the assessment of the causal relationship between fasting insulin and HOA or KOA, the OR was close to 1 (odds ratio (OR) = 1.014, 95% confidence interval (95% CI): 0.996–1.031, p = 0.124), indicating a negligible effect size. Although the point estimate was slightly above 1, the result did not reach statistical significance, providing no evidence of a causal relationship. This reinforced the idea that changes in fasting insulin did not significantly influence the likelihood of developing OA, either in the KOA or the HOA. In sensitivity analyses, triglycerides showed significant heterogeneity in relation to HOA (Q = 0.0054). A significant Q-value suggested that effect estimates may vary across SNPs. However, the pleiotropy test results (p = 0.3376) indicated no evidence of horizontal pleiotropy, suggesting that the observed heterogeneity was unlikely to result from confounding factors influencing the outcome through alternative genetic pathways. While the presence of heterogeneity may indicate variability in the relationship between triglycerides and HOA, the absence of pleiotropy strengthens confidence in the MR estimates. Additionally, no other results showed heterogeneity (Q_pval > 0.05) or pleiotropy (p > 0.05) (Table 2, Table 3), further confirming the robustness of these findings.
Causal relationships of OA-related SNPs
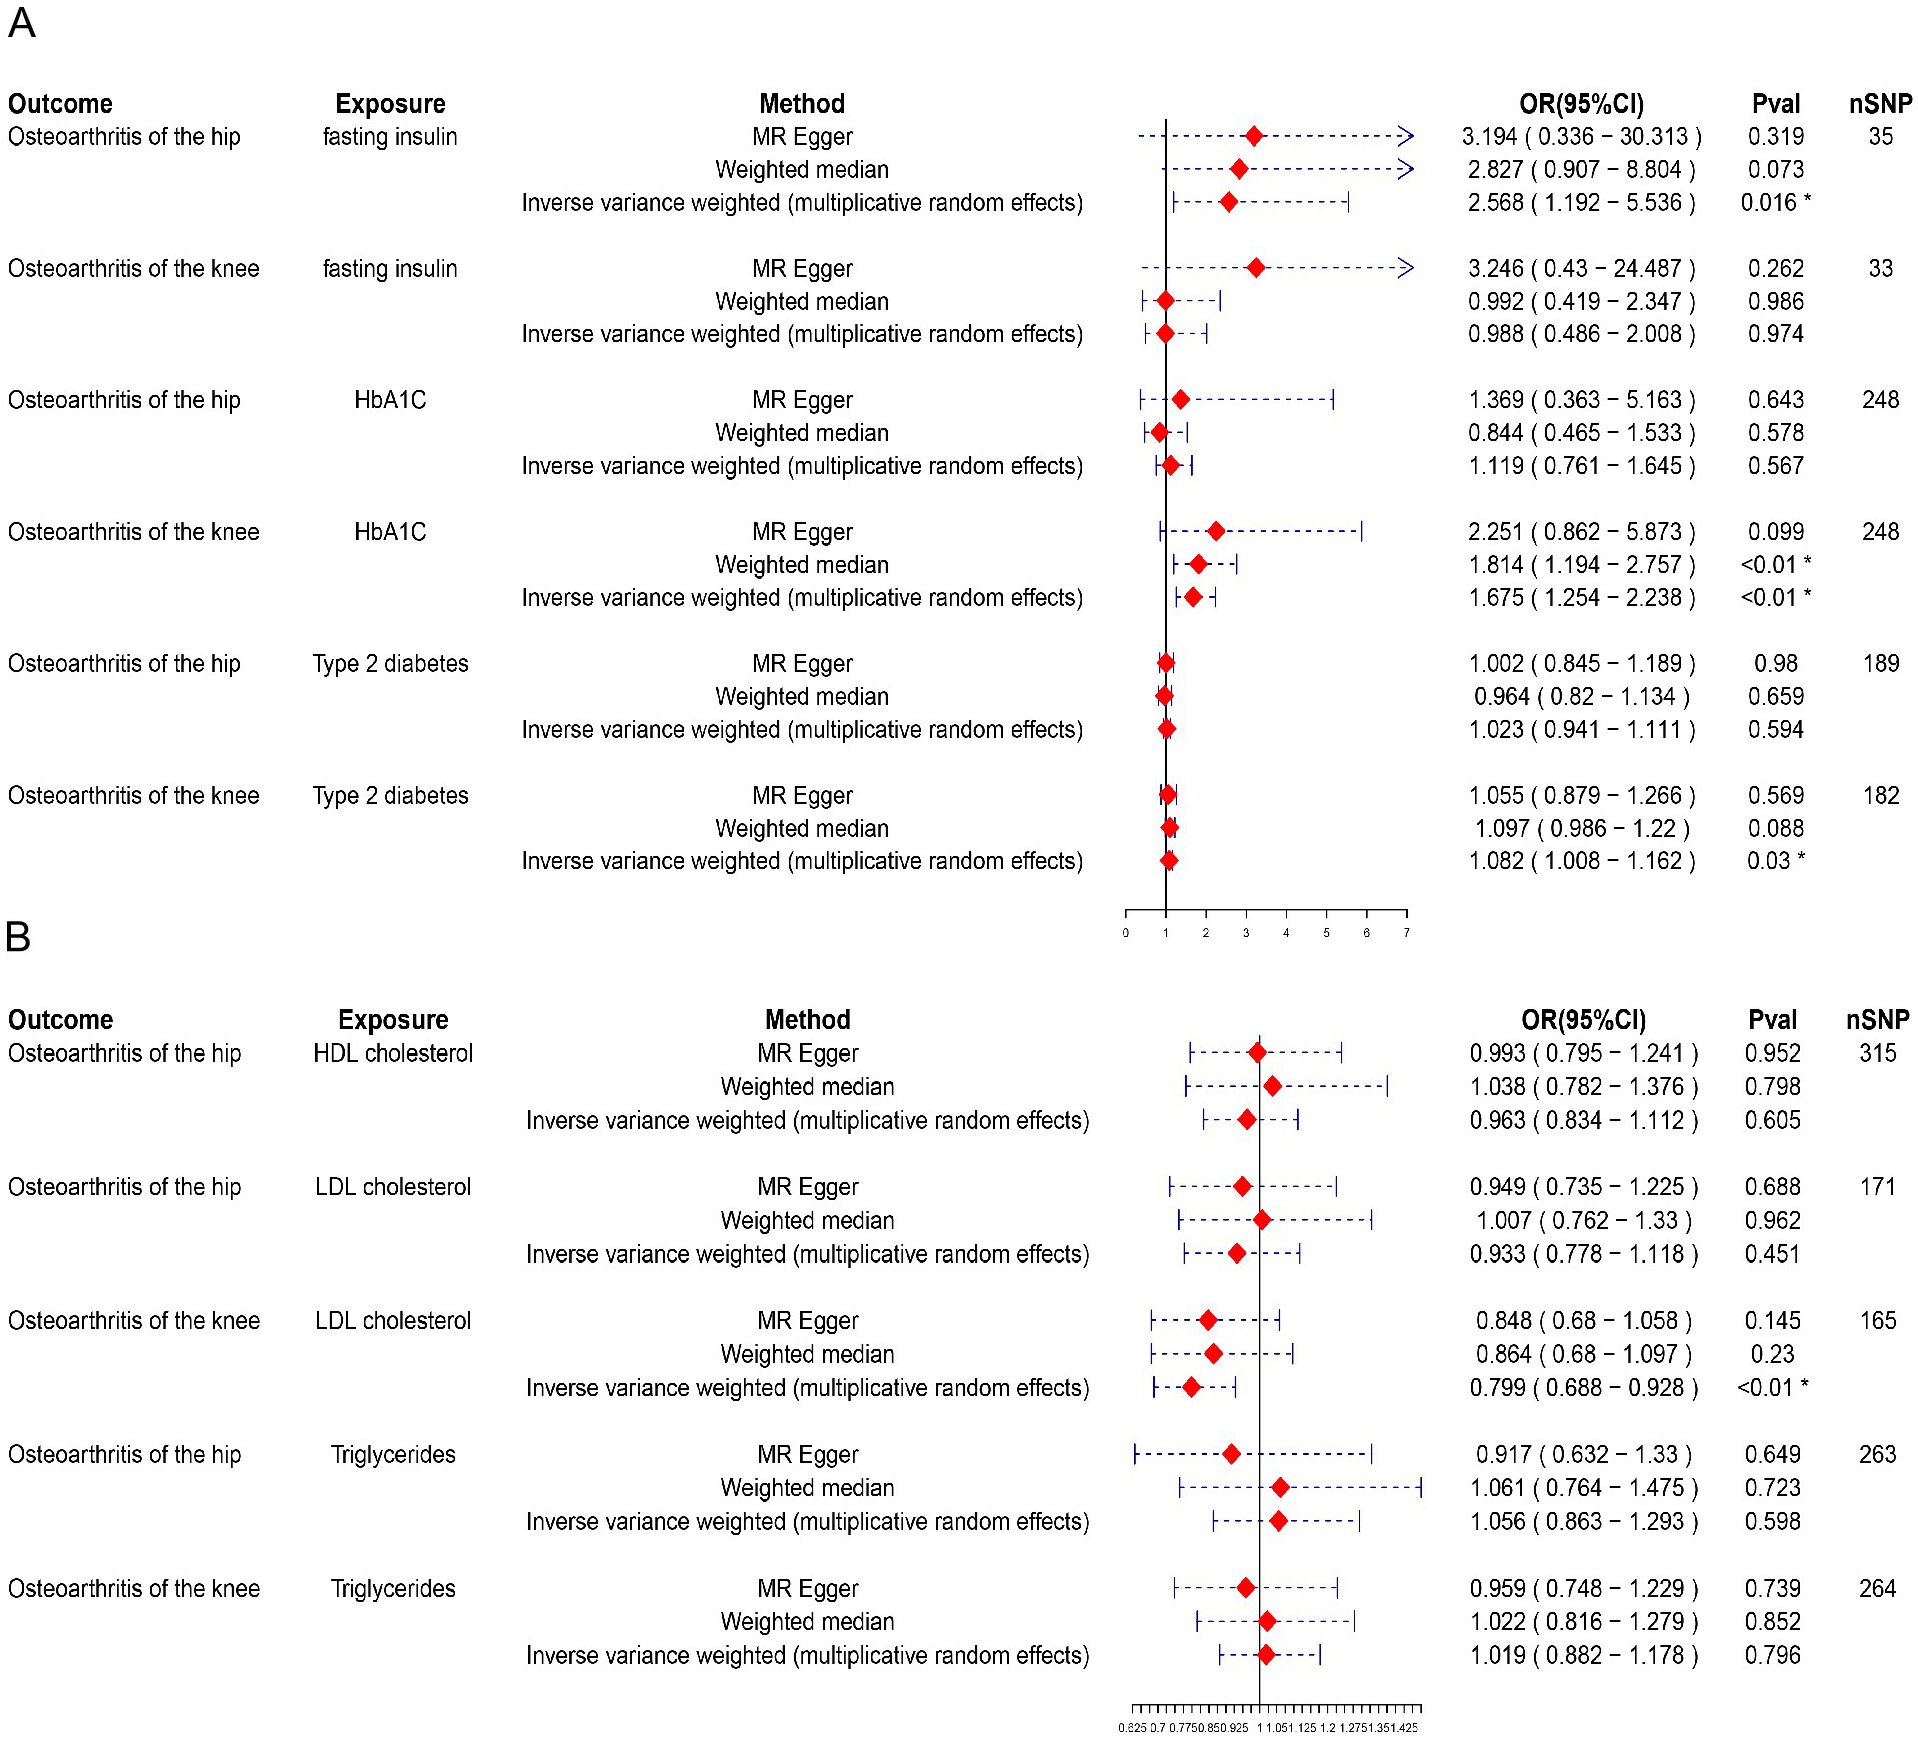
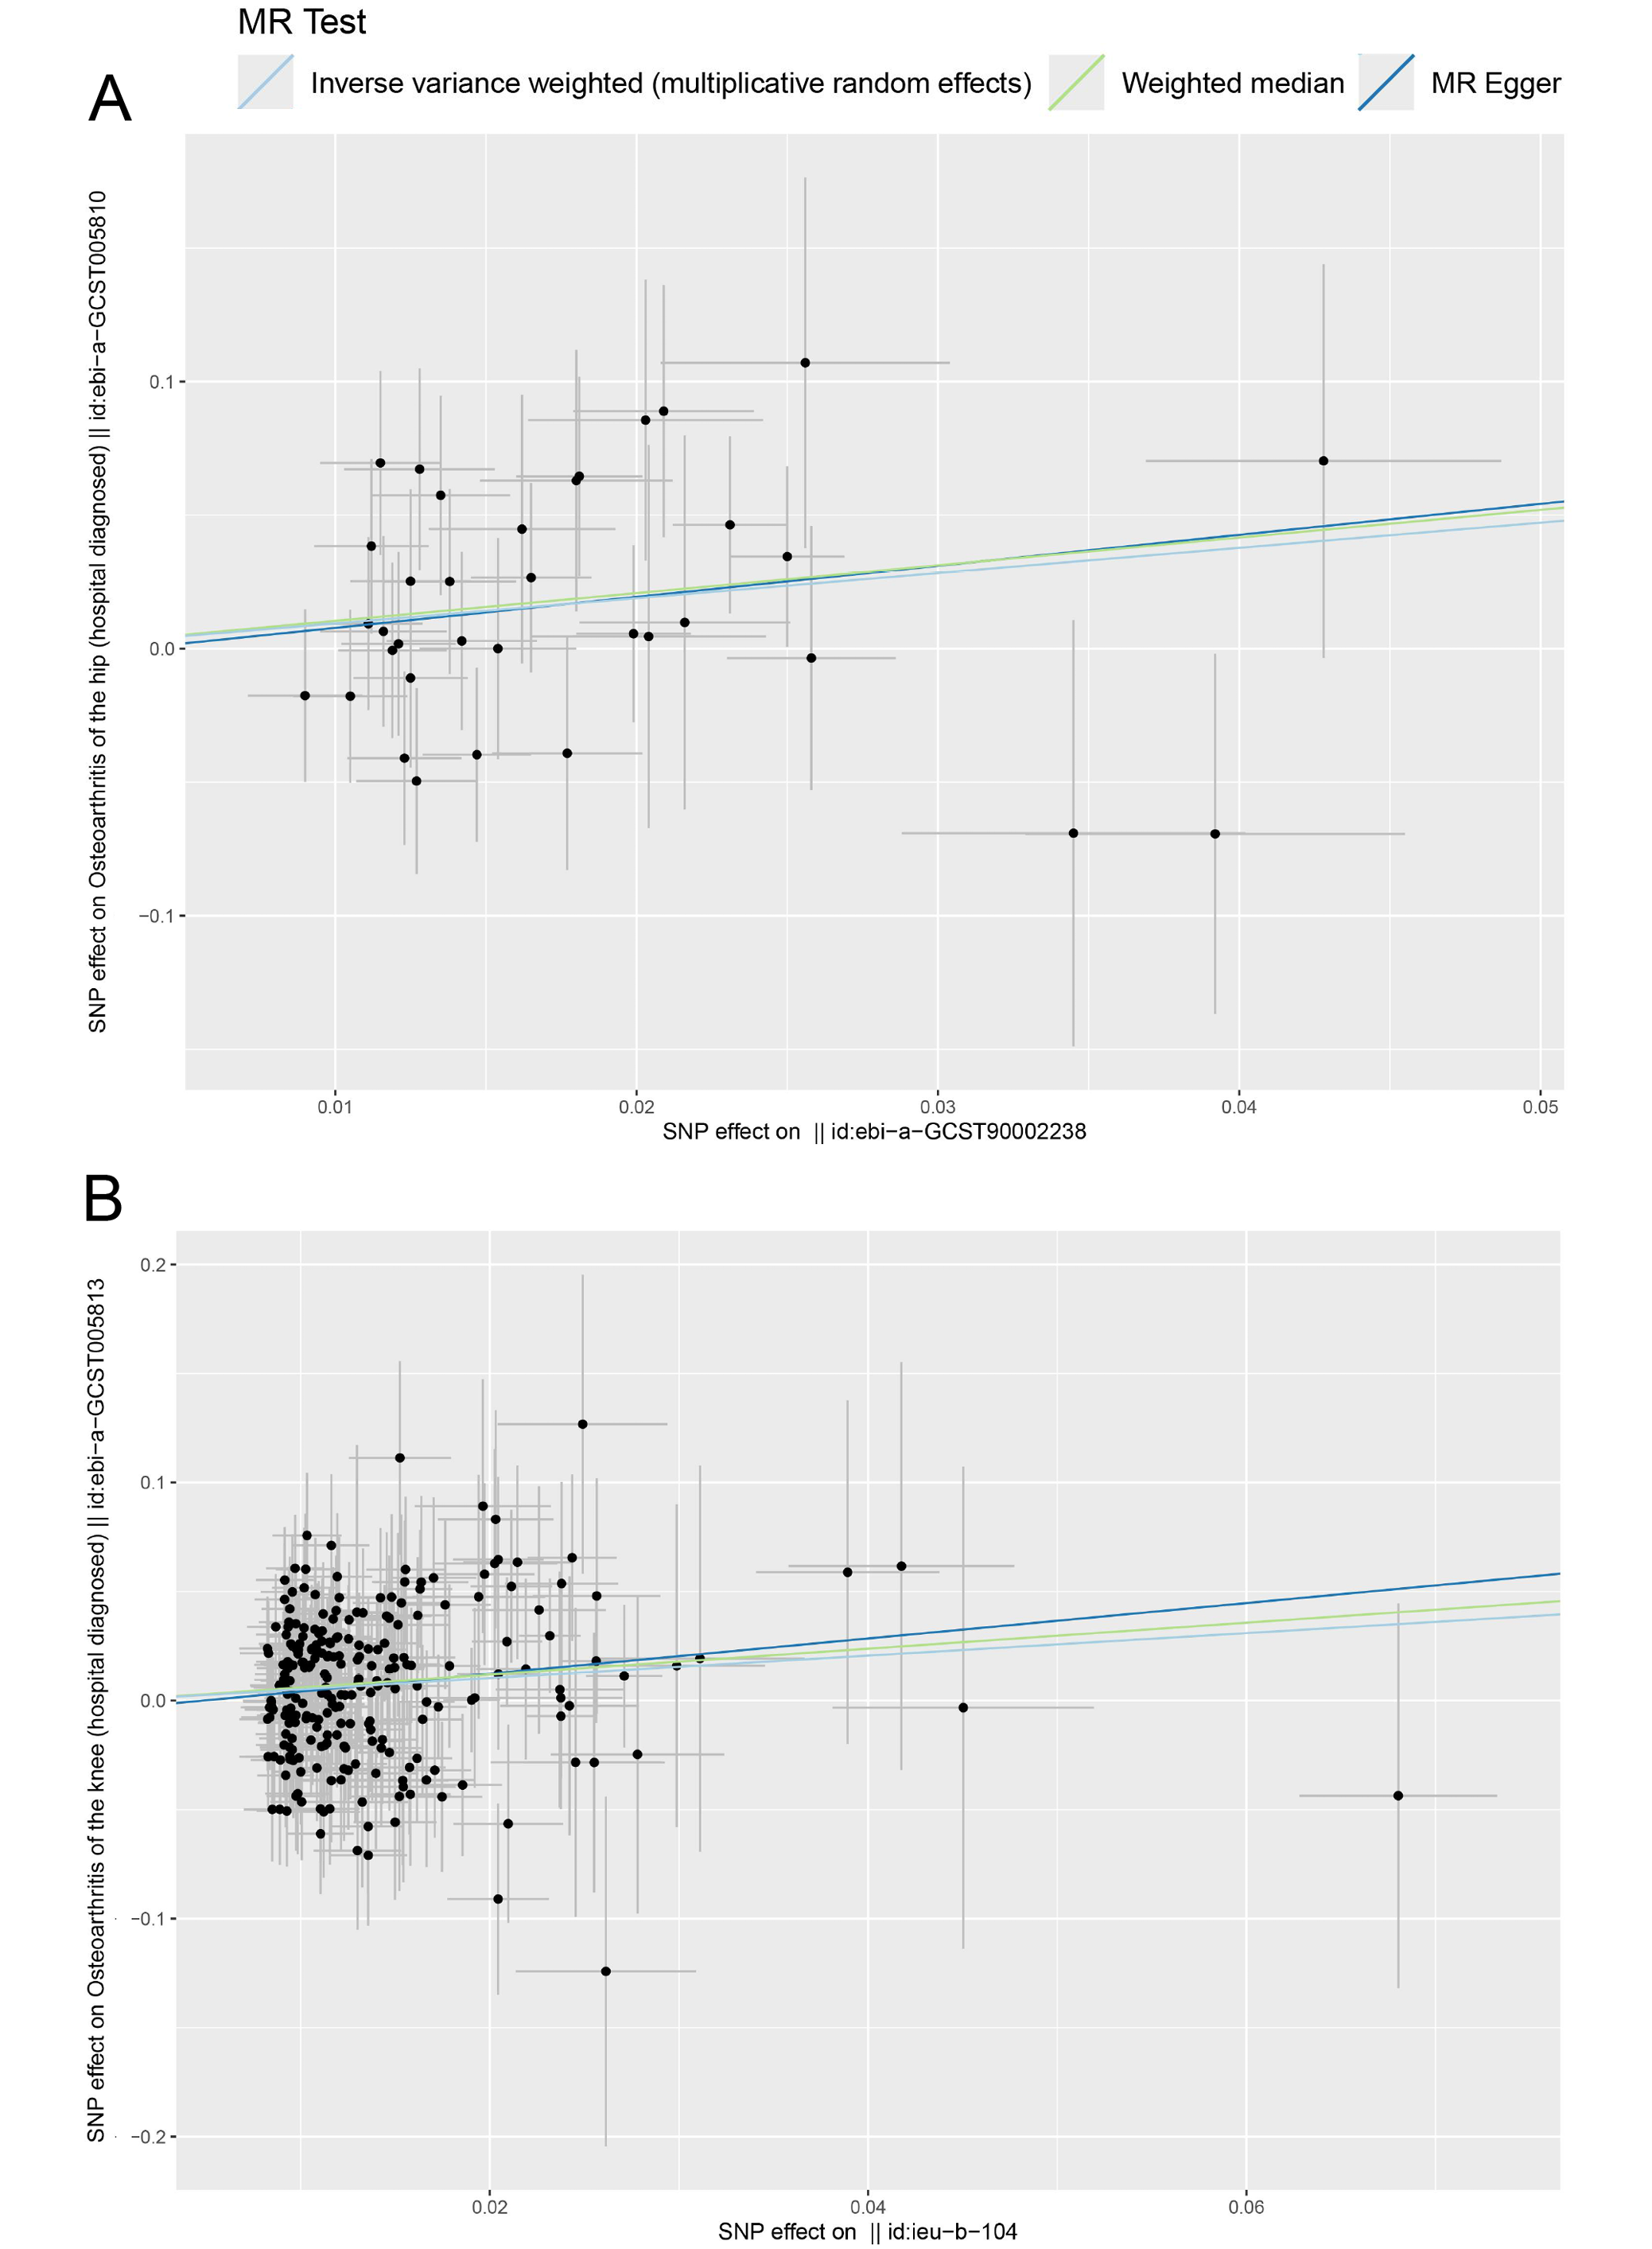
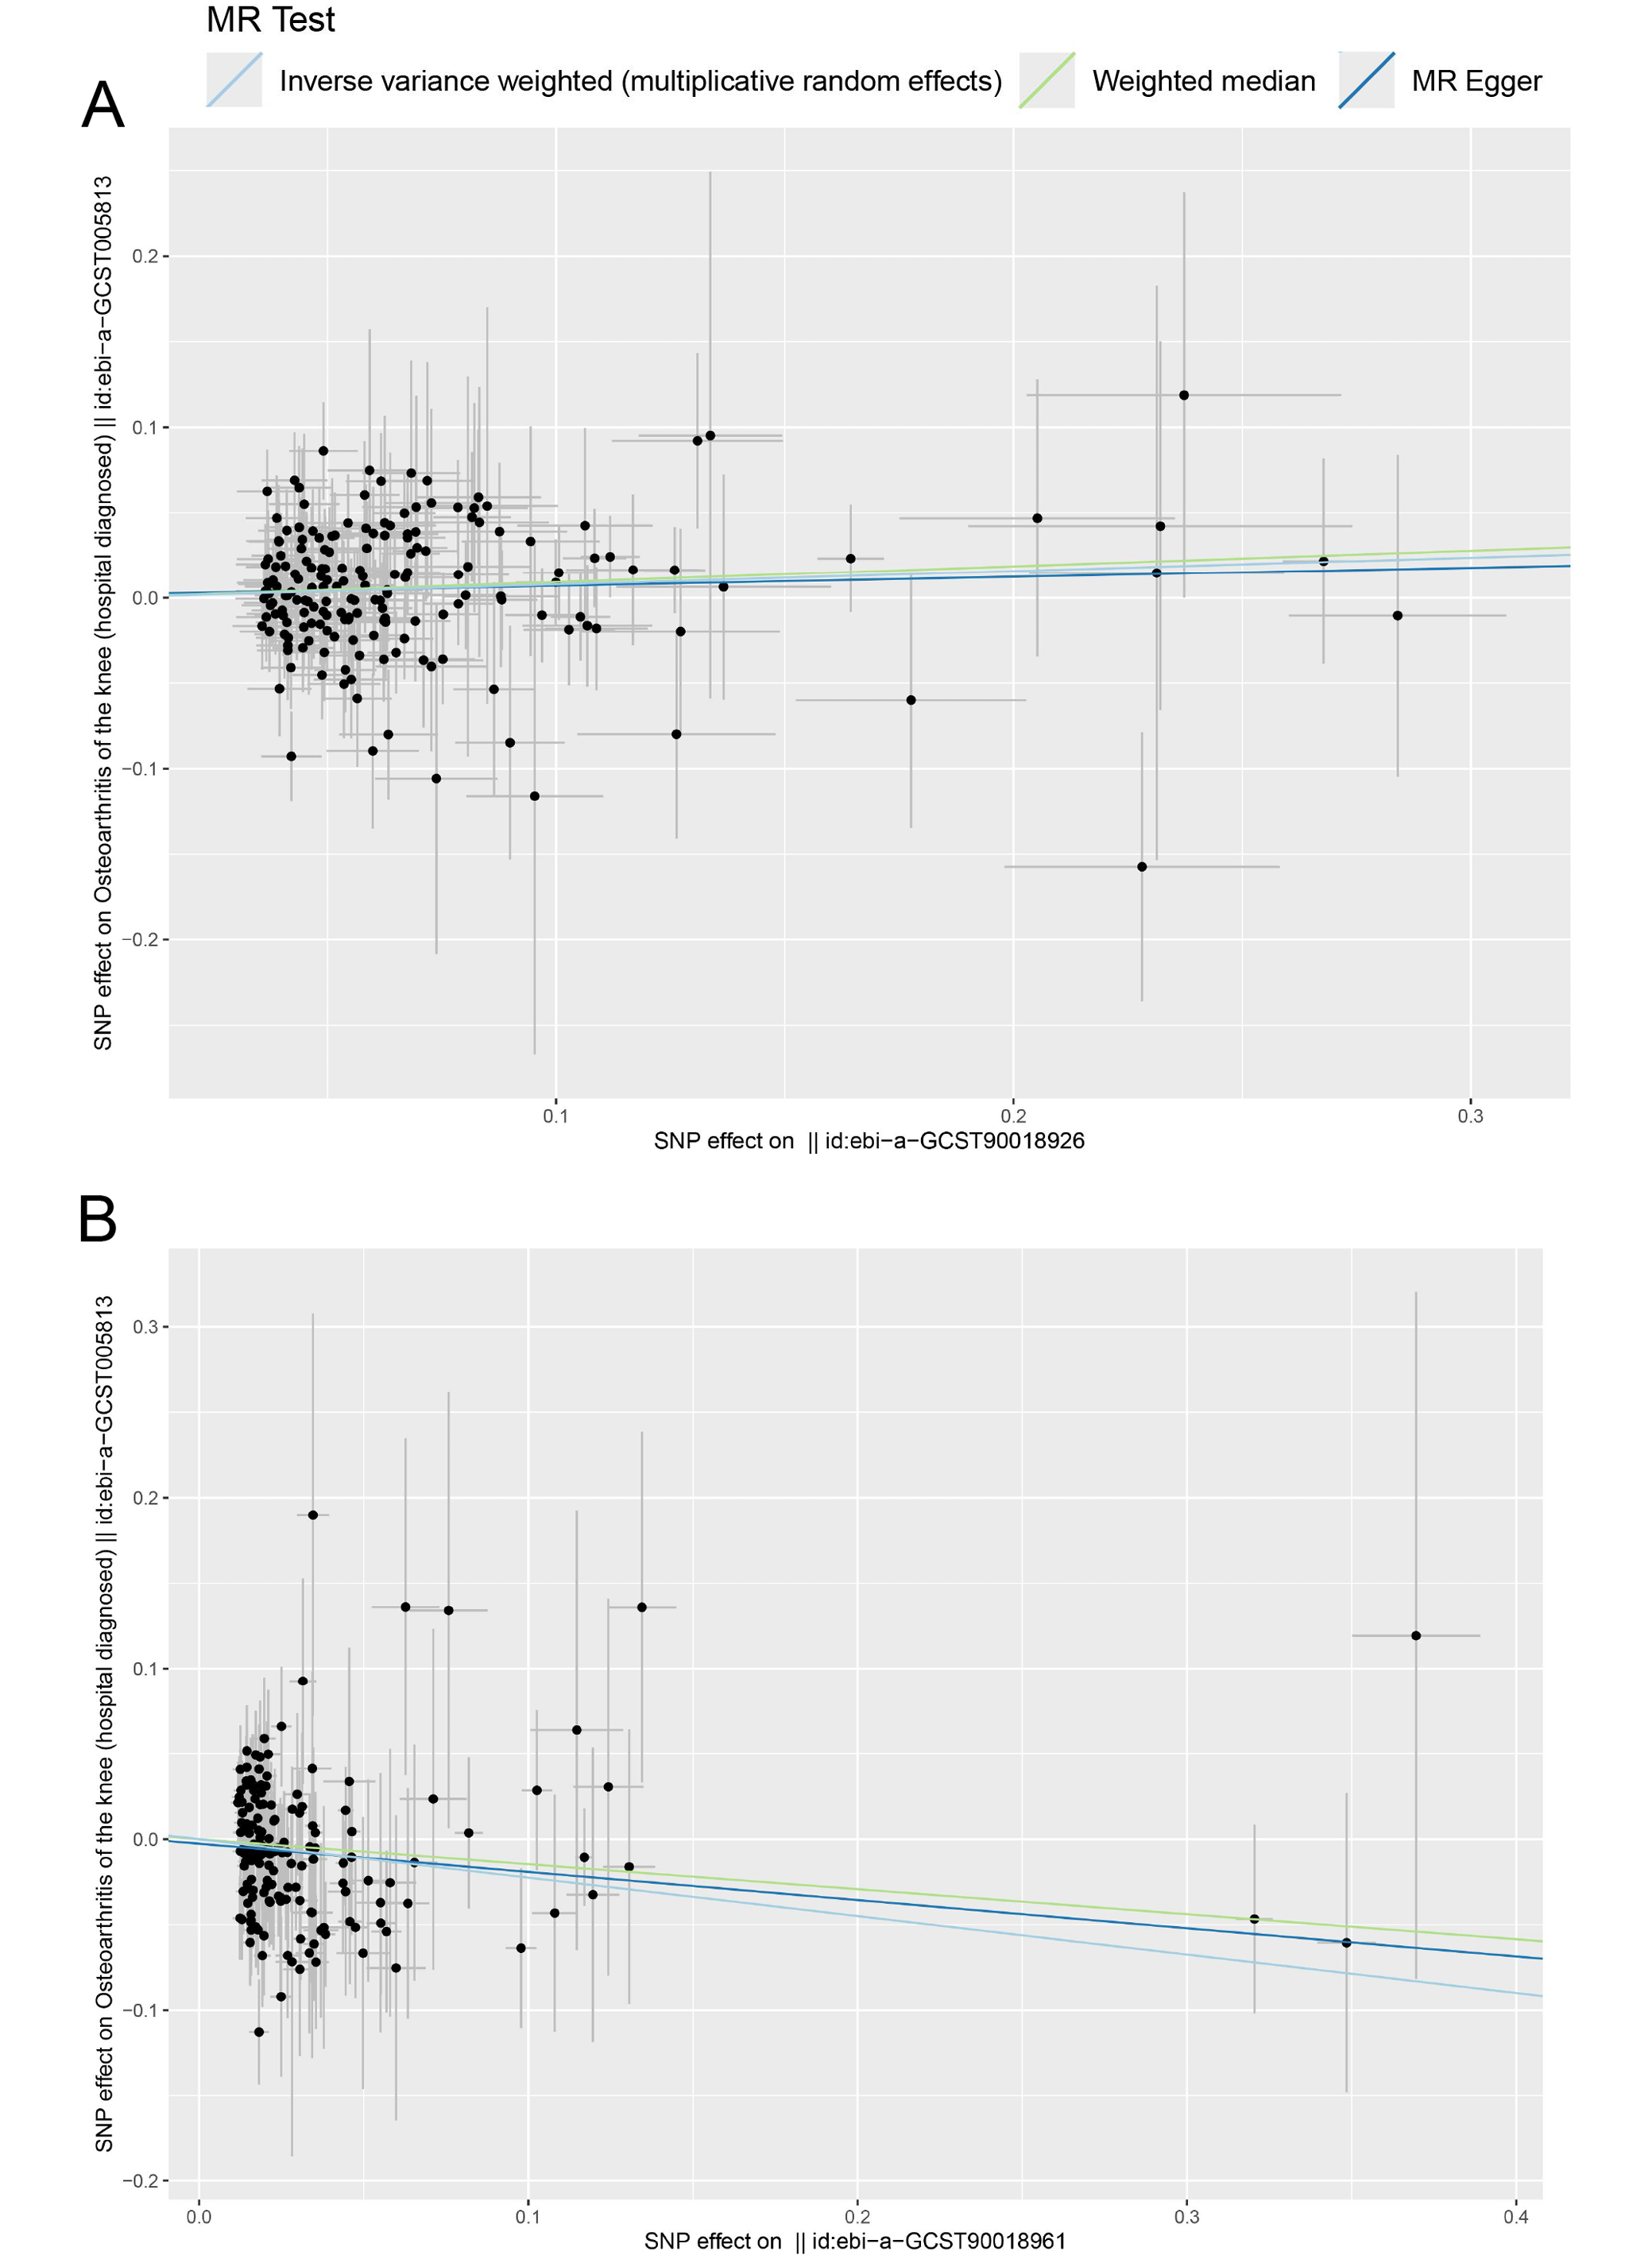
To rule out bidirectional causality in the MR analysis, we conducted additional analyses using diabetes-related and blood lipid traits as exposures and OA as the outcome. Results were considered robust when the IVW estimates were statistically significant and supported by consistent trends in both the MR-Egger regression and the WM analyses (Figure 3, Figure 4, Figure 5). The MR analysis found a potential causal relationship between fasting insulin (OR = 2.568, 95% CI: 1.192–5.536, p = 0.016) and HOA (Figure 3, Figure 4, Figure 5). Both the WM method and MR-Egger regression showed trends consistent with the IVW findings, confirming the robustness of this association. Glycated hemoglobin (OR = 1.675, 95% CI: 1.254–2.238, p < 0.01), T2D (OR = 1.082, 95% CI: 1.008–1.162, p = 0.03) and LDL-C (OR = 0.799, 95% CI: 0.688–0.928, p < 0.01) showed potential causal relationships with KOA (Figure 3B). Hemoglobin A1c was significantly associated with an increased risk of KOA (OR = 1.675, 95% CI: 1.254–2.238, p < 0.01). This finding suggested that elevated blood glucose may contribute to KOA development via inflammatory or metabolic pathways. Genetically predicted HbA1c and T2D were identified as potential risk factors for KOA (Figure 4B,C), while LDL-C (OR = 0.799, 95% CI: 0.688–0.928, p < 0.01) was identified as a potential protective factor for KOA (Figure 4D). For each SD increase in LDL-C, the risk of developing KOA decreased by 20.1%. Although LDL-C showed an OR of 0.799 (95% CI: 0.688–0.928, p < 0.01), suggesting an inverse association with KOA, the role of lipid metabolism in OA was complex. Simply interpreting this result as LDL-C being protective may be oversimplifying the findings because of the complex role of lipid metabolism in OA. Thus, at this stage, LDL-C may represent a potential protective factor, although its mechanism and effects warrant further investigation. In sensitivity analyses, no results showed heterogeneity (Q_pval > 0.05) or horizontal pleiotropy (p > 0.05) (Table 4, Table 5), indicating the robustness of the findings.
Discussion
This study used MR analysis to explore the causal relationships between diabetes-related and blood lipids risk factors and KOA and HOA. The results revealed a significant causal association between fasting insulin levels and HOA. Glycated hemoglobin, T2D and LDL-C showed potential causal associations with KOA. Genetically predicted HbA1c and T2D were identified as potential risk factors for KOA, whereas LDL-C appeared to have a potential protective association. Apart from these findings, no other blood glucose or lipid risk factors showed causal relationships with KOA or HOA, and no evidence of horizontal pleiotropy was detected in the MR analysis.
Several factors may explain the absence of significant associations in other comparisons: 1. Insufficient sample size and statistical power of the IVs. For example, certain lipid traits (such as HDL-C) had a limited number of genetic IVs, potentially diminishing the capacity of MR analysis to identify causal effects. 2. The influence of confounding factors: Important confounders not included in the analysis may contribute to the negative results. For example, obesity was a significant risk factor for OA and a central component of metabolic syndrome.17 In obese individuals, elevated HDL-C levels may be counteracted by other metabolic abnormalities, potentially obscuring their protective effect in MR analysis. 3. Lifestyle factors (e.g., diet, exercise) or genetic differences that may obscure the impact of these risk factors. These observations provide a foundation for future mechanistic and translational research.
This study further examined the potential causal links between blood glucose markers and OA subtypes, focusing on their metabolic implications. Type 2 diabetes, a metabolic disease characterized by insulin resistance and inadequate insulin secretion, significantly influences both glucose and lipid metabolism.16 In the early stages of T2D, pancreatic β cells compensate for insulin resistance by secreting more insulin to maintain normal blood glucose levels, which leads to elevated fasting insulin. In later stages, as β cell function deteriorates, insulin secretion decreases, and blood glucose levels rise, often with fasting insulin levels remaining within normal limits.18 HbA1c, a key marker of long-term glycemic control, reflects average blood glucose over preceding months.19 Previous studies, such as Donath and Shoelson, have elucidated a significant association between high blood glucose levels and an increased risk of OA.20 Elevated fasting glucose showed a nonlinear relationship with increased OA risk, likely due to the inflammatory effects of high blood glucose levels. These elevated glucose levels trigger the formation of advanced glycation end-products (AGEs), which accumulate in tissues like cartilage, altering the structure of collagen and proteoglycans and impairing normal cartilage function.21 The AGEs accelerate joint cartilage degradation through inflammation and oxidative stress pathways, inhibiting chondrocyte metabolism and promoting apoptosis.22 In diabetic patients, AGEs accumulate in cartilage, correlating with pain, stiffness, and functional impairment, which are key symptoms of OA.23 Long-term abnormal insulin levels can also exacerbate joint inflammation, leading to cartilage degradation.24, 25 Advanced glycation end-product accumulation enhances oxidative stress, damaging intracellular DNA, proteins and lipids, reducing cell proliferation and increasing cell apoptosis, thus promoting OA development.26, 27 Given these pathological mechanisms, and observational studies showing higher OA incidence in diabetic patients compared to non-diabetic populations,28, 29 this study supports the causal relationships between fasting insulin and HOA, and HbA1c and T2D with KOA. Regarding the differences in causal relationships between blood glucose factors and HOA and KOA, this study aligns with findings from Xing et al.,29 who assessed the causal relationships between KOA, HOA, and T2D risk, finding a causal relationship between KOA and T2D.30, 31
Abnormalities in lipid metabolism, particularly elevated LDL-C levels, have been confirmed to play a significant role in the pathogenesis of OA.32, 33 Lipid abnormalities, common in T2D, can lead to lipid accumulation in joint tissues and trigger local inflammatory responses.34, 35 Oxidized LDL-C binds to receptors on chondrocytes, activating stress and inflammatory pathways that promote oxidative stress and cartilage degradation.36 However, our study found that elevated LDL-C levels were associated with a reduced risk of KOA, which contradicts some clinical studies suggesting that high LDL-C levels increase KOA risk.37, 38, 39 This discrepancy might be explained by the potential effects of statins, which lower LDL-C and are commonly used to treat cardiovascular diseases.40, 41 Statins have been shown to interfere with cartilage metabolism and regeneration, potentially inhibiting chondrocyte proliferation and promoting apoptosis, thereby accelerating joint degradation.42, 43 Compared to studies reporting the anti-inflammatory effects of HDL-C, our research did not find a significant protective effect of HDL-C on OA.44, 45 Further studies are warranted to elucidate the specific roles and mechanisms of HDL-C in HOA and KOA.
The causal relationships identified between different blood glucose risk factors and KOA and HOA in this study might be influenced by metabolic mechanisms or other lifestyle factors that are specific to KOA and HOA.46 For example, obesity is a well-established confounding factor in OA, particularly due to its interaction with both diabetes and blood lipid levels.32 Abnormal diabetes-related and blood lipid levels often coexist and have complex metabolic interrelations.47 Type 2 diabetes not only affects glucose metabolism but also disrupts lipid metabolism, leading to elevated serum triglycerides and LDL-C.48 These metabolic abnormalities, along with insulin resistance and adiposity, exacerbate joint degradation through both inflammatory and mechanical pathways. Meng et al. emphasized that both T2D and hyperlipidemia are obesity-related risk factors, with T2D having a stronger association with KOA than HOA.33 The knee joint bears greater stress during walking and standing, has more synovial components and is more susceptible to high blood glucose levels.49
The clinical significance of these findings is considerable, particularly in the context of OA management and diabetes. Metabolic control, particularly of insulin resistance and glucose levels, may represent a key strategy for OA prevention and treatment. For example, commonly prescribed medications for diabetes, such as metformin, might also offer potential benefits in OA prevention or treatment. Furthermore, lifestyle interventions aimed at reducing insulin resistance and managing blood lipid levels could be included as part of OA prevention, especially for high-risk individuals.
Additionally, it is important to discuss the potential clinical applications of the study findings. Blood glucose management, including lifestyle interventions and medications such as GLP-1 receptor agonists, which also exert anti-inflammatory effects, should be integrated into OA management strategies. Regulating blood lipid levels is equally important; interventions to reduce LDL-C and increase HDL-C, including dietary adjustments and regular exercise, may reduce inflammation and improve joint health. Moreover, genetic screening could play a critical role in personalized interventions, identifying high-risk individuals and enabling more tailored strategies for OA prevention.
Limitations
Inevitably, there are some limitations in this study. First, MR studies rely on specific genetic variants as IVs, which may not fully capture the variations in diabetes-related and blood lipid levels, affecting the accuracy of causal inference. Second, the data in this study primarily come from European populations, limiting the generalizability of the results to other populations. Moreover, MR assumes that genetic variants are independent of confounding factors, which is challenging to achieve in practice, potentially impacting the results. Future studies should focus on investigating the combined effects of metabolic factors, such as insulin and lipid levels, on OA progression, particularly in non-European populations, to validate the findings and explore the role of ethnicity in disease progression. Additionally, research should aim to better understand the interactions between obesity, diabetes and OA, as obesity is a major confounder in these relationships. Clinical trials should also be encouraged to explore the use of drugs targeting lipid and glucose metabolism in OA treatment, to assess their potential therapeutic benefits. Also, larger sample sizes and more diverse genetic variants are required to improve accuracy and reliability. A combination of expanded genetic instruments and more diverse populations is needed to clarify how metabolic risk factors contribute to OA across varying ethnic and environmental contexts.
Conclusions
This study clarifies the causal relationships between diabetes-related and blood lipid risk factors and both KOA and HOA using MR analysis. Fasting insulin, HbA1c and T2D were identified as significant risk factors for KOA and HOA, while LDL-C showed a potential protective association with KOA. These findings emphasize the importance of managing metabolic factors, such as blood glucose levels and insulin resistance, in OA prevention and treatment. Targeting these factors through lifestyle interventions or pharmacological therapies may help reduce OA burden and improve clinical outcomes. An integrated approach to managing both diabetes and OA may reduce healthcare costs and enhance overall treatment effectiveness. Future research should explore the mechanisms underlying these relationships and investigate therapeutic strategies targeting metabolic pathways to slow OA progression, offering a more tailored approach to OA management.
Supplementary data
The supplementary materials are available at https://doi.org/10.5281/zenodo.15420786. The package contains the following files:
Supplementary Material 1. MR_OA_Metabolic_Analysis in CODE.R.
Data Availability Statement
Data sharing does not apply to this article, as all data are already included in the manuscript.
Consent for publication
Not applicable.
Use of AI and AI-assisted technologies
Not applicable.