Abstract
Background. Osteoarthritis (OA) and chondrosarcoma (CHS) are joint-disabling diseases that differ in their clinical manifestations, pathobiological mechanisms and management strategies.
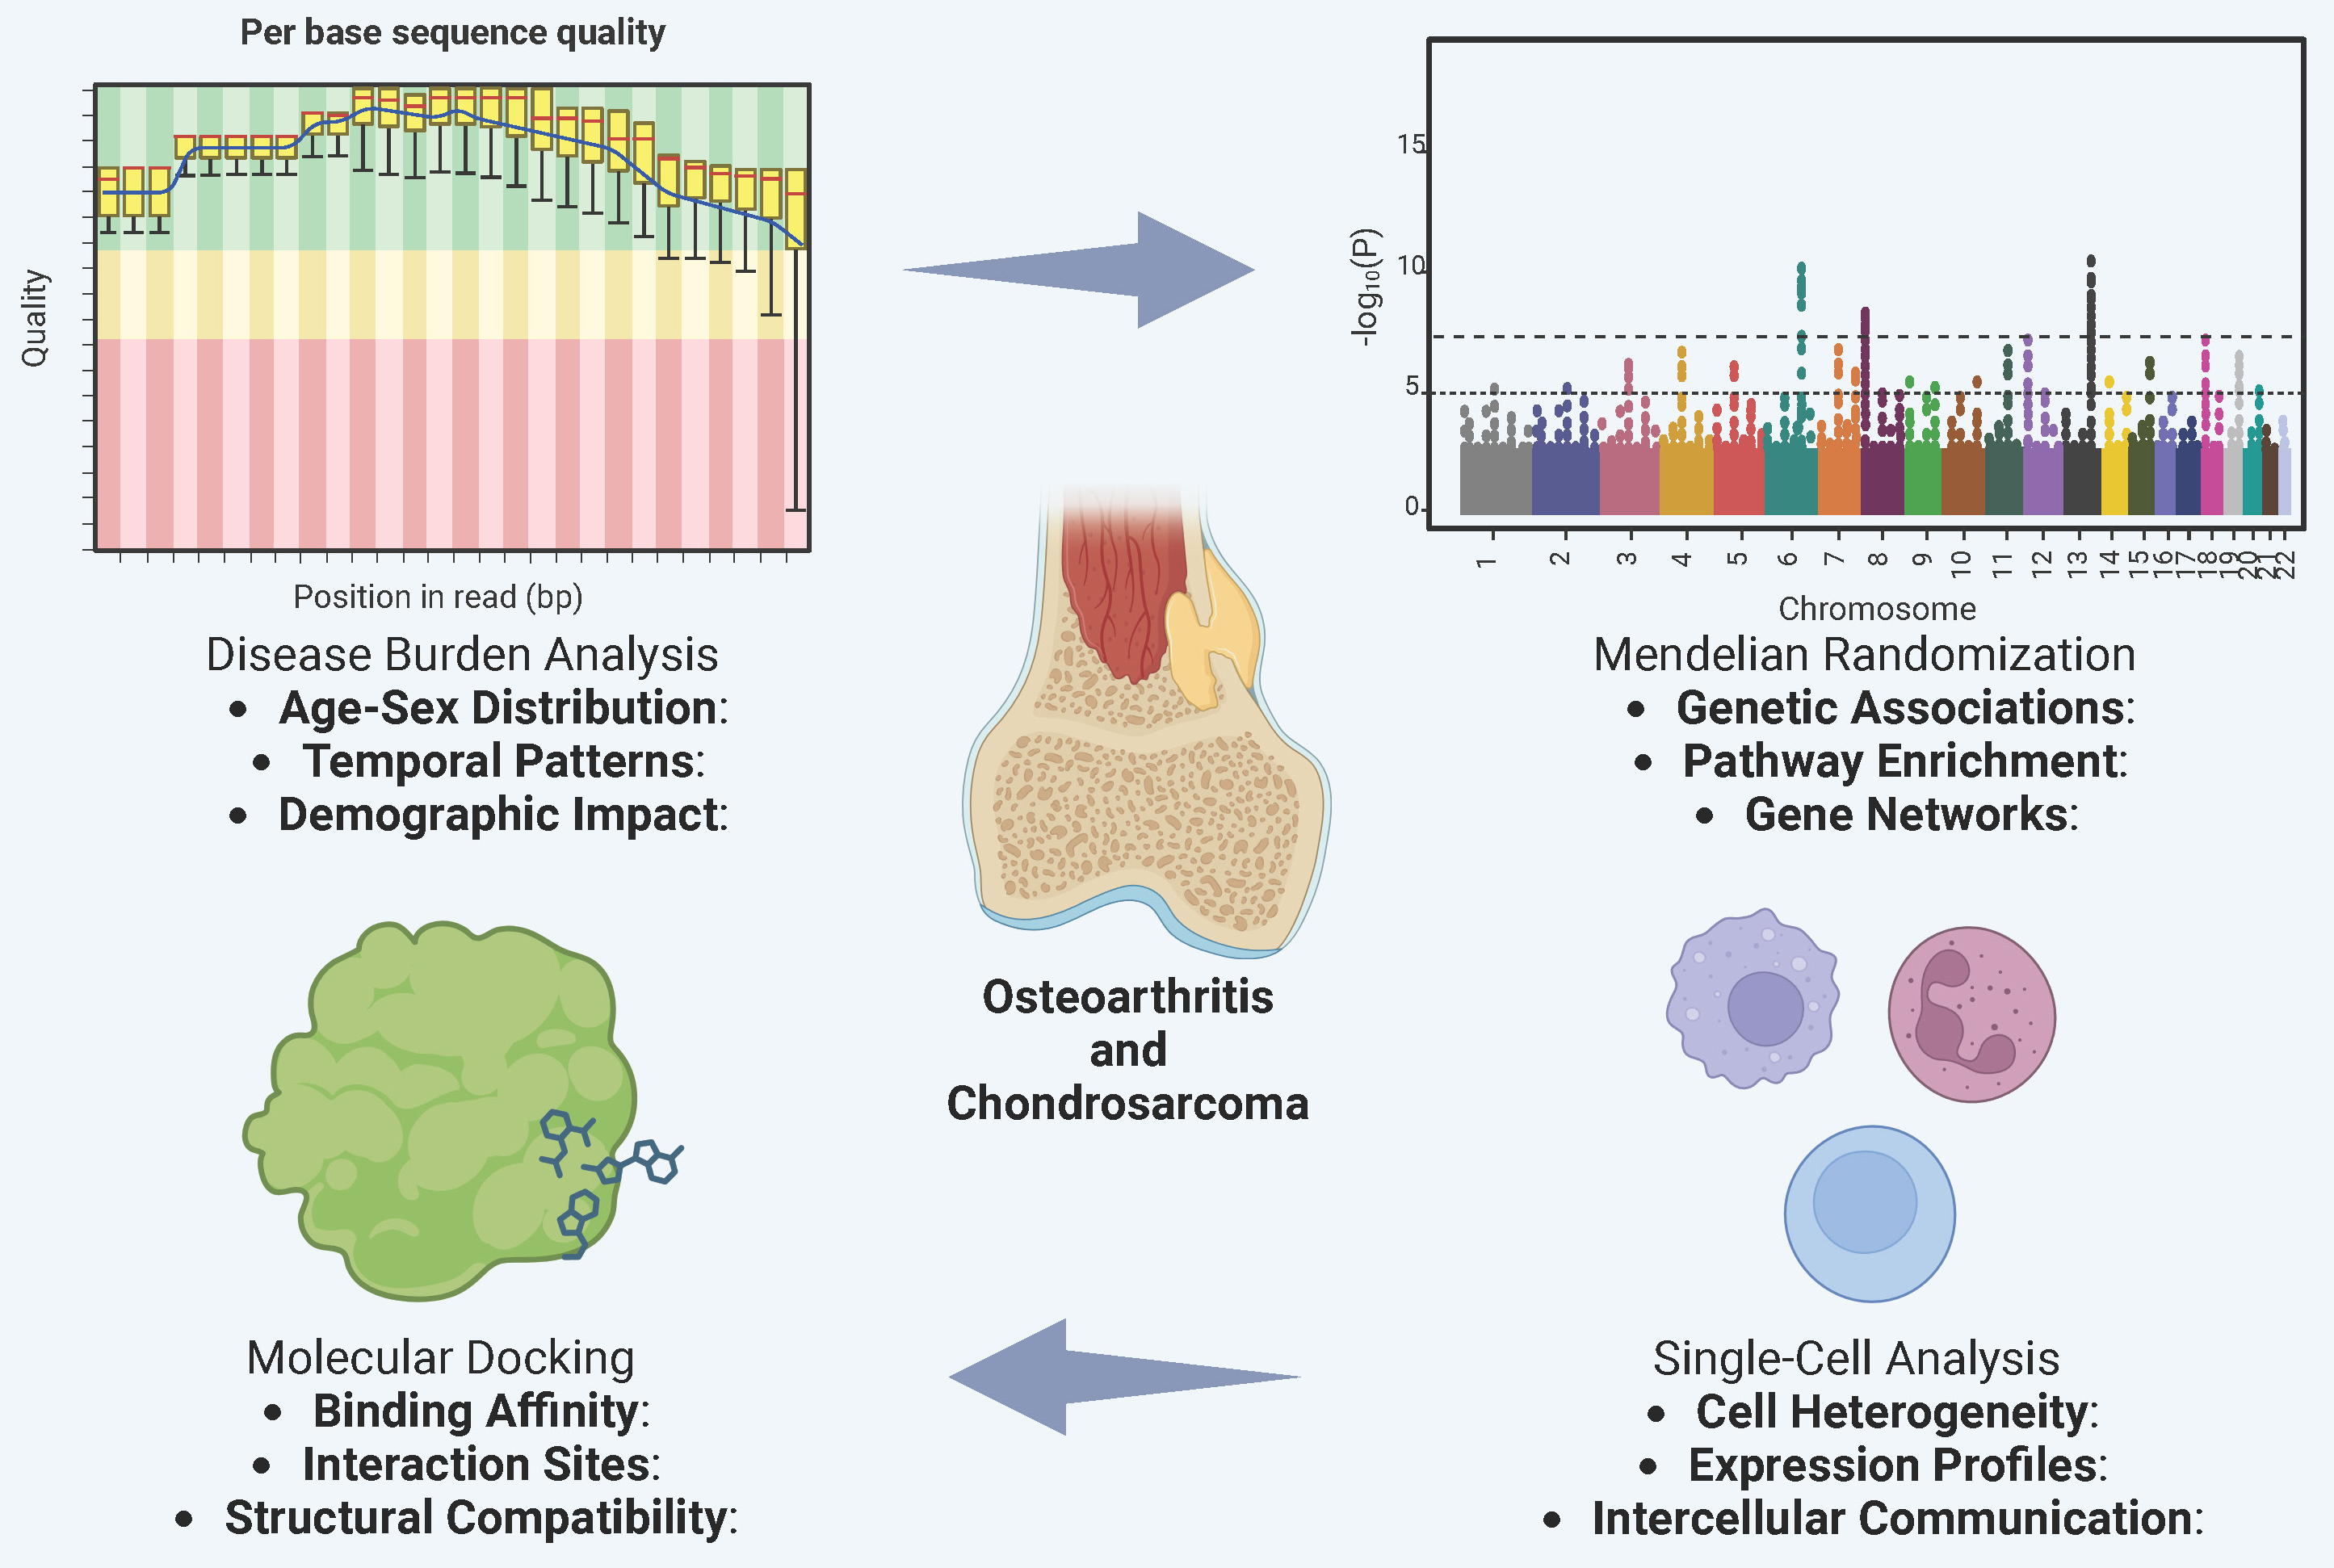
Objectives. This study aims to investigate the cellular heterogeneity and molecular mechanisms underlying osteoarthritis and CHS using single-cell RNA sequencing and molecular docking approaches, with the goal of identifying potential therapeutic targets.
Materials and methods. Publicly available single-cell RNA sequencing datasets for osteoarthritis and CHS were retrieved for detailed analysis. The t-distributed stochastic neighbor embedding method (t-SNE) and the uniform manifold approximation and projection (UMAP) method were used to visualize cellular clustering, and differential expression analyses were performed to evaluate key genes across distinct cell populations. Additionally, we conducted a computational study, including molecular docking of the DAP3 protein with the natural compounds curcumin and resveratrol, to assess their potential as therapeutic agents.
Results. We identified significant differences in the distribution of cell subpopulations and gene expression profiles between OA and CHS. Only selected cell subgroups – including neurons, chondrocytes and immune cells – exhibited tissue-specific expression differences in disease-associated genes. In silico molecular docking demonstrated that curcumin and resveratrol can bind to the DAP3 protein suggesting a potential molecular basis for developing novel therapeutic strategies.
Conclusions. This study provides detailed single-cell insights into OA and CHS and identifies potential therapeutic targets. These findings not only deepen our understanding of the cellular and molecular features of these diseases but also highlight promising avenues for future therapeutic development.
Key words: osteoarthritis, molecular docking, bioinformatics analysis, single-cell RNA sequencing, chondrosarcoma
Background
Osteoarthritis (OA) and chondrosarcoma (CHS) represent 2 major yet fundamentally distinct joint disorders. Osteoarthritis is characterized by progressive cartilage erosion and joint degeneration, whereas CHS is a malignant bone tumor with cartilaginous differentiation and carries a high mortality rate. Despite their contrasting clinical and pathological profiles, both conditions significantly impair function, mobility and overall quality of life.
Research on OA has identified multiple molecular syndromes, signaling pathways and regulatory factors involved in disease progression. For example, the transforming growth factor beta (TGF-β) signaling pathway plays a central role in mediating inflammatory and age-related degenerative changes in OA. The Wnt/β-catenin pathway is crucial in regulating cell fate, while Runx2 and Cbfb are essential for skeletal development. In contrast, CHS is an aggressive malignancy characterized by high invasiveness and poor prognosis. Although OA and CHS are pathologically distinct, emerging evidence suggests that they may share certain molecular mechanisms.1, 2, 3, 4
Osteoarthritis is a prevalent degenerative joint disease caused by the gradual breakdown of articular cartilage, resulting in pain, stiffness and limited mobility. It is a leading cause of disability in older adults, with incidence increasing with age.5 Chondrosarcoma, although less common, is highly malignant and invasive, leading to significant mortality.6 Comparative molecular analyses indicate potential mechanistic overlap between these diseases.6
Recent advances in single-cell RNA sequencing (scRNA-seq) have enabled detailed characterization of cellular heterogeneity in complex diseases. This technology provides gene expression profiles at single-cell resolution across diverse cell types, uncovering the molecular basis of disease pathogenesis. In CHS, scRNA-seq facilitates the identification of critical cell subpopulations and their interactions within the tumor microenvironment (TME), which are relevant for biological progression and development.7, 8 Comparative analysis of scRNA-seq data from OA and CHS reveals both cellular similarities and differences, highlighting potential biological associations between the 2 conditions.
Beyond clinical manifestations, the differences between OA and CHS extend to their underlying etiology. Osteoarthritis is primarily a chronic degenerative disease driven by mechanical stress and inflammatory responses, whereas CHS results from malignant transformation caused by genetic mutations. Both conditions exhibit disrupted chondrocyte homeostasis, with imbalances between proliferation and apoptosis. The immune system may contribute directly or indirectly to the pathogenesis of both diseases. Notably, chronic inflammation has been associated with tumorigenesis and cancer progression. Single-cell sequencing enables comprehensive characterization of signaling activity and molecular targets in immune cells, chondrocytes and related cell populations in these diseases.9, 10
Molecular docking is an essential computational approach for assessing the therapeutic potential of natural compounds. Previous studies have demonstrated that curcumin and resveratrol, which have anti-inflammatory and anticancer properties, can bind to the DAP3 protein through molecular docking.11, 12, 13 These compounds may offer new therapeutic strategies for OA and CHS. Identifying and validating such molecular targets could support the development of improved treatments.
Objectives
This study aims to investigate the cellular heterogeneity and molecular mechanisms underlying OA and CHS using scRNA-seq and molecular docking approaches, identifying potential therapeutic targets and shared pathways between these distinct joint disorders.
Materials and methods
Patients
This Mendelian randomization (MR) analysis utilized 2 datasets derived exclusively from publicly available genome-wide association study (GWAS) summary statistics. All datasets were sourced from the UK Biobank (gwas.mrcieu.ac.uk/datasets) and are free of conflicts of interest. The arthritis dataset (finngen_R11_PRIM_KNEEARTHROSIS) was analyzed using a fixed-effect meta-analysis model. To minimize bias, individuals with a history of cancer or autoimmune diseases were excluded. Genetic variants serving as instrumental variables (IVs) were single-nucleotide polymorphisms (SNPs) with strong associations with the exposure. Exposure (OA) and outcome variables (e.g., cardiovascular disease (CVD)) were clearly defined and verified in the GWAS datasets.14, 15
Specimen characteristics
Gene expression data for OA and CHS patients were collected from the Gene Expression Omnibus (GEO) database (https://www.ncbi.nlm.nih.gov/geo). Control samples consisted of non-cancerous tissue from patients with thyroid conditions, derived from the same datasets. All datasets were publicly available and underwent quality control in their original studies. Data were stored according to open-source data-sharing guidelines.
Assay methods
RNA-seq and microarray datasets were used for gene expression profiling, and appropriate normalization methods were applied to correct for batch effects and technical variability. Differentially expressed genes (DEGs) relevant to thyroid cancer were identified, and all assays were performed blinded to clinical endpoints to minimize interpretive bias.
Molecular docking studies of curcumin and resveratrol were conducted using AutoDock Vina (Scripps Research Institute, La Jolla, USA). This analysis enabled the examination of their interactions with target proteins and binding affinities, providing insights into potential mechanisms of action and health effects.
Study design
Both datasets for the MR analysis were obtained from publicly accessible GWAS summary data from the UK Biobank (gwas.mrcieu.ac.uk/datasets). The primary endpoint was the observed difference in the distribution of cell subgroups between OA and CHS. Notably, neurons, chondrocytes and immune cells demonstrated tissue-related gene expression differences. The secondary endpoint was the identification of curcumin and resveratrol binding to the DAP3 protein in silico, suggesting possible molecular targets for new therapeutic strategies. Variables considered in the analyses included neurons, chondrocytes, immune cells, curcumin, and DAP3 protein. These were used to explore disease-specific differences, support prediction models and identify therapeutic targets. A large dataset from the GEO database was utilized to ensure adequate statistical power for detecting gene expression patterns.
Statistical analyses
scRNA-seq analysis was performed in several stages, including data preparation and quality control. Datasets identified by GEO Series (GSE) numbers, along with single-cell entries such as GSM5362559 and GSM5578183_L31, were downloaded from the GEO database. Quality control procedures excluded cells with fewer than 200 or more than 2,500 detected genes to remove low-quality cells and potential doublets. Cells with mitochondrial gene expression above 5% were excluded, as these indicate stress or apoptosis.16, 17 Principal component analysis (PCA) was used to visualize tumor sample distributions and explain variance, while the JackStraw method identified the top 15 statistically significant principal components for downstream analysis. For t-distributed stochastic neighbor embedding (t-SNE) dimensionality reduction, cosine distance was used to calculate cell similarities, consistent with best practice for high-dimensional transcriptomic data. Cell–cell interaction network diagrams illustrated interactions among myeloid cells, T cells, natural killer (NK) cells, endothelial cells, fibroblasts, proliferating cells, dendritic cells, and B cells, highlighting their signaling roles.
Data visualization was achieved using heatmaps and violin plots to demonstrate gene expression differences across cell types. Combined with network diagrams of cell–cell interaction strength, the roles of macrophage migration inhibitory factor (MIF) and galectin (galectin family proteins) signaling pathways in the TME were analyzed in detail. Bioinformatics analyses integrated gene expression and cell type data to identify biomarkers and therapeutic targets, using data mining and machine learning techniques to explore complex intercellular communication.
Results
Prevalence and incidence rates across age and sex
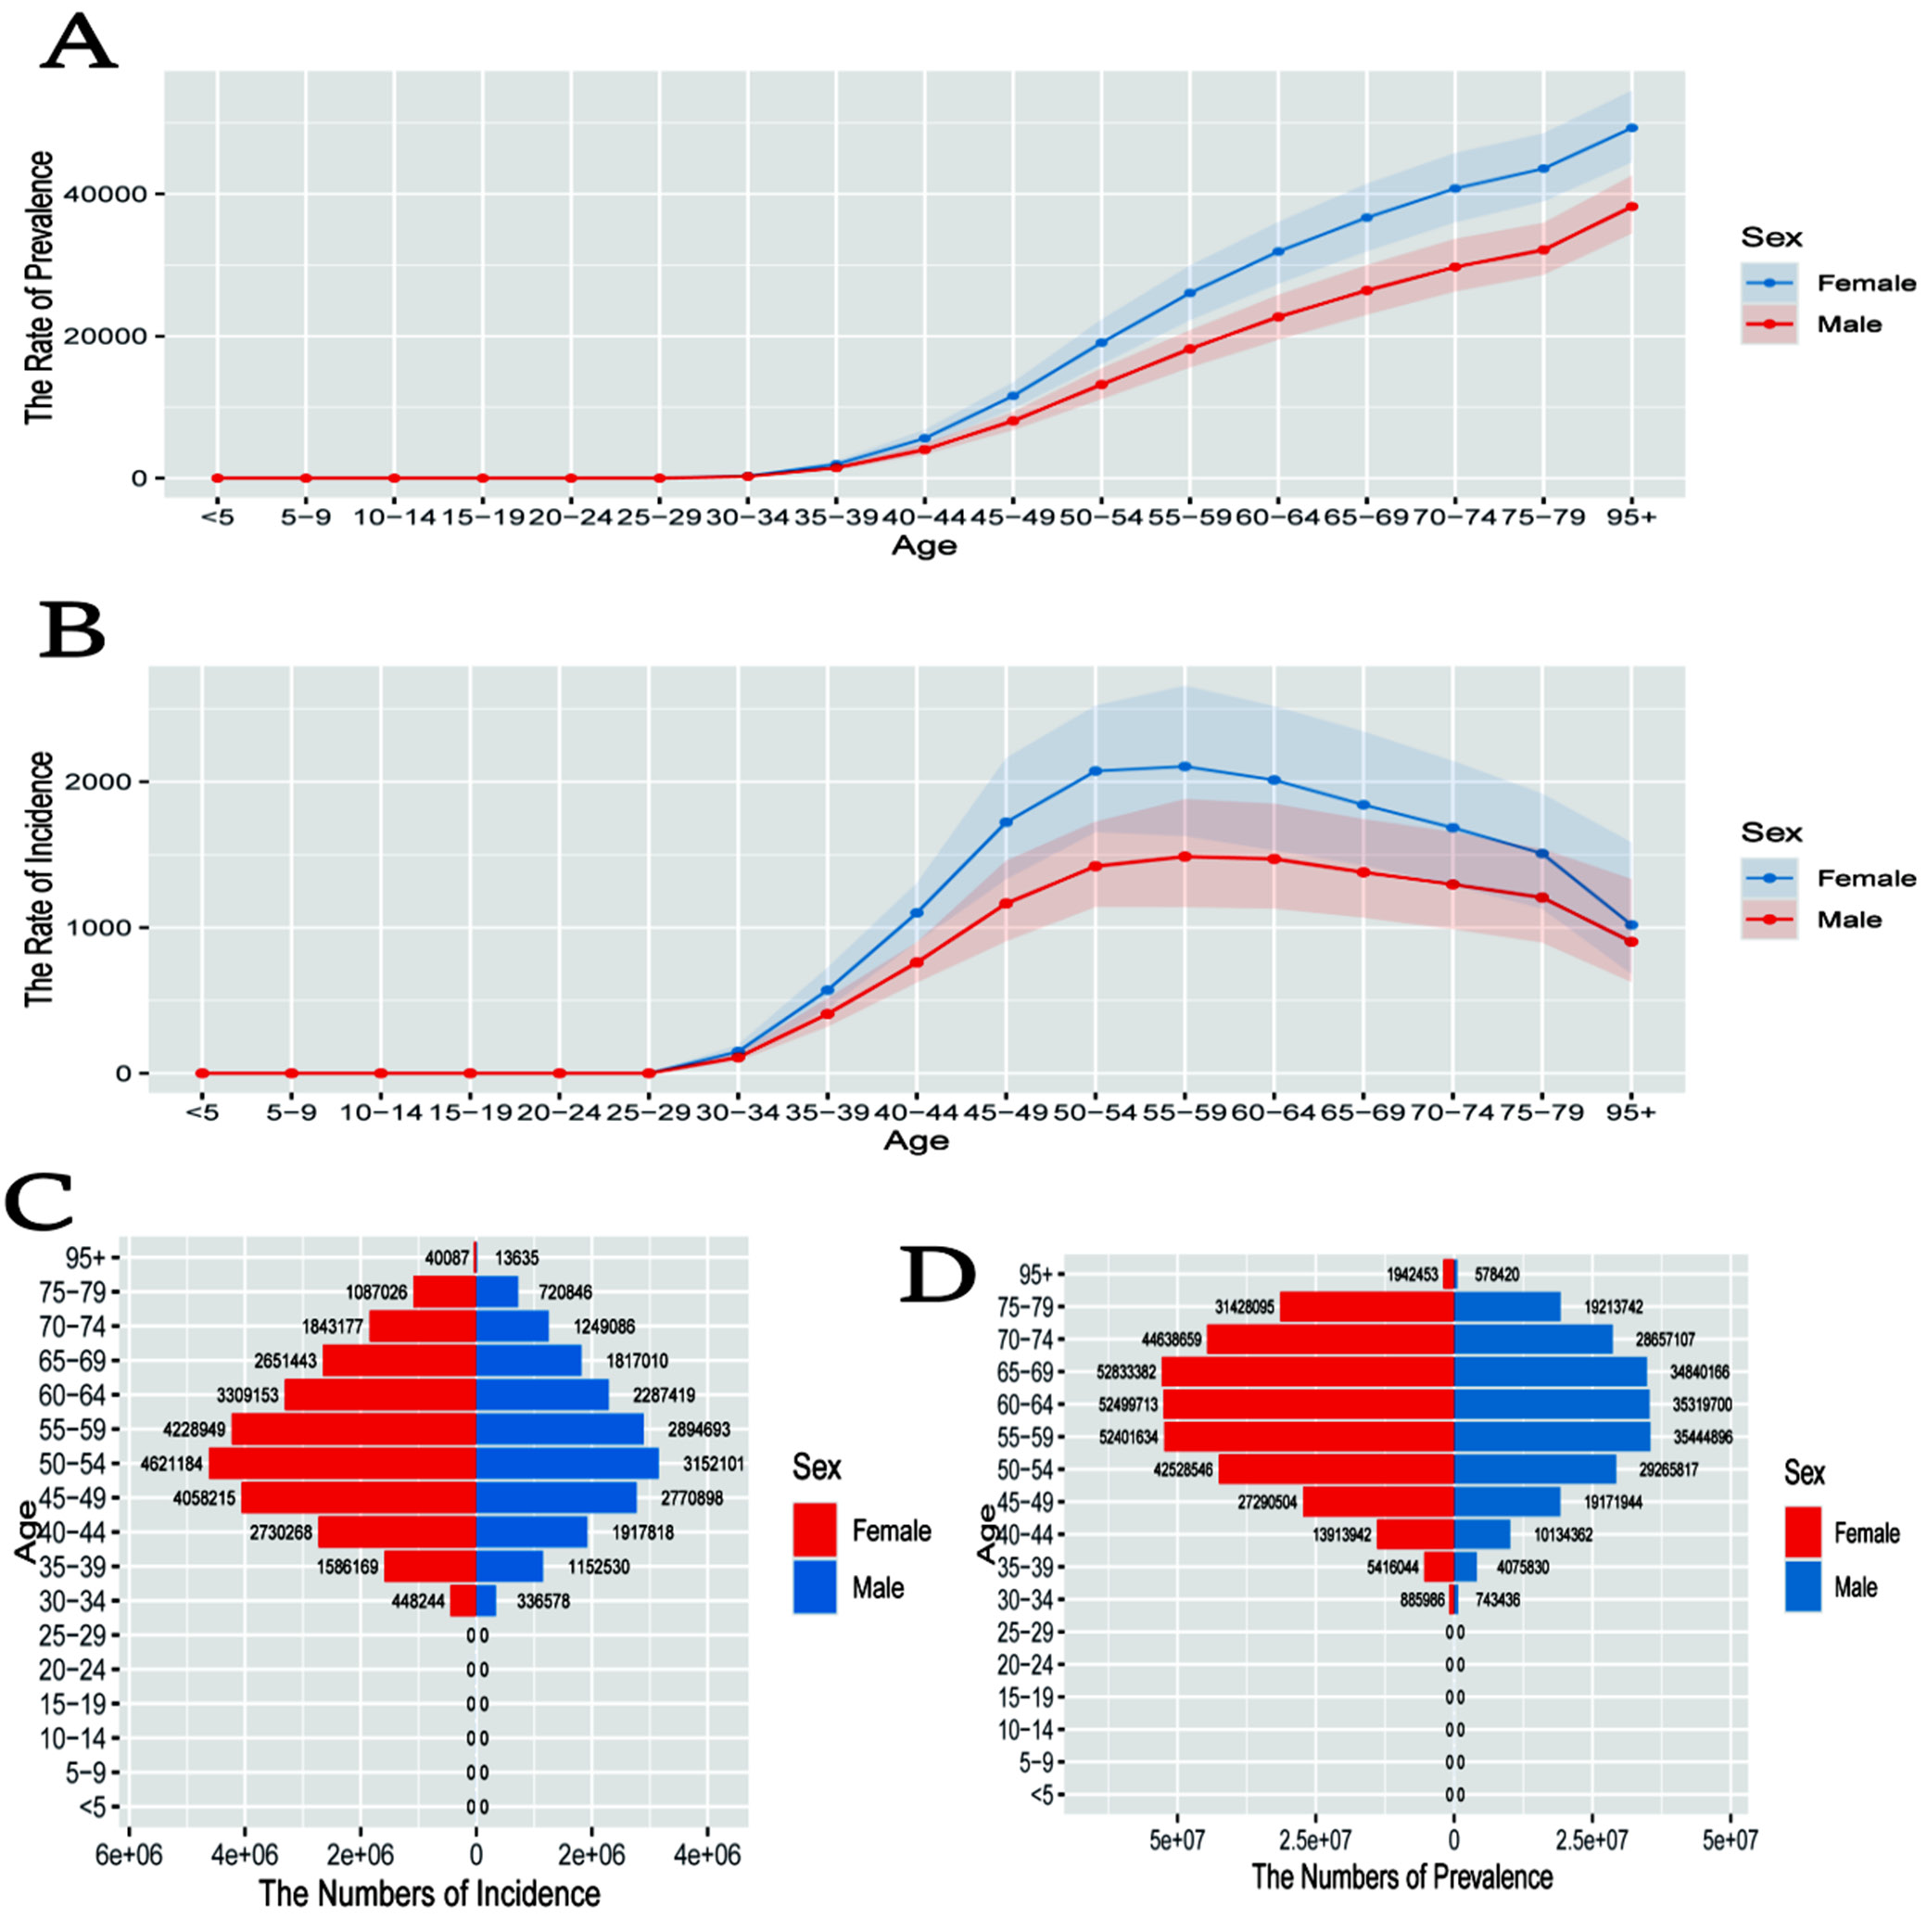
The line graph in Figure 1A illustrates age- and sex-specific prevalence rates, demonstrating a clear increase with advancing age. Women consistently exhibit higher prevalence than men, particularly after the age of 40. Figure 1B illustrates incidence rates by age and sex, with incidence rising with age and peaking at 70–79 years. Women exhibit higher incidence rates than men in most age groups. The pyramid chart in Figure 1C displays the distribution of incidence cases by age and sex, indicating a greater number of cases in older individuals, with a marked increase after the age of 40. Figure 1D presents prevalence case numbers stratified by age and sex, again demonstrating higher case counts in older age groups, with women exceeding men across most categories.
Trends and deviations in age, period and cohort effects
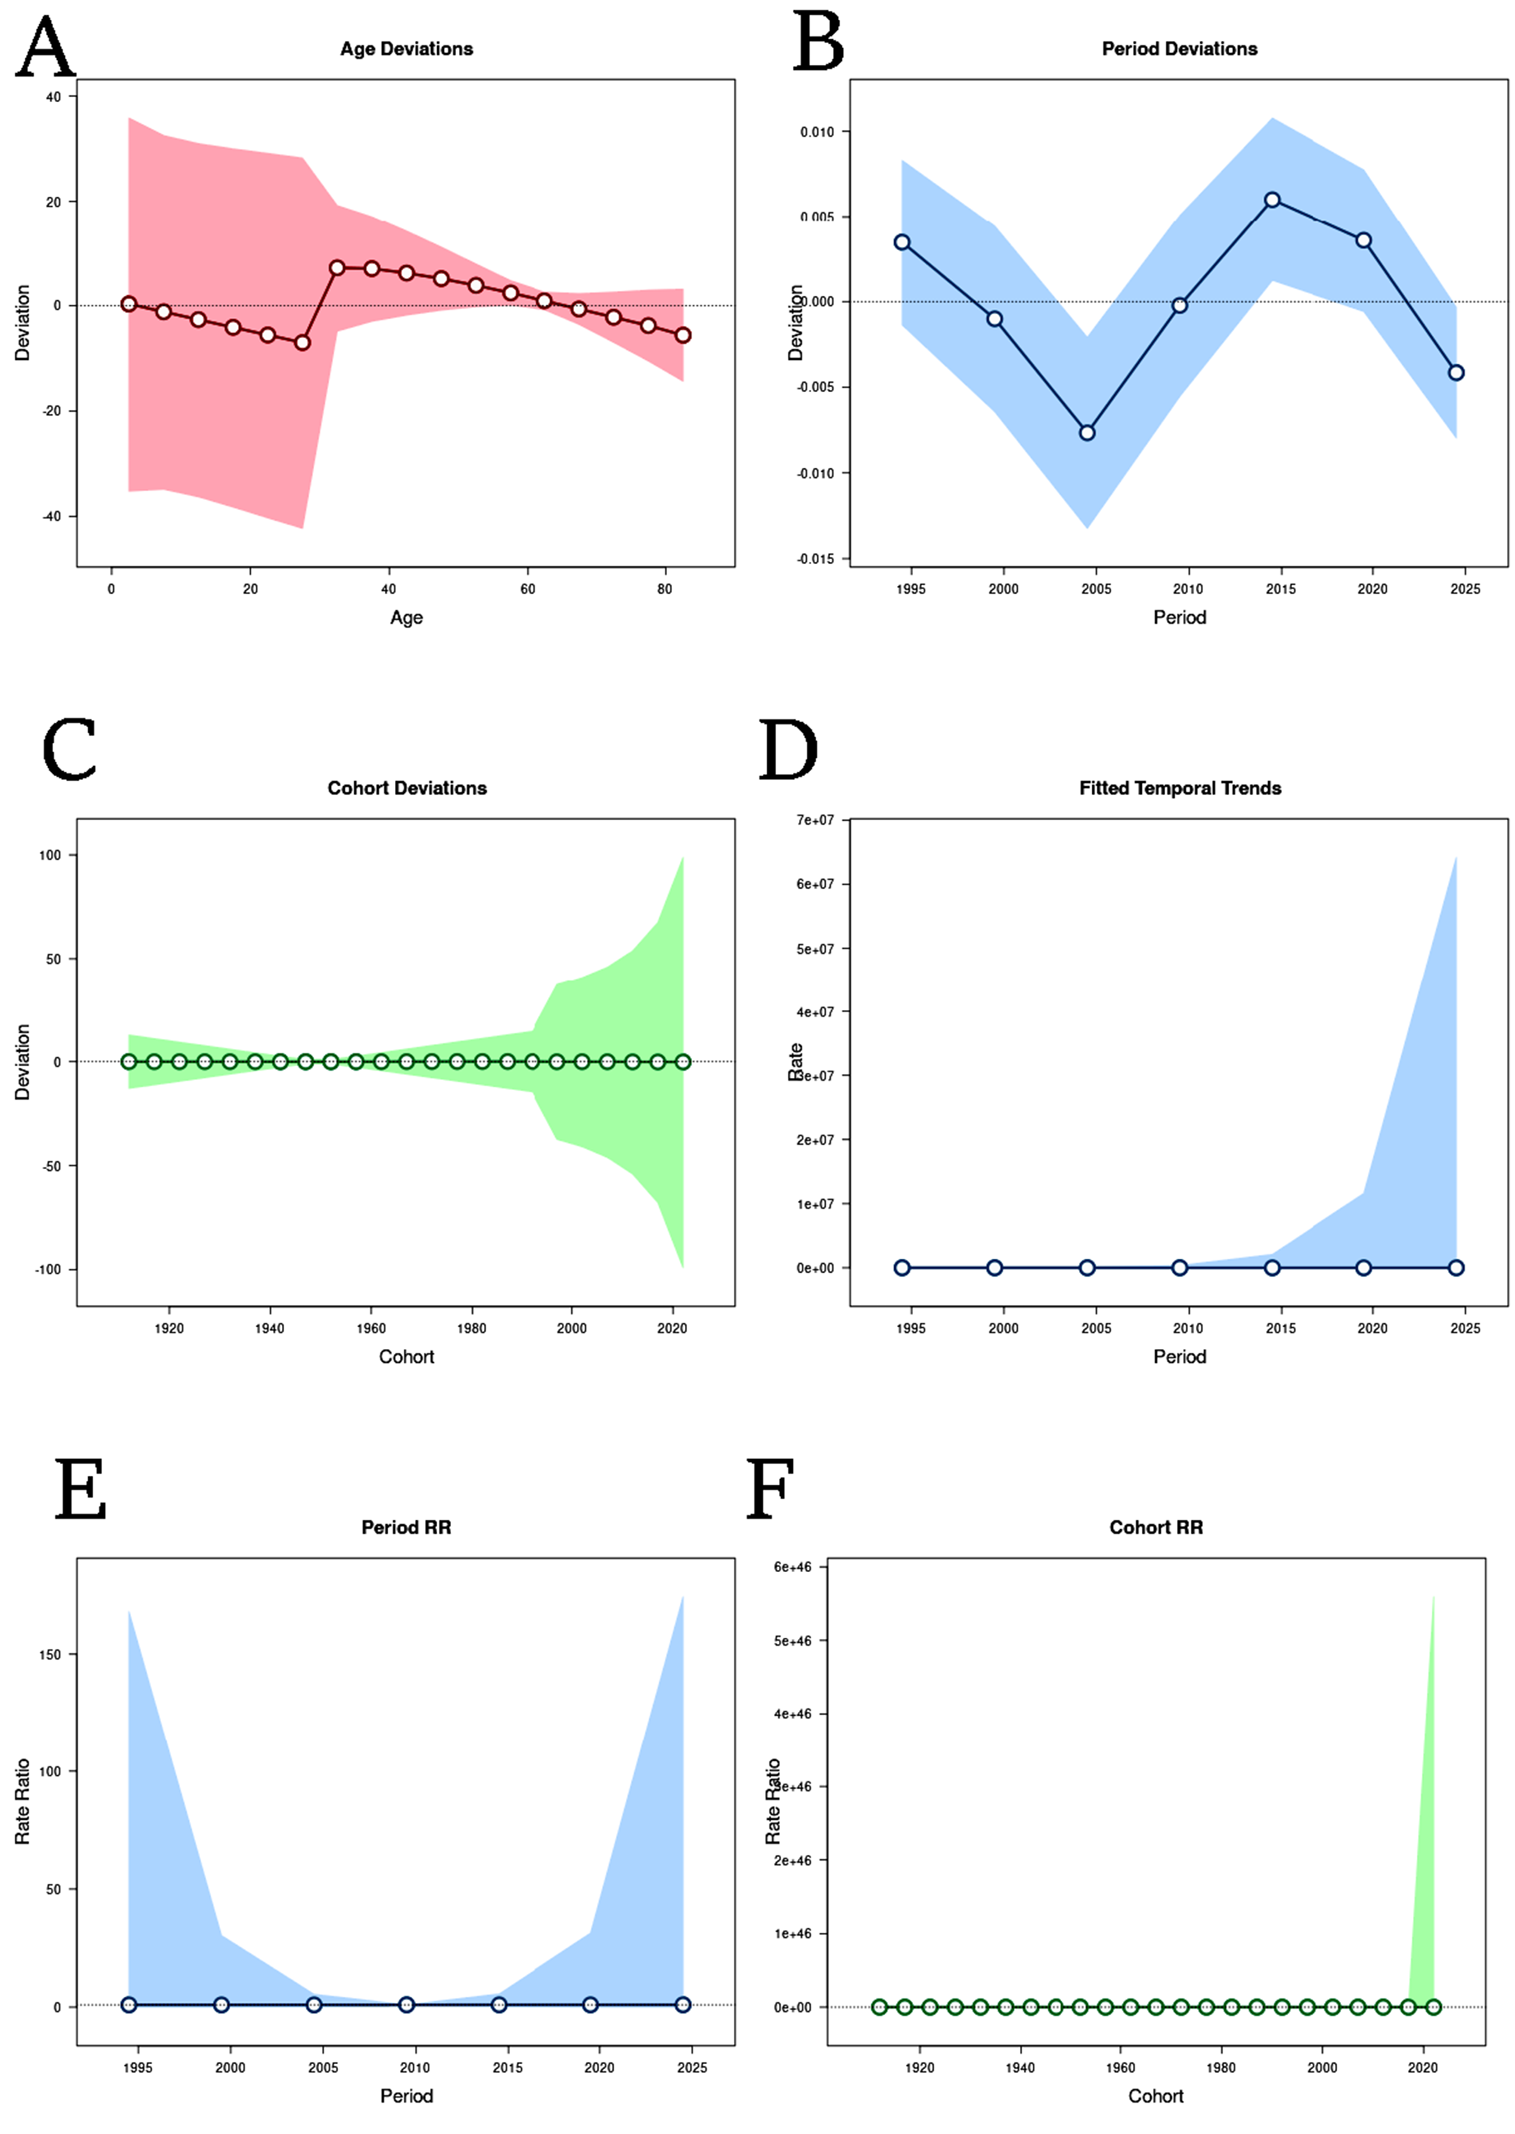
Figure 2A demonstrates the variation in deviation across age, with shaded confidence intervals reflecting greater variability at younger and older ages and increased stability in middle age. Figure 2B displays period-specific deviations, showing clear temporal fluctuations and indicating intervals with heightened or reduced deviations. Figure 2C displays cohort deviations, illustrating shifts in risk or exposure profiles across generations, with more pronounced deviations observed in the most recent cohorts. Figure 2D shows overall temporal trends fitted to the dataset, with a marked increase in the most recent period, reflecting a substantial shift in trend. Figure 2E presents relative risk across time periods, identifying specific periods with elevated risk. Figure 2F displays relative risk by cohort, with recent cohorts showing a pronounced increase, suggesting higher susceptibility or exposure.
Genetic analysis
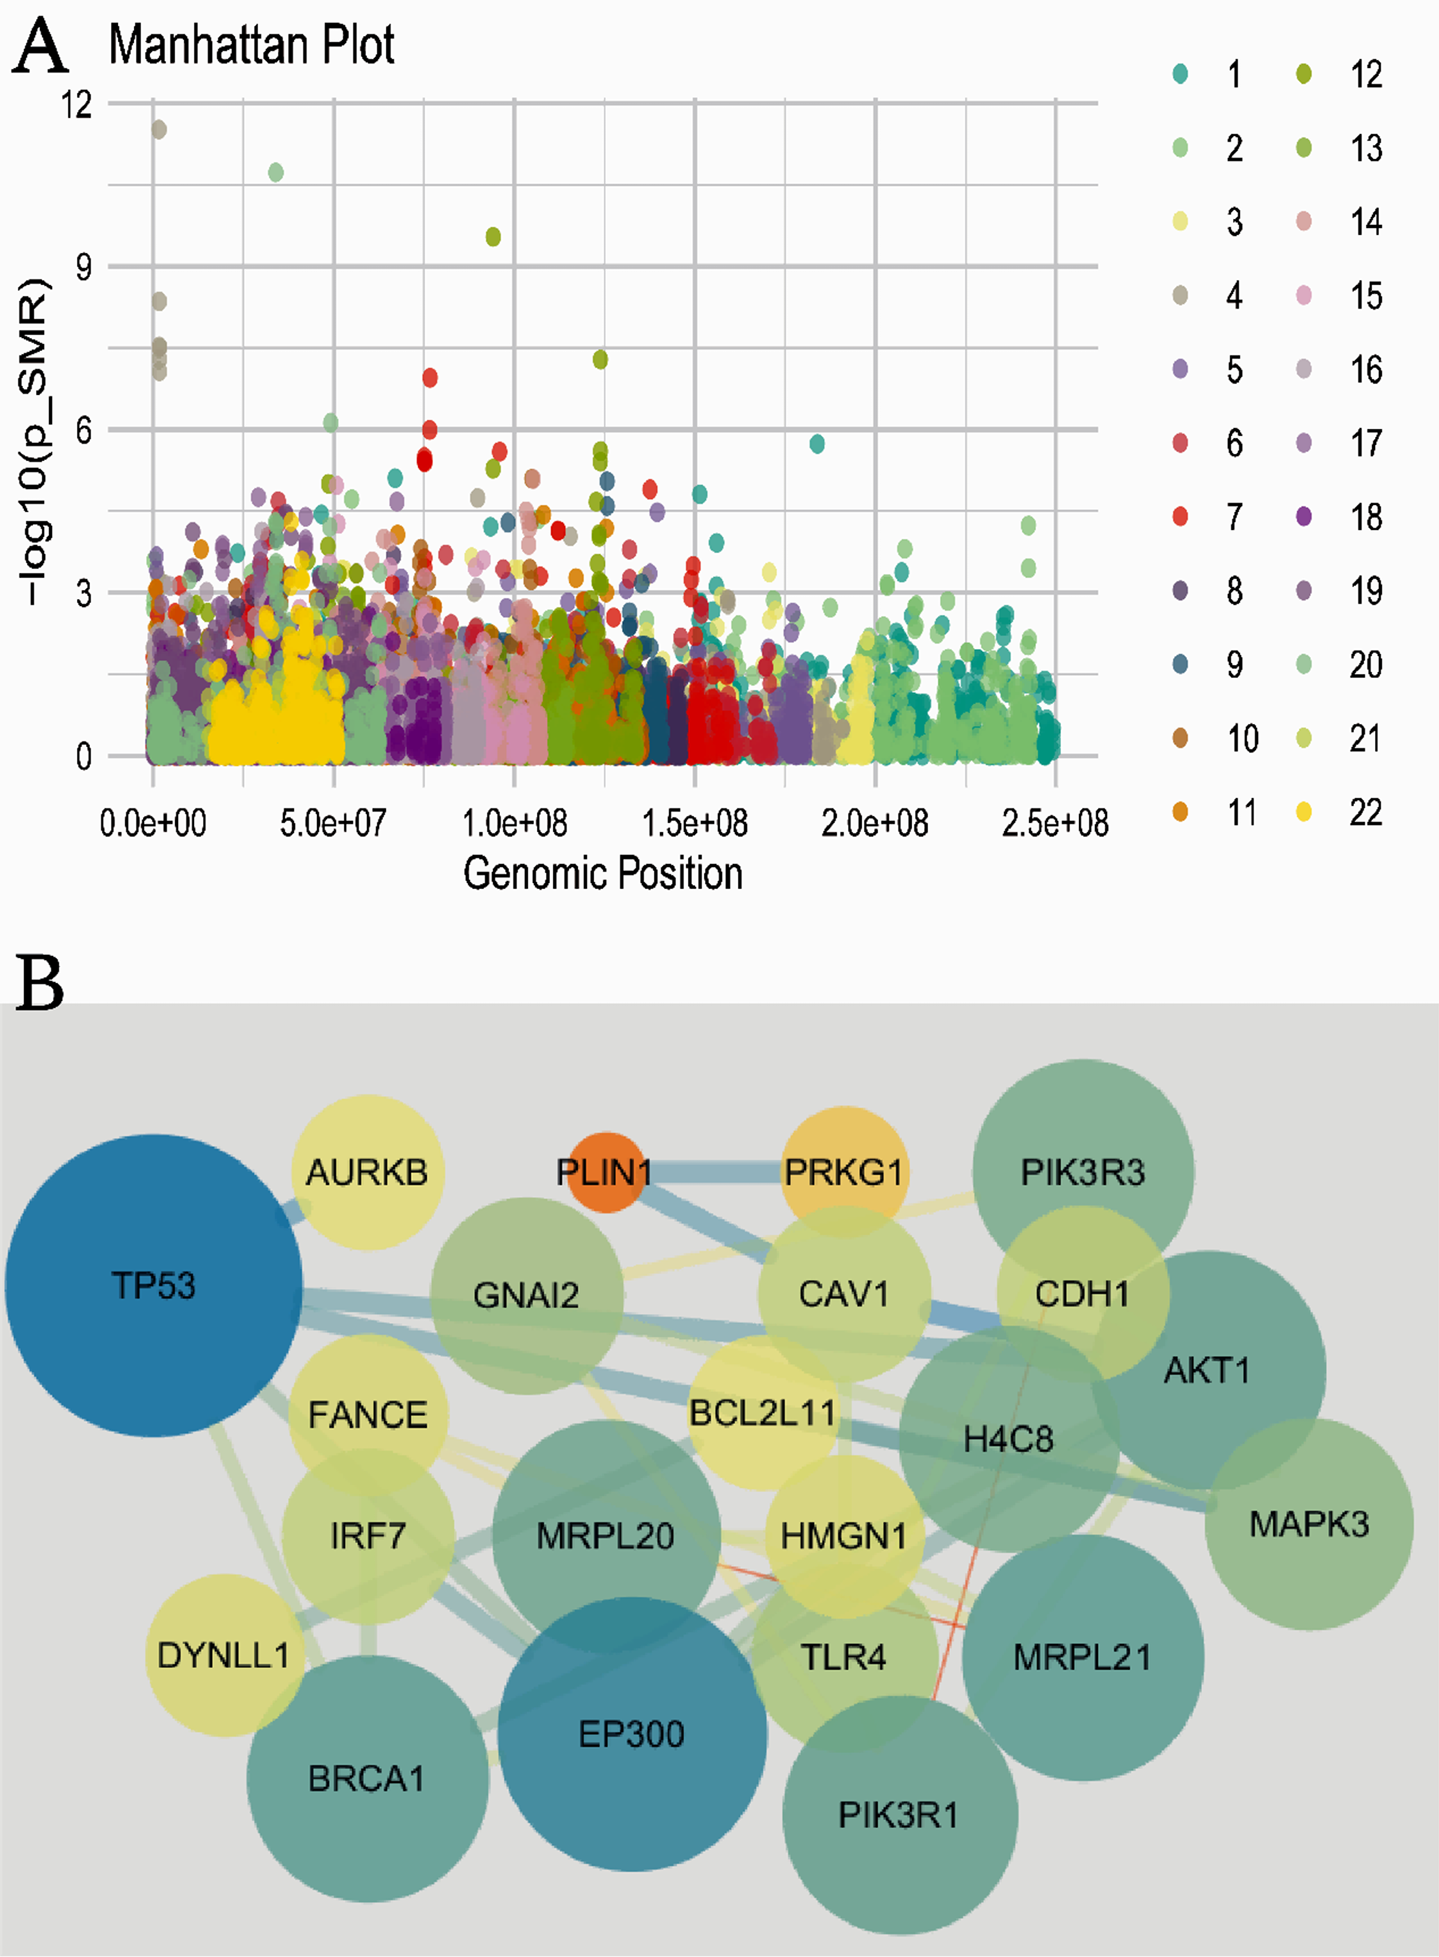
The Manhattan plot in Figure 3A depicts the significance of genetic variants throughout the genome. Each point denotes a variant’s genomic position (x-axis) and its significance (y-axis). Peaks highlight regions of significant association, and different colors distinguish individual chromosomes. The gene interaction network in Figure 3B visualizes gene connectivity; node size reflects gene importance or degree, and the connecting lines represent interactions. Notably, TP53 and EP300 are highly central, indicating pivotal roles in the genetic network.
GOKEGG and PPI analysis
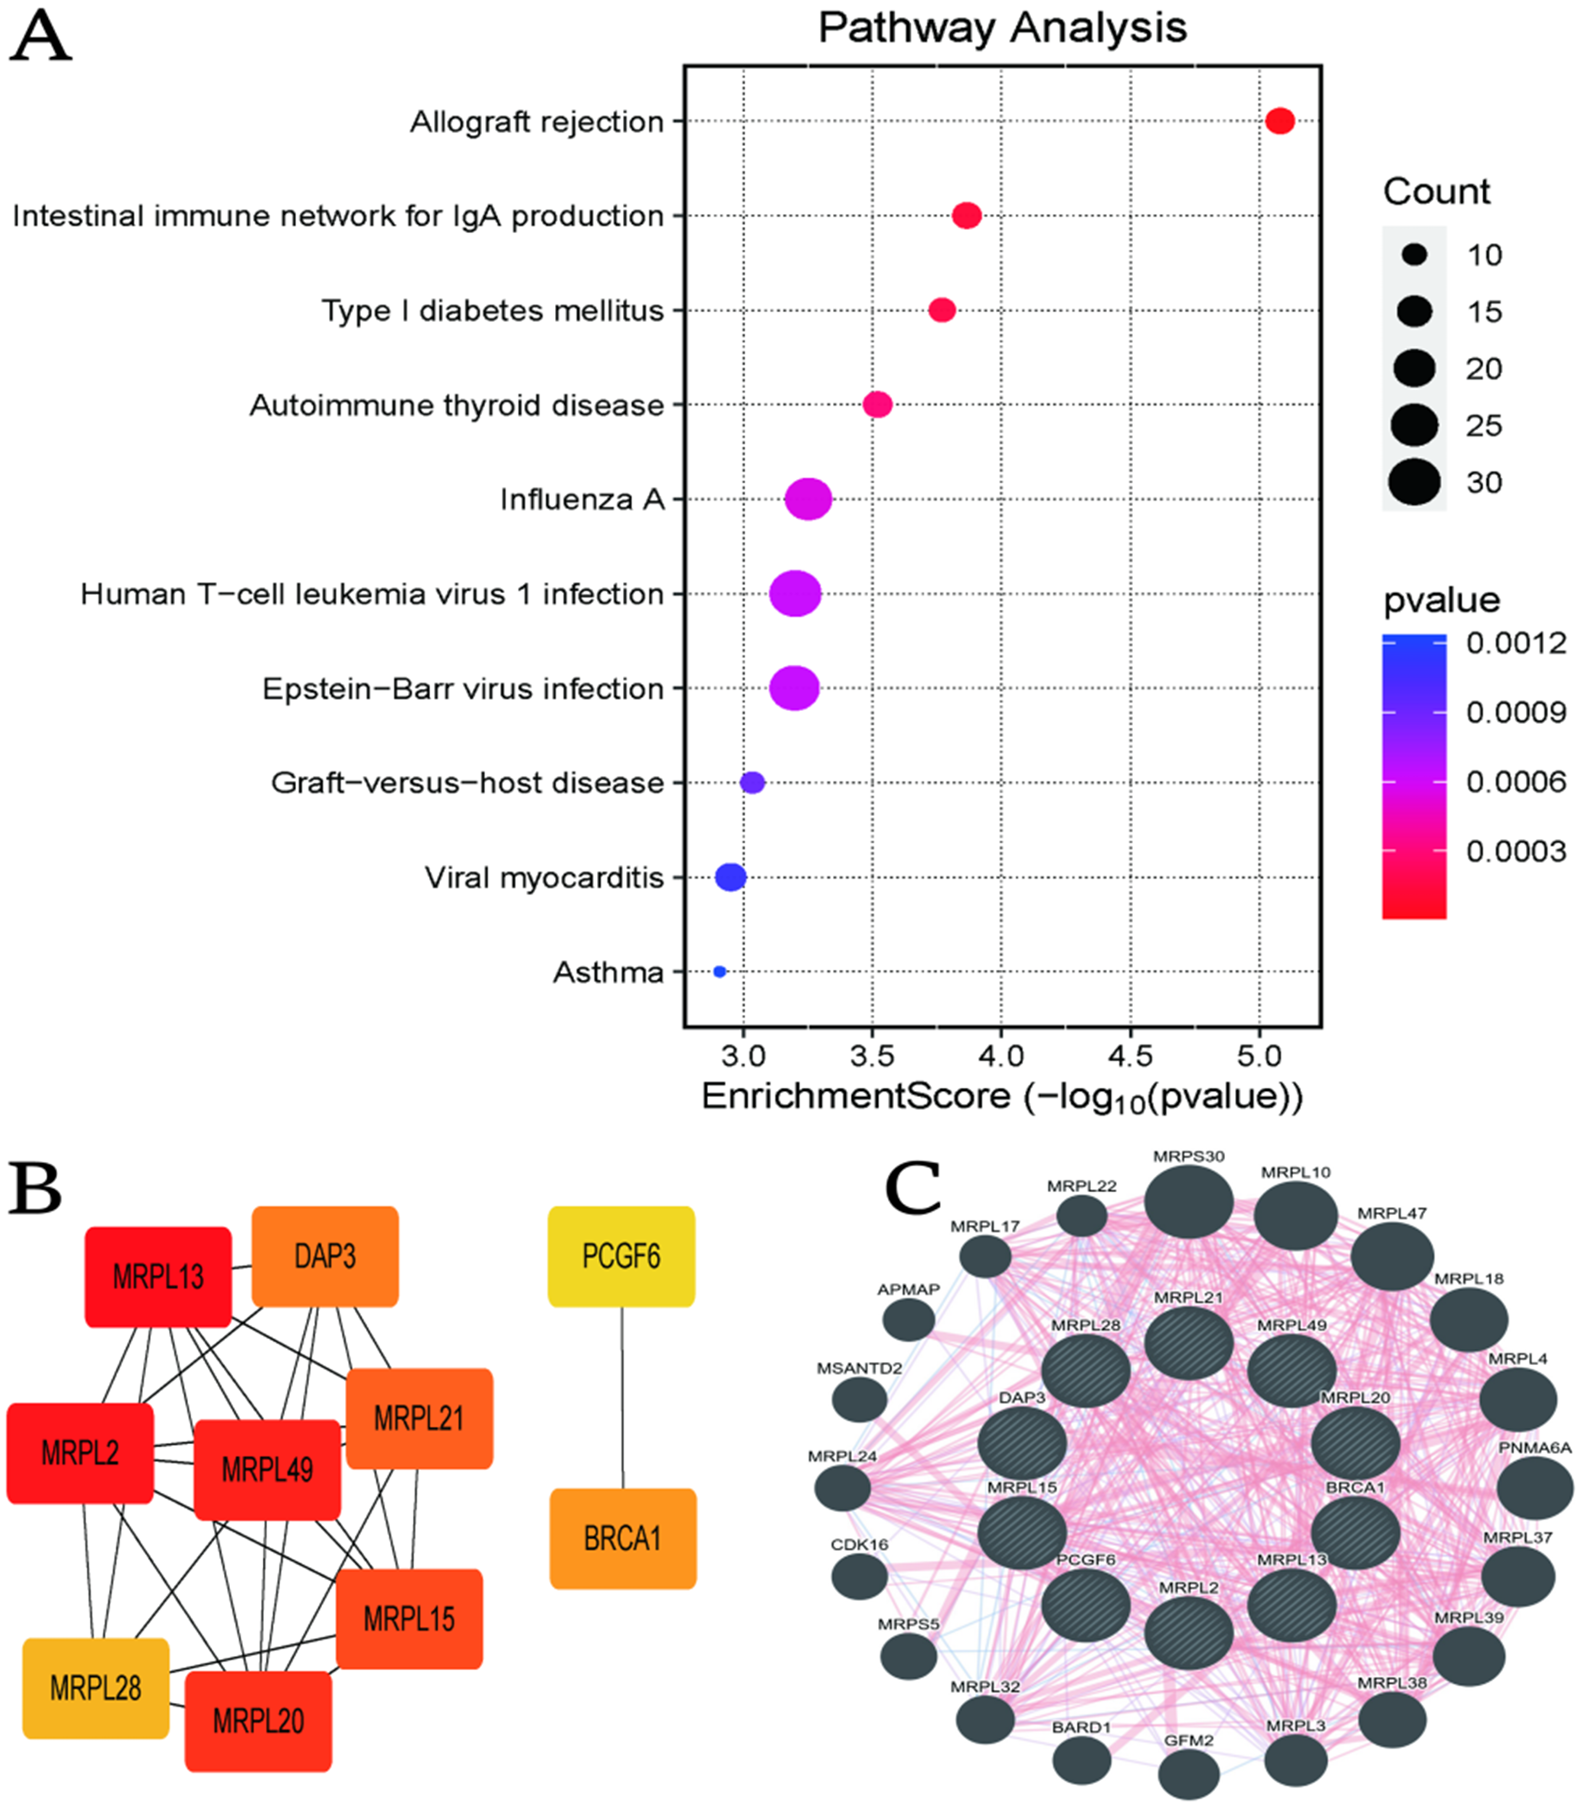
Figure 4A presents a dot plot of biological pathway enrichment. Each dot represents a pathway, with enrichment score on the x-axis, dot size indicating the number of genes and color reflecting significance (red = highest). Pathways related to allograft rejection and autoimmune diseases were among the most significantly enriched. Figure 4B depicts a gene interaction network in which node color represents connectivity (red indicating high connectivity). MRPL13 and MRPL49 emerge as central nodes. Figure 4C offers a circular network emphasizing mitochondrial ribosomal proteins (MRPLs), showing complex and stable network interactions.
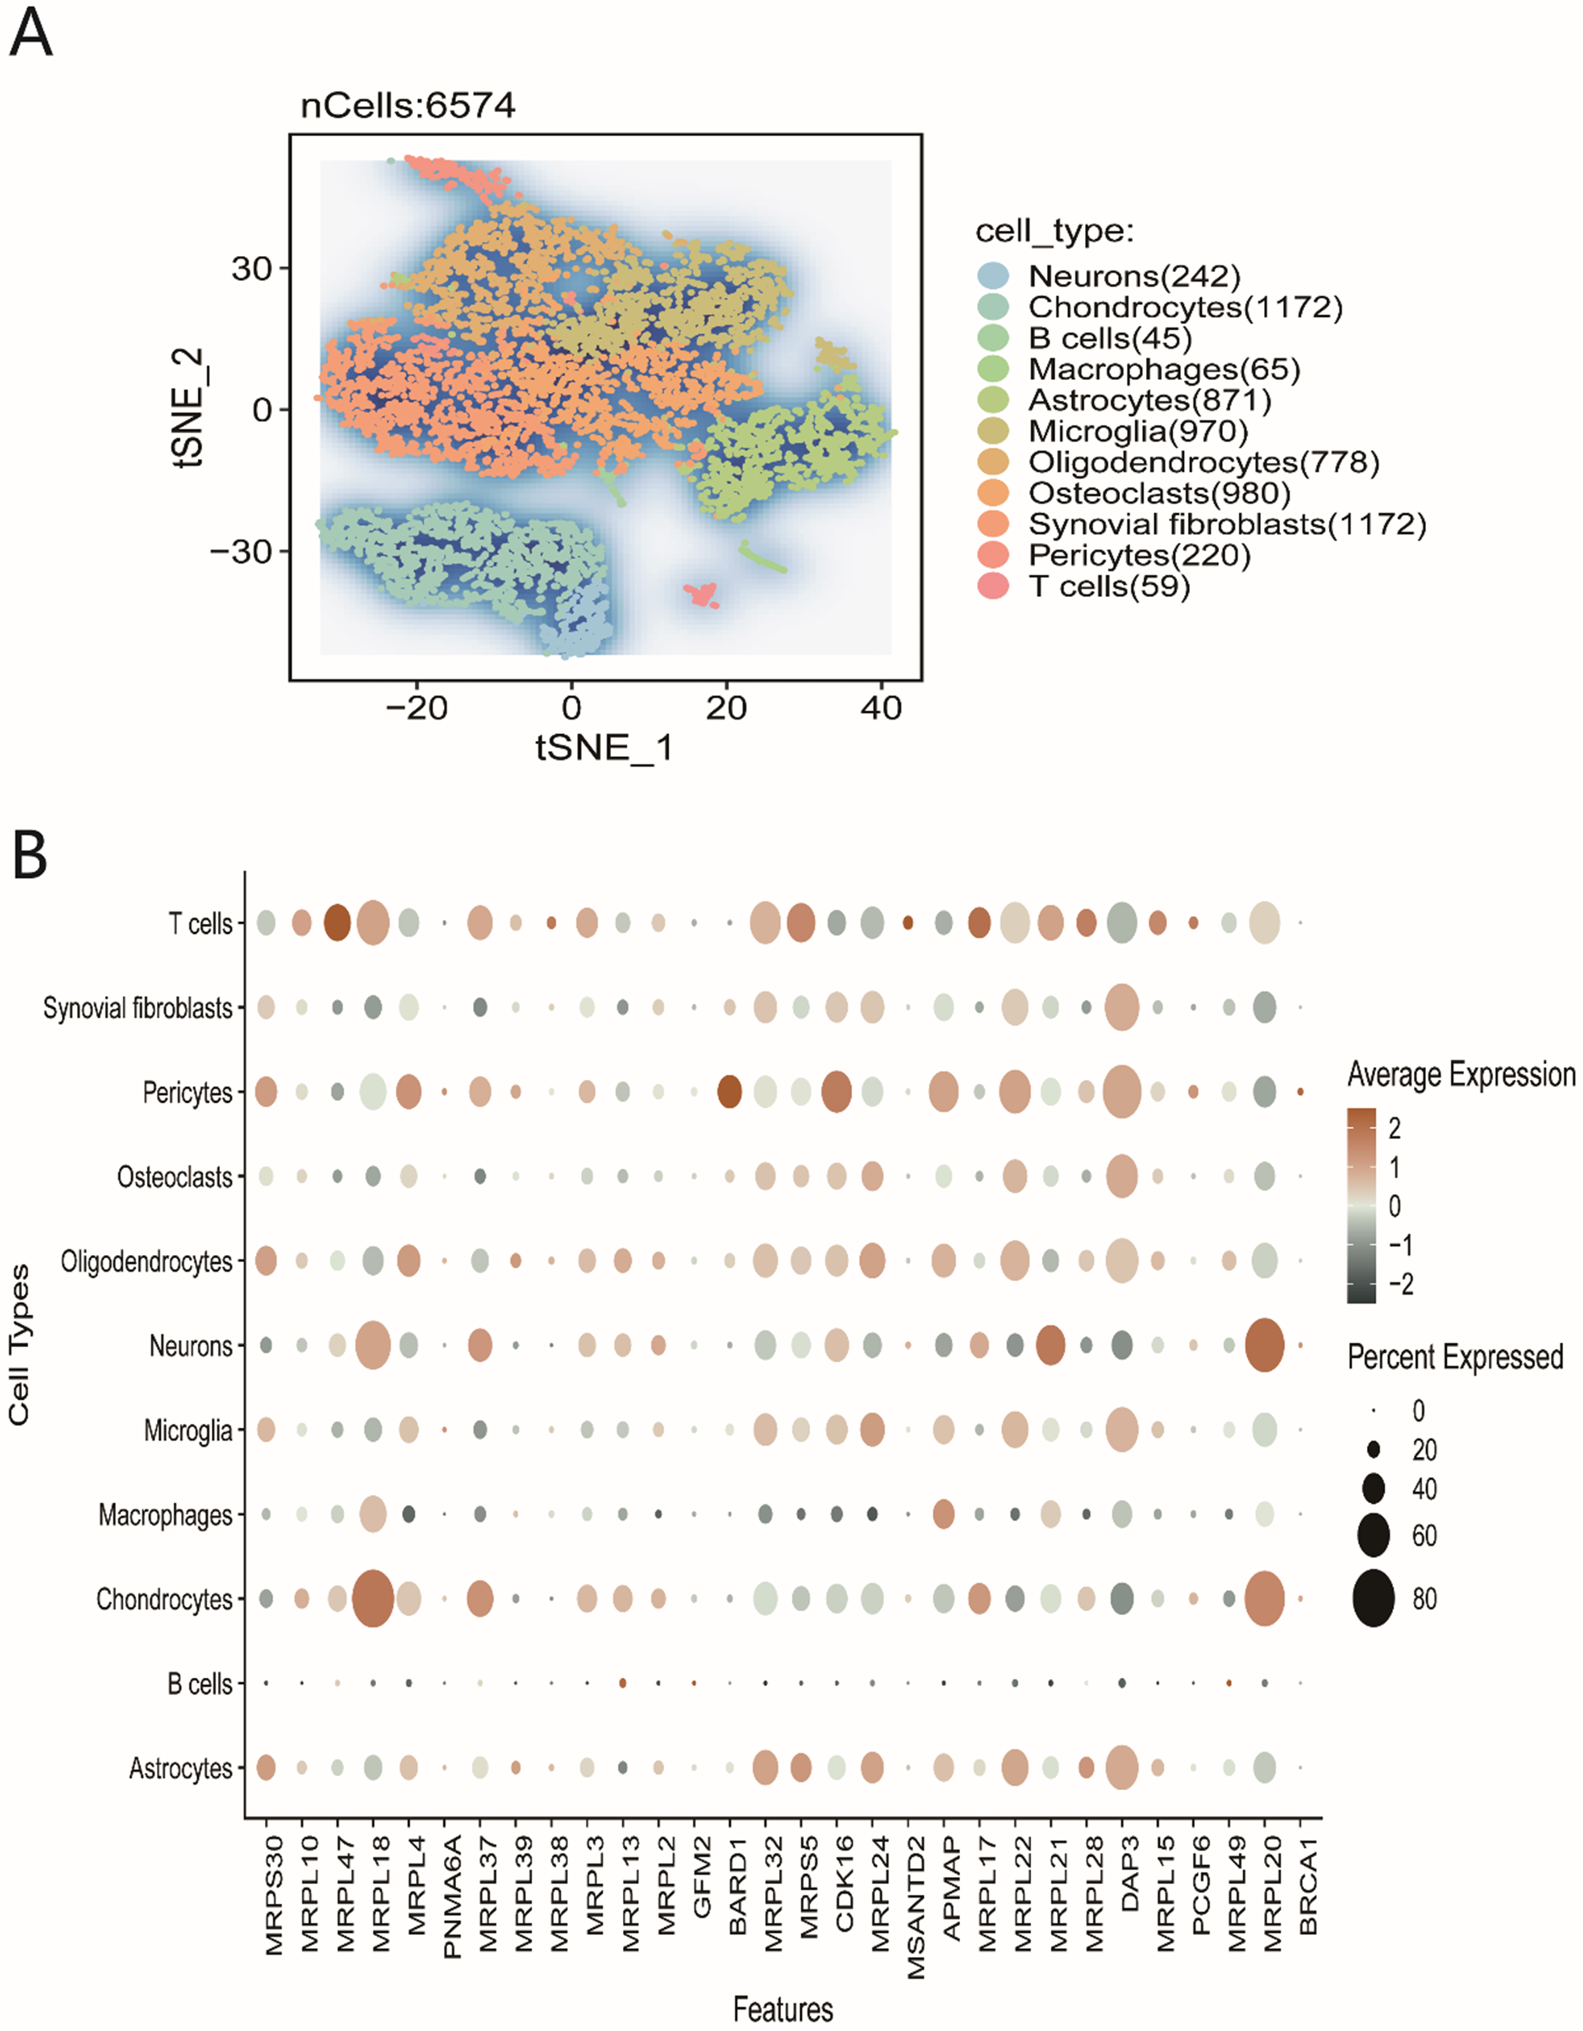
Cell type distribution and gene expression
The t-SNE plot in Figure 5A visualizes clustering of cell types based on gene expression. Each point represents an individual cell, and the colors distinguish different cell types (e.g., neurons, chondrocytes, B cells), revealing distinct expression profiles. The dot plot in Figure 5B details the expression of specific genes by cell type. Dot size indicates the percentage of cells expressing a given gene, while color reflects the mean expression level. Notably, MRPL gene expression is elevated in neurons and microglia, suggesting a functionally important role in these cell types.
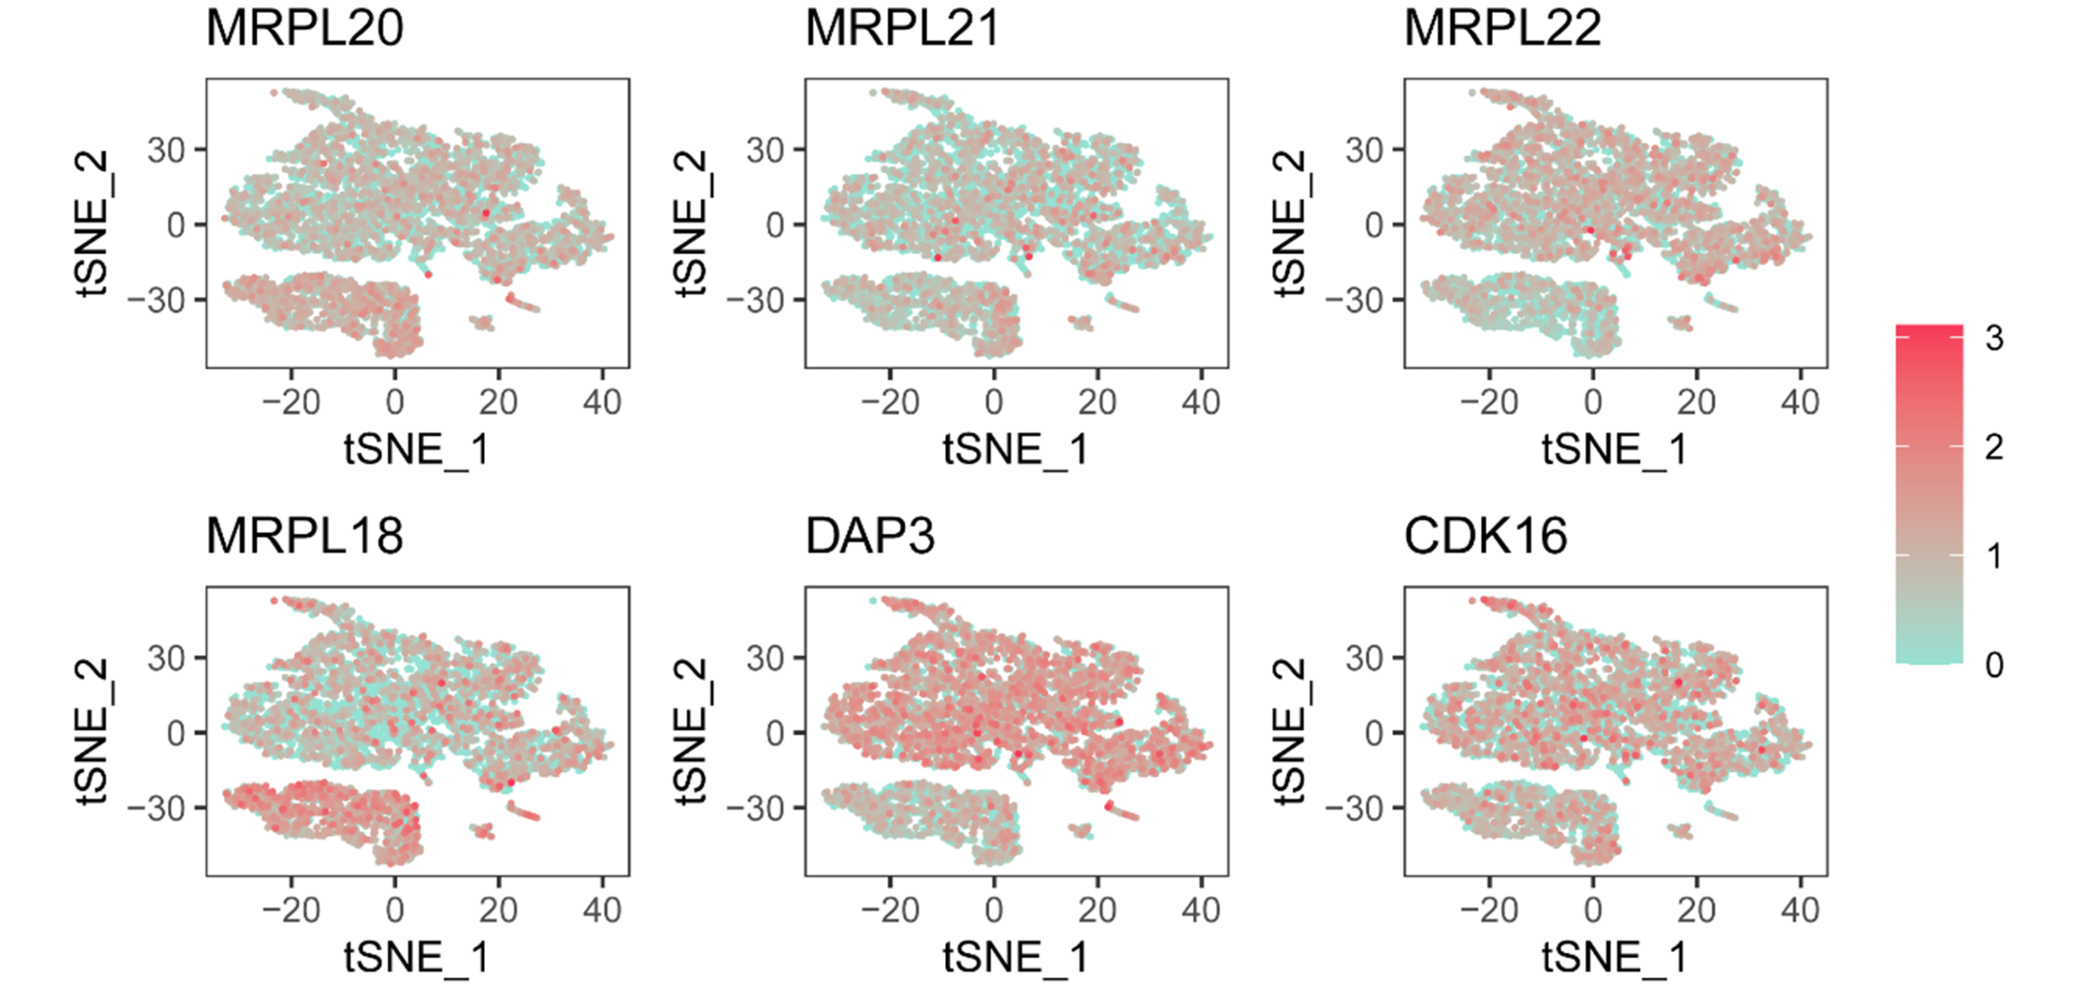
Gene expression patterns across cell populations
Figure 6 (Gene Expression Maps) shows t-SNE plots of individual genes (MRPL20, MRPL21, MRPL22, MRPL18, DAP3, CDK16). The red gradient denotes expression level, with darker red indicating higher expression. Expression patterns differ across clusters, suggesting gene-specific roles in distinct cell populations.
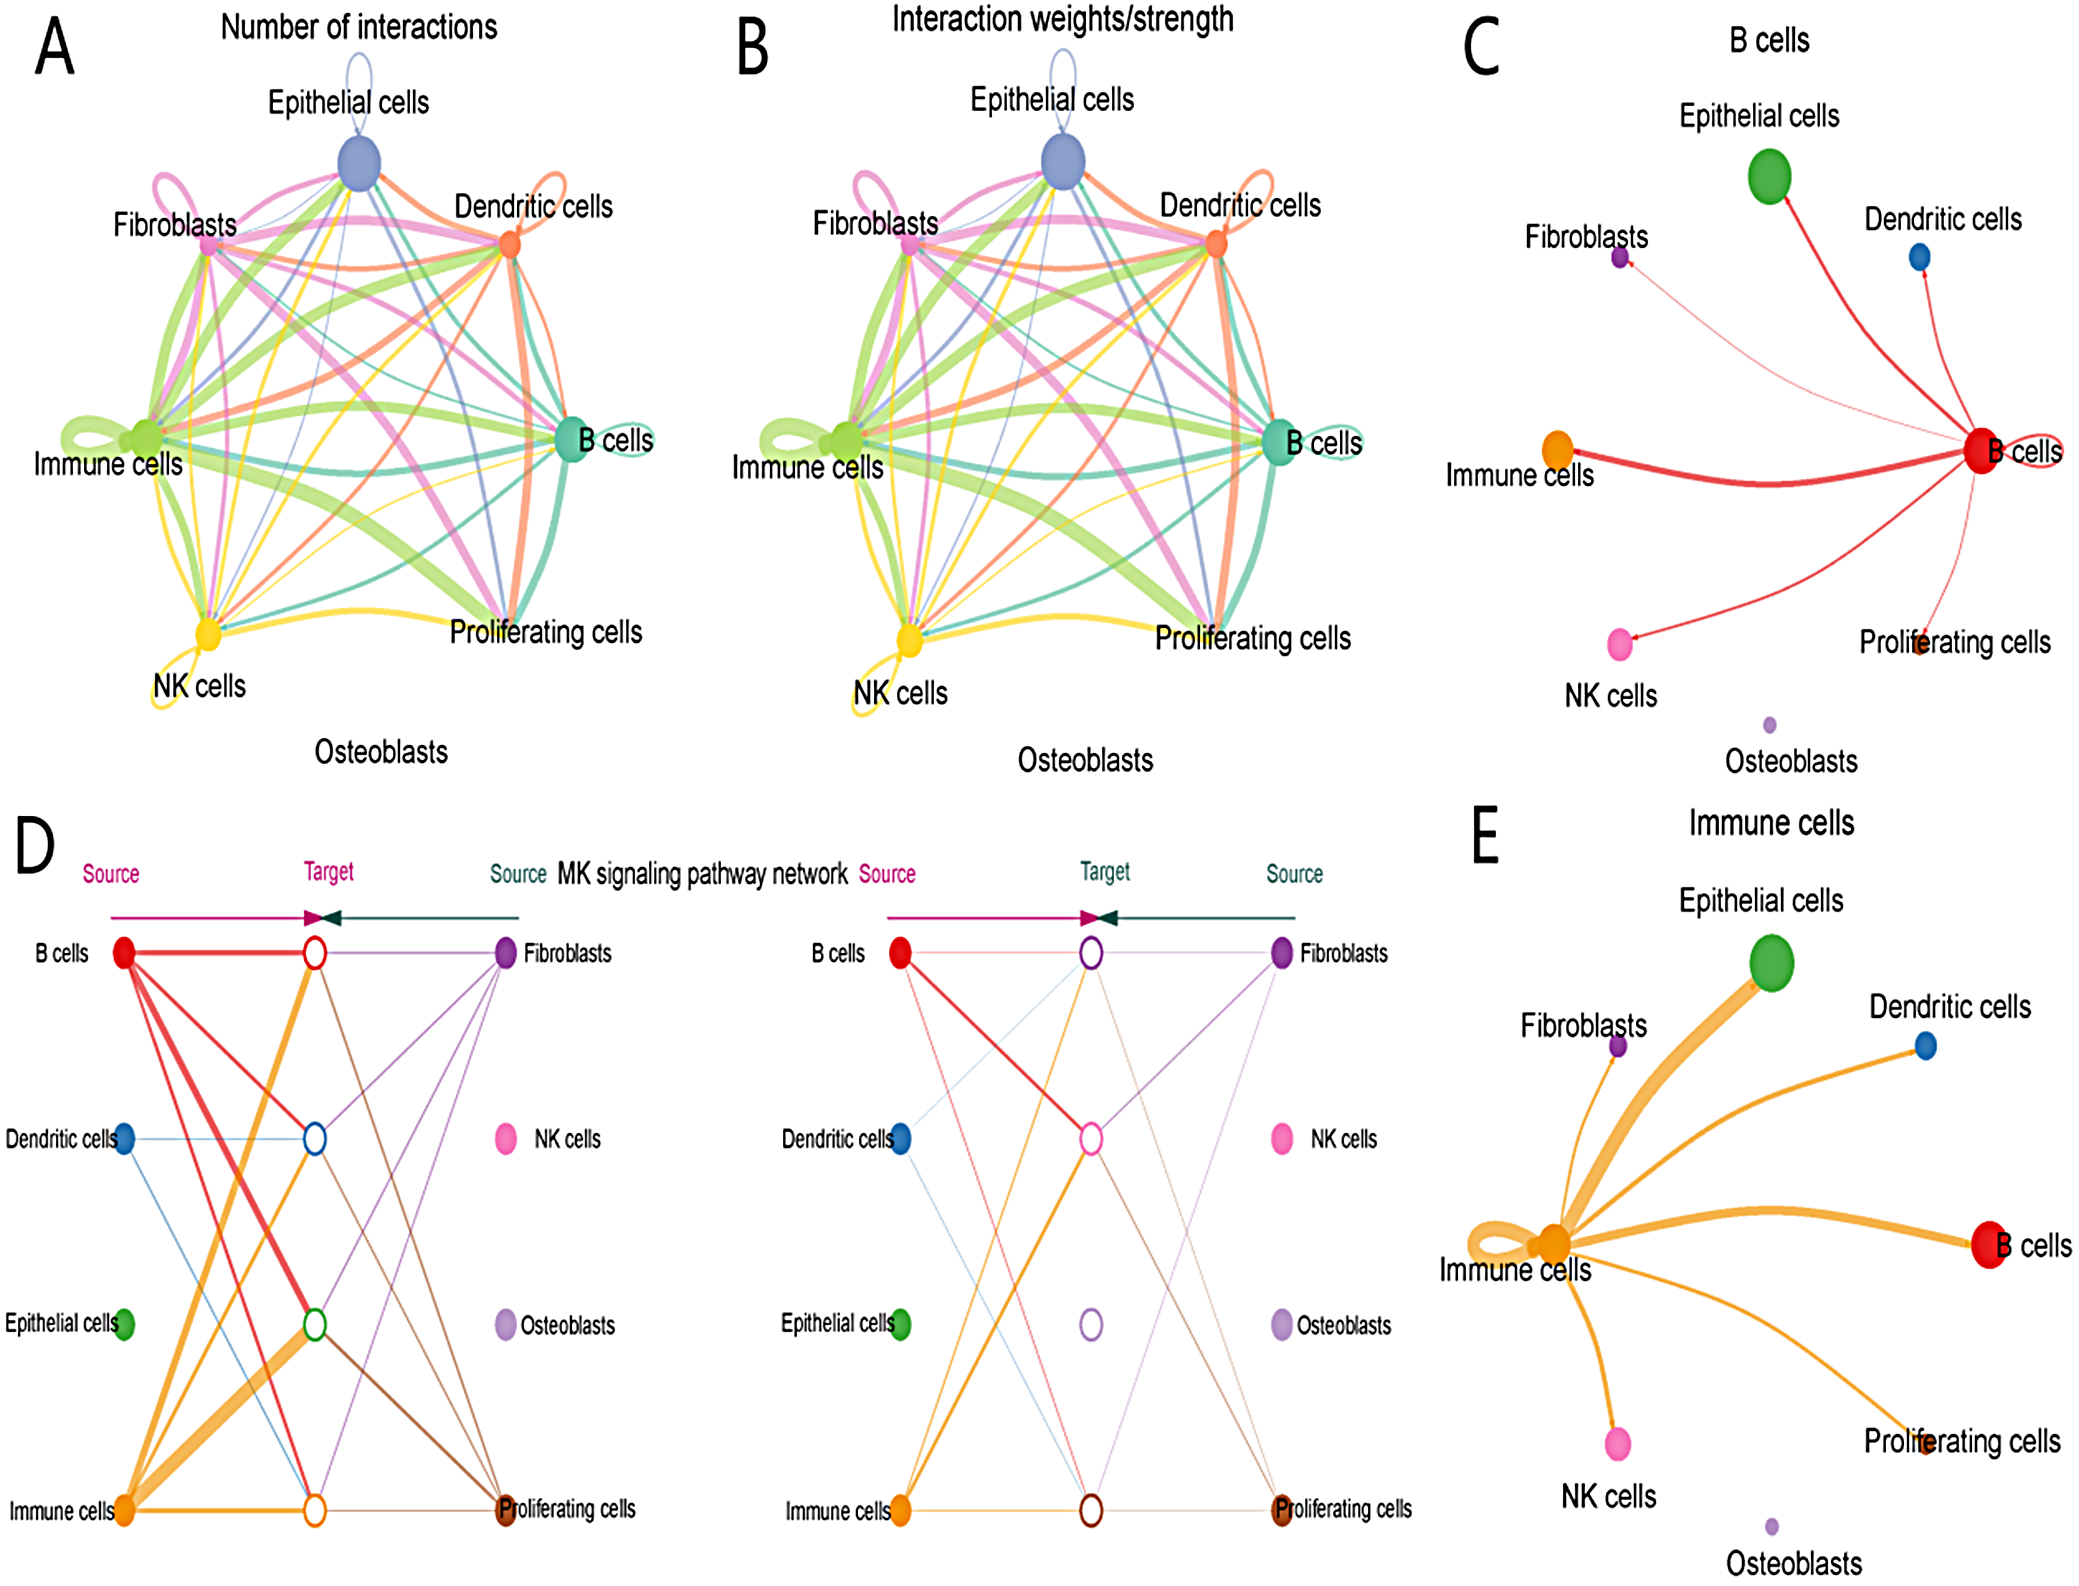
Cell–cell communication and interaction strength
The diagram in Figure 7A quantifies interactions between cell types, with line thickness reflecting interaction frequency. Prominent interactions occur between immune cells, B cells and dendritic cells. Figure 7B displays the strength of these interactions, with thicker lines indicating higher intensity, particularly between epithelial and immune cells. The network in Figure 7C illustrates centrality, with B cells showing strong connectivity. Figure 7D highlights NK cell signaling pathways, with panels showing NK cells as both targets and sources. Figure 7E centers on immune cells, emphasizing their key position in cellular communication, especially with fibroblasts and epithelial cells.
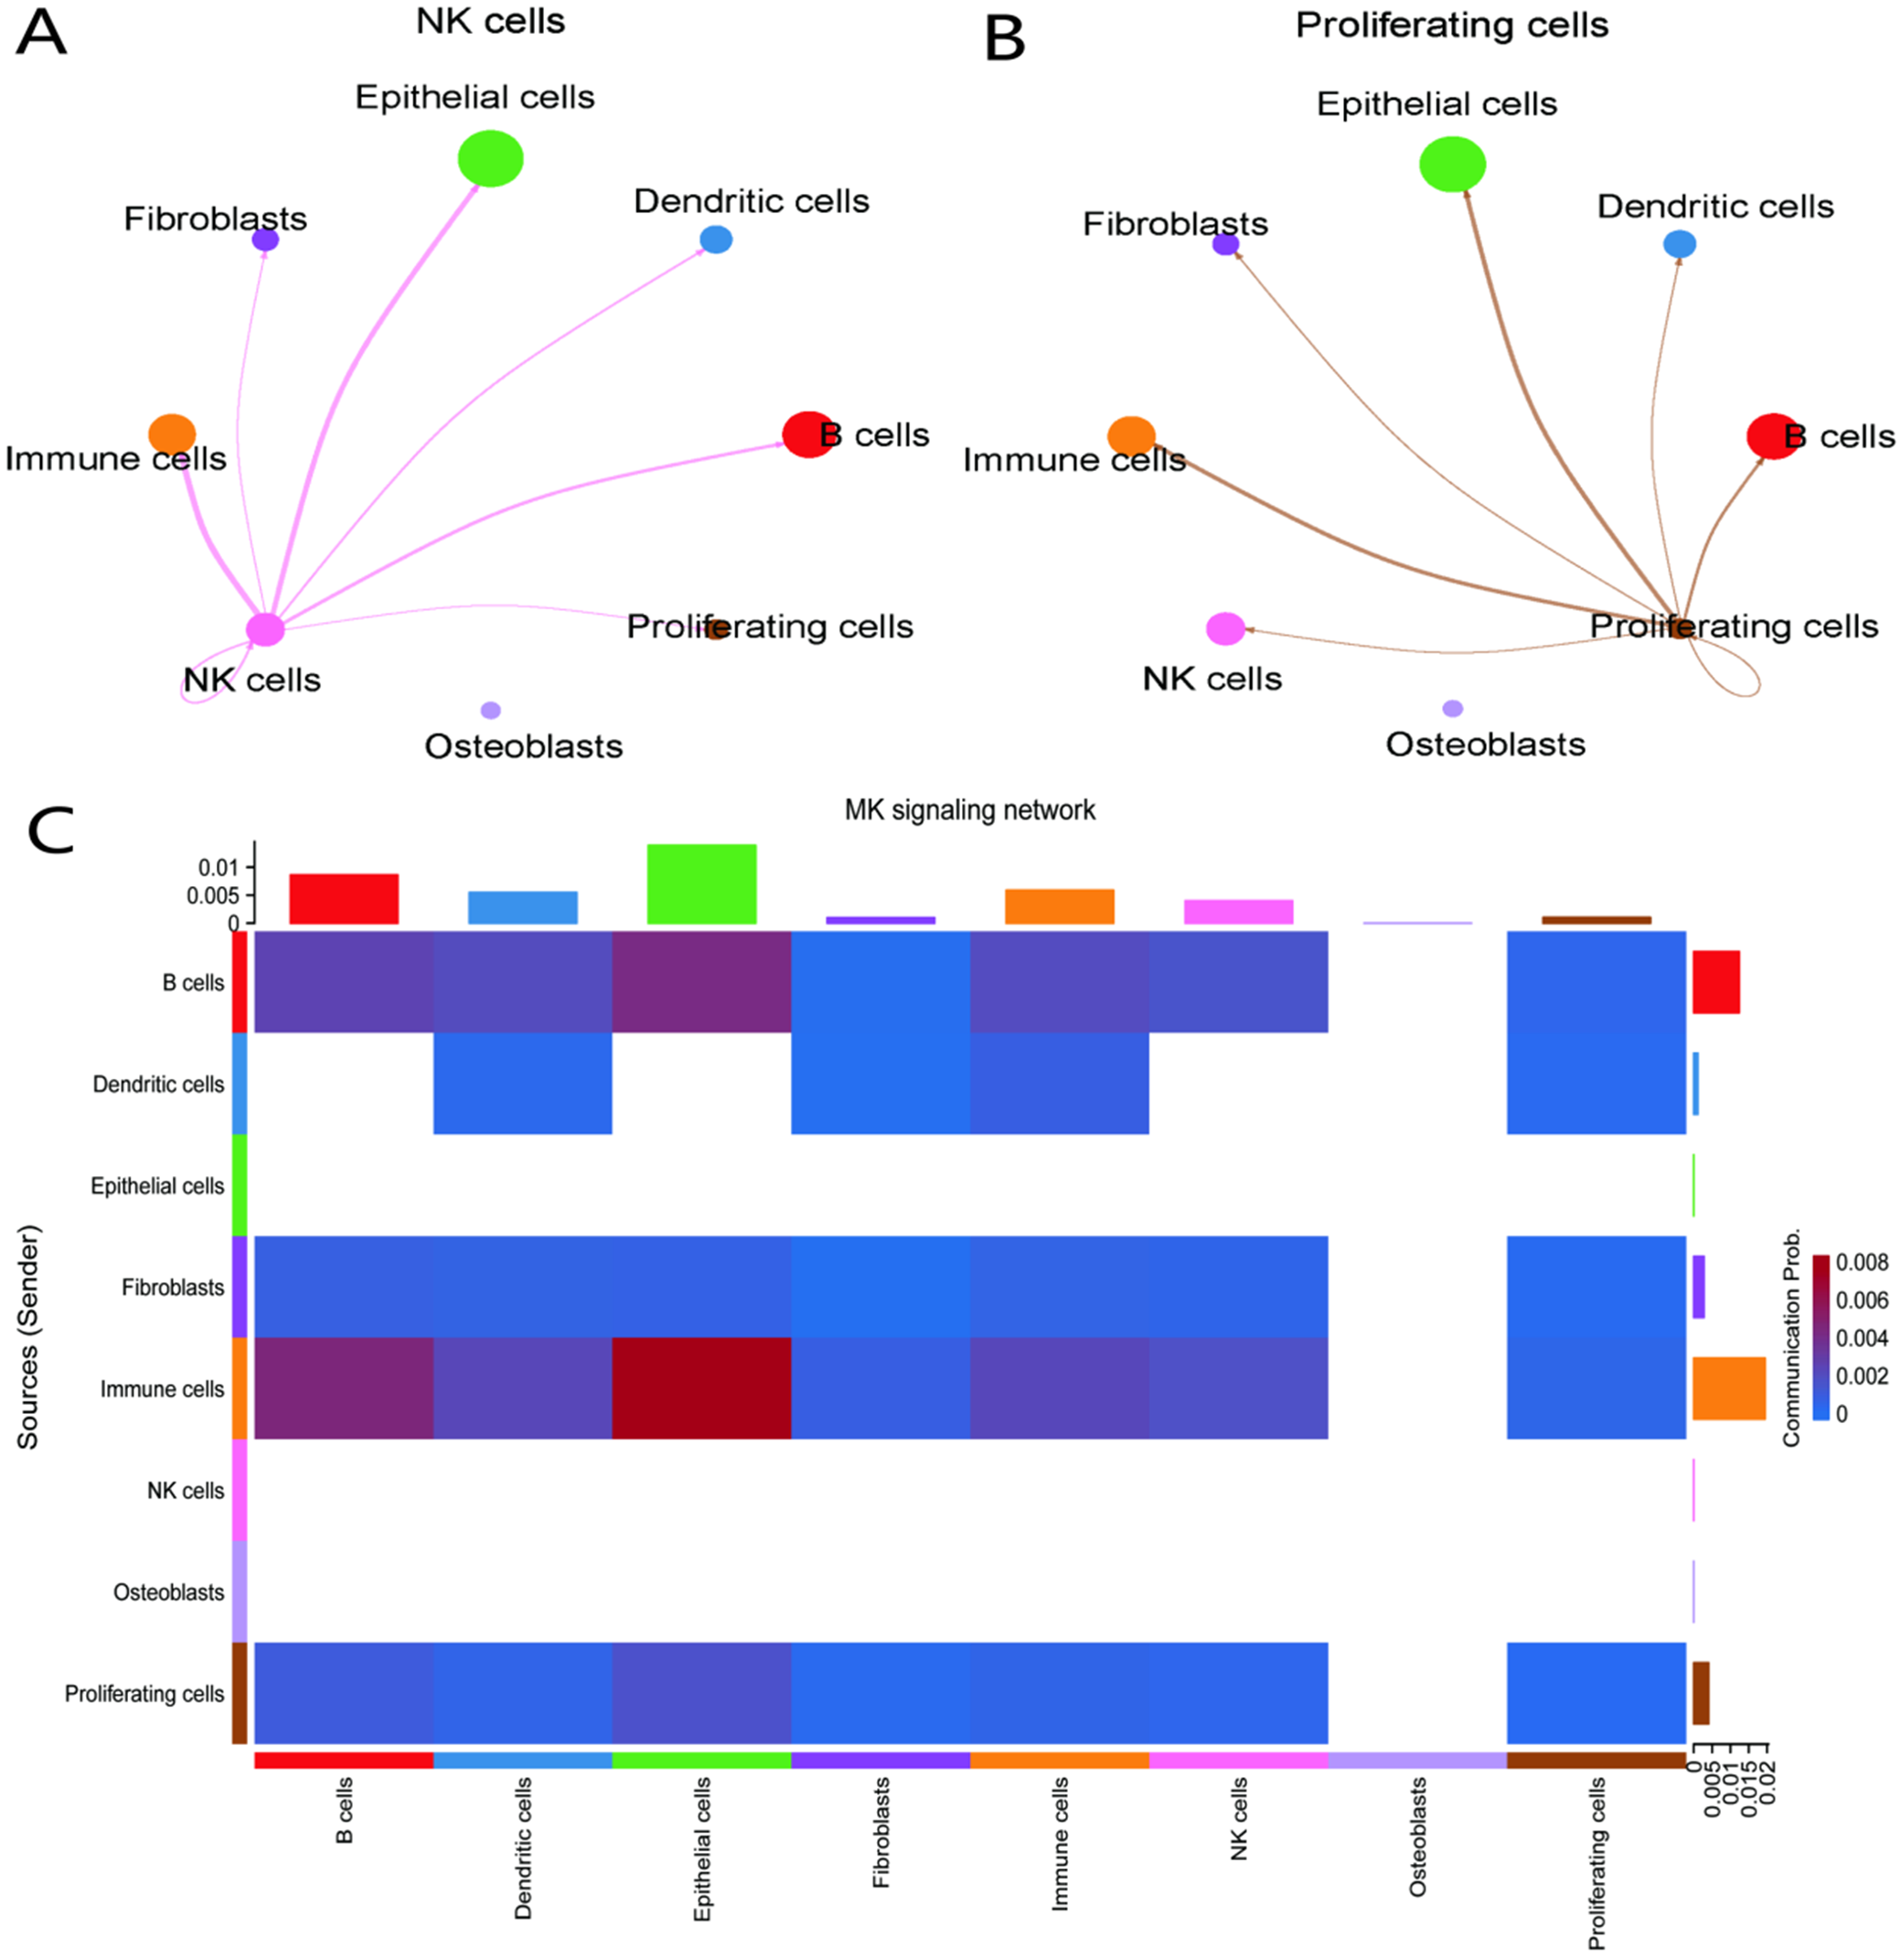
Cell interaction dynamics and signaling networks
Figure 8A presents a network centered on NK cells, with line thickness indicating the strength of intercellular communication. The primary interactions occur with immune, epithelial and dendritic cells. Figure 8B focuses on proliferating cells and their connections, notably with B cells, immune cells and fibroblasts. Figure 8C is a heatmap of signaling strength; rows and columns represent cell types, and color intensity indicates interaction strength, with immune cells displaying robust signaling to multiple cell types.
Molecular docking: DAP3 with curcumin and baicalin
Figure 9A shows 2D interactions between curcumin and DAP3, identifying hydrogen bonds and hydrophobic contacts that stabilize binding. Figure 9B presents a 3D surface model, with curcumin (green) located in the DAP3 active site. Figure 9C offers a close-up of the binding pocket, detailing curcumin’s orientation and key interactions. Figure 9D shows 2D interactions for baicalin, which also forms hydrogen bonds and hydrophobic contacts. Figure 9E displays baicalin in the DAP3 binding site (green), and Figure 9F provides a detailed view of baicalin’s binding interactions within the pocket.
Discussion
We conducted scRNA-seq analysis to characterize cellular heterogeneity in CHS and OA, followed by molecular docking studies to elucidate potential molecular mechanisms underlying both diseases. Our analysis revealed differences in cell subgroup distributions and gene expression between these 2 conditions, suggesting divergent pathological mechanisms.
Briefly, scRNA-seq first revealed variations in cell subgroup distributions between OA and CHS. Macrophages and chondrocytes in OA exhibited distinct transcriptomes, highlighting the effect of persistent inflammation on disease progression. Immune activation and elevated expression of inflammatory factors in immune cells are critical initiators of OA pathology.18, 19, 20, 21 This inflammatory response contributes to cartilage destruction and also impairs the health and function of adjacent tissues. In addition, reduced cartilage repair in OA is associated with altered chondrocytes, which display active anti-proliferative signaling pathways that inhibit cell proliferation and differentiation.
In contrast, CHS displayed a complex interplay among TME cell types, notably collagenous (Col1) and proteoglycanase (Prg4) populations, which may influence its invasive characteristics. Tumor cells may secrete factors that attenuate immune cell function, thereby evading immune surveillance. Moreover, fibroblast- and endothelial-derived cells may promote tumor progression, partly by facilitating tumor invasion and supporting angiogenesis. In rheumatoid arthritis (RA), immune cell activation and inflammatory factor expression are central to the pathology. Subpopulations such as THY1 (CD90)+ HLA-DRA^hi fibroblasts, IL1B+ pro-inflammatory monocytes, autoimmune-related B cells, and PDCD1+ helper T cells are expanded in RA, which differs from the transcriptomic profiles of macrophages and chondrocytes observed in OA.
Molecular docking studies demonstrated the binding of curcumin and resveratrol to the DAP3 protein. Key signaling pathways, including NF-κB and MAPK, play major roles in inflammation and apoptosis regulation. Curcumin may inhibit pro-inflammatory cytokine production and induce apoptosis in diseased cells through modulation of these pathways, including DAP3. Resveratrol may activate SIRT1 and AMPK pathways via its interaction with DAP3, contributing to cellular stress response and longevity. This activation could promote autophagy and mitochondrial biogenesis, supporting cellular protection and repair. Curcumin and resveratrol may therefore offer therapeutic advantages by targeting these pathways in OA and CHS. However, experimental validation is necessary to establish these interactions and assess their clinical relevance.22, 23, 24 Curcumin demonstrates anti-inflammatory activity with a favorable safety profile compared with nonsteroidal anti-inflammatory drugs (NSAIDs), presenting an additional mechanism for reducing inflammation in OA through DAP3 interaction. Comparative analysis with other agents provides insight into the unique therapeutic mechanisms of curcumin and resveratrol, highlighting their potential in treating OA and CHS. Further clinical studies are needed to evaluate these effects. These findings suggest a therapeutic scope for curcumin and resveratrol in modulating molecular pathways related to DAP3 in OA and CHS, warranting further research for clinical application.
Although OA and CHS are pathologically different, they may share molecular pathways, such as those related to chronic inflammation. For example, chronic inflammation is a hallmark of OA and may, to some extent, promote tumorigenesis – a hypothesis that merits further investigation. Chronic inflammation, which is present in various diseases including OA, may support tumor development by causing genetic damage or fostering tumor cell proliferation. The scRNA-seq has revealed the heterogeneity of chondrocytes in OA, including homeostatic chondrocytes, proliferative fibrochondrocytes and hypertrophic chondrocytes. These findings enhance our understanding of OA pathogenesis and may facilitate the development of new therapeutic strategies, including targeted interventions for specific chondrocyte subpopulations. Researchers have identified proliferative fibrochondrocytes unique to OA, which may drive disease progression through inflammatory mechanisms and represent potential therapeutic targets.
Limitations of the study
This study may be limited by the sample size, which could affect the generalizability of the findings. The results rely primarily on in silico and in vitro analyses, highlighting the need for additional in vivo validation. The complexity of the TME may require more comprehensive investigations to fully characterize cellular interactions. Although molecular docking identified potential therapeutic targets, it does not capture the full complexity of in vivo processes.
Conclusions
This study elucidates the cellular heterogeneity and shared molecular mechanisms underlying OA and CHS through scRNA-seq. We identified specific immune and chondrocyte subpopulations that drive disease progression, highlighting the critical role of the DAP3 gene. Furthermore, molecular docking analysis provided in silico evidence that curcumin and resveratrol possess strong binding affinity for the DAP3 protein. These findings establish a structural and molecular basis for the potential use of these natural compounds as therapeutic agents, offering a verified pathway for targeting joint-disabling diseases.
Data Availability Statement
The datasets supporting the findings of this study are openly available in Figshare at https://figshare.com/s/9c4f8
bd2a1f848f14778.
Consent for publication
Not applicable.
Use of AI and AI-assisted technologies
Not applicable.