Abstract
Background. Phonemic awareness is defined as the ability to break down a word into smaller units called phonemes or described as the ability to synthesize words from segments of one’s own speech. Impaired phonemic hearing, depending on the degree of severity, hinders or prevents speech reception, disrupts the proper development of a child’s pronunciation, may cause disorders in already developed speech, and complicates the acquisition of writing skills or disturbs the skill that has already been acquired.
Objectives. To create an objectified tool for phonemic hearing diagnostics to ensure that verbal material is always presented at the same intensity, from the same distance, and in the same direction. Another aim was to compare children with and without auditory processing disorder (APD) if they have disrupted phonemic hearing.
Materials and methods. A study involving 20 individuals was conducted using a sound level meter to determine the level of the auditory stimulus (therapist’s voice) provided to patients during the diagnosis. Each participant in the study was tasked with repeating, in the most natural way for them, 2 pairs of words containing opposing sounds.
Results. The analysis revealed significant discrepancies both in the articulation of verbal material by different examiners and in the presentation of the same material by a single examiner using different methods. When the same phonemic opposition was presented in an identical manner by different diagnosticians, amplitude differences of up to 10.8 dB were observed, with a standard deviation (SD) of 2.5 dB. These findings underscored the need to develop an objectified tool for phonemic hearing diagnostics to ensure consistency and reliability in assessment.
Conclusions. In the research group encompassing children with APD, disorders within phonemic hearing occur more frequently and have a deeper nature. Phonemic hearing disorders in children are associated with significant difficulties in learning and daily functioning.
Key words: children, APD, phonemic awareness, auditory processing disorder
Background
The term “phonemic hearing” first emerged in Soviet research in the mid-20th century, particularly within the fields of neuropsychology and neurolinguistics.1 Effective interpretation of acoustic signals requires not only intact auditory function but also the precise ability to differentiate between phonemes. Phonemic hearing is essential for speech development, literacy acquisition, and reading proficiency. It is commonly defined as the ability to segment words into their smallest sound units called phonemes2 or to synthesize words from discrete speech sounds.3 Impairments in phonemic hearing, depending on their severity, can hinder or even prevent effective speech perception. Such deficits may disrupt the development of correct pronunciation, contribute to speech disorders in children, and impede the acquisition of writing skills or interfere with skills that have already been established.
It is important to recognize that the primary function of language is communication.4 This entails the exchange of information between individuals to promote mutual understanding. The communicative function of language enables us to convey specific content, emotions, and feelings through spoken or written words, thereby facilitating effective interpersonal interaction.
Phonemic awareness
Communication disorders may arise from an inability to differentiate the basic units of language, i.e., phonemes. In such cases, individuals struggle to distinguish between sounds that represent different phonemes within a given language. These difficulties are classified as phonemic hearing disorders and can be identified through assessments of phonemic awareness.5
Early research in this field was conducted in the 1950s by Wepman, who developed a test that involved distinguishing between pairs of words that differ by only 1 phoneme, such as: clothe/clove [ʒlotχe] [ʣ̑lɔtxɛ]/[ʒlove] [ʣ̑lɔvɛ], dim/din [dʹĩm] [dʲĩm]/[dʹĩn] [dʲĩn], leg/led [lek] [lɛk]/[let] [lɛt].6
A disorder in phonemic awareness is a significant impairment that can interfere with effective interaction with the environment. It also disrupts auditory perception, leading to misunderstandings of instructions and difficulties in following them. Additionally, it can hinder foreign language learning, as sounds that should be perceived as distinct may seem identical to the affected individual – e.g., mouse/house [mouse/mɔusɛ] and [χouse/xɔusɛ].
Phonemic hearing should be assessed in the individual’s native language. Research has demonstrated that people interpret phonemes more accurately in their native tongue than in foreign languages. Therefore, conducting assessments in the native language is essential to avoid inaccurate results or misinterpretation.
Phonemic awareness disorders can lead to difficulties in everyday functioning and learning, potentially affecting an individual’s self-esteem and social confidence.7 Early identification and intervention are crucial to support effective communication and promote healthy cognitive and emotional development.
Phonemic awareness diagnostics
Contemporary tools for assessing phonemic awareness typically involve auditory tasks, such as identifying phonemic differences using rhyming word pairs. To reduce the risk of misinterpretation related to articulatory difficulties, these assessments are often supplemented with visual aids.
In English, common diagnostic tools include the Phonemic Synthesis Picture Pointing Test,8 the Auditory Skills Assessment,9 and PAT-2.10 In Polish, resources such as Phonemic and Phonematic Hearing – Theory and Practice by Bronisław Rocławski (2016)11 and Examination and Shaping of Phonematic Hearing by Irena Styczek (1982)12 are frequently used.
However, many diagnostic tools and platforms developed over the past decade fail to utilize the full potential of modern computer and audiometric technologies commonly applied in hearing diagnostics. More critically, these tools often lack standardization and objectivity. Test outcomes can be influenced by numerous variables, including the examiner’s voice volume, physical presence, and whether their mouth is obscured (e.g., by hands, papers, or books to prevent lip-reading). Additional factors such as the patient’s orientation (facing or side-facing the examiner), the distance between examiner and patient, and environmental conditions (e.g., reverberation, background noise) further contribute to variability. This lack of control makes it difficult to achieve reproducible and reliable assessments of phonemic hearing.13
An anonymous survey conducted among 15 experienced speech therapists, each with a minimum of three years of professional practice, highlighted the lack of consistency in current phonemic hearing assessment practices. The survey revealed considerable variation in key testing conditions. For instance, the distance between the examiner and the patient ranged from 25 to 100 cm, with a mean distance of 61.7 cm and a standard deviation (SD) of 17.8 cm.
Additionally, the patient’s position relative to the examiner varied. In 73.3% of cases, patients sat facing the examiner with measures taken to prevent lip-reading, while in 26.7% of cases, they were seated beside the examiner. Among those seated face-to-face, 72.7% of examiners used a sheet of paper to cover the patient’s mouth, 18.2% used their hand, and 9.1% used a book.
These discrepancies were further corroborated by sound level meter measurements and survey responses, both of which highlight a significant lack of consistency and standardization in phonemic hearing diagnostics.
Objectives
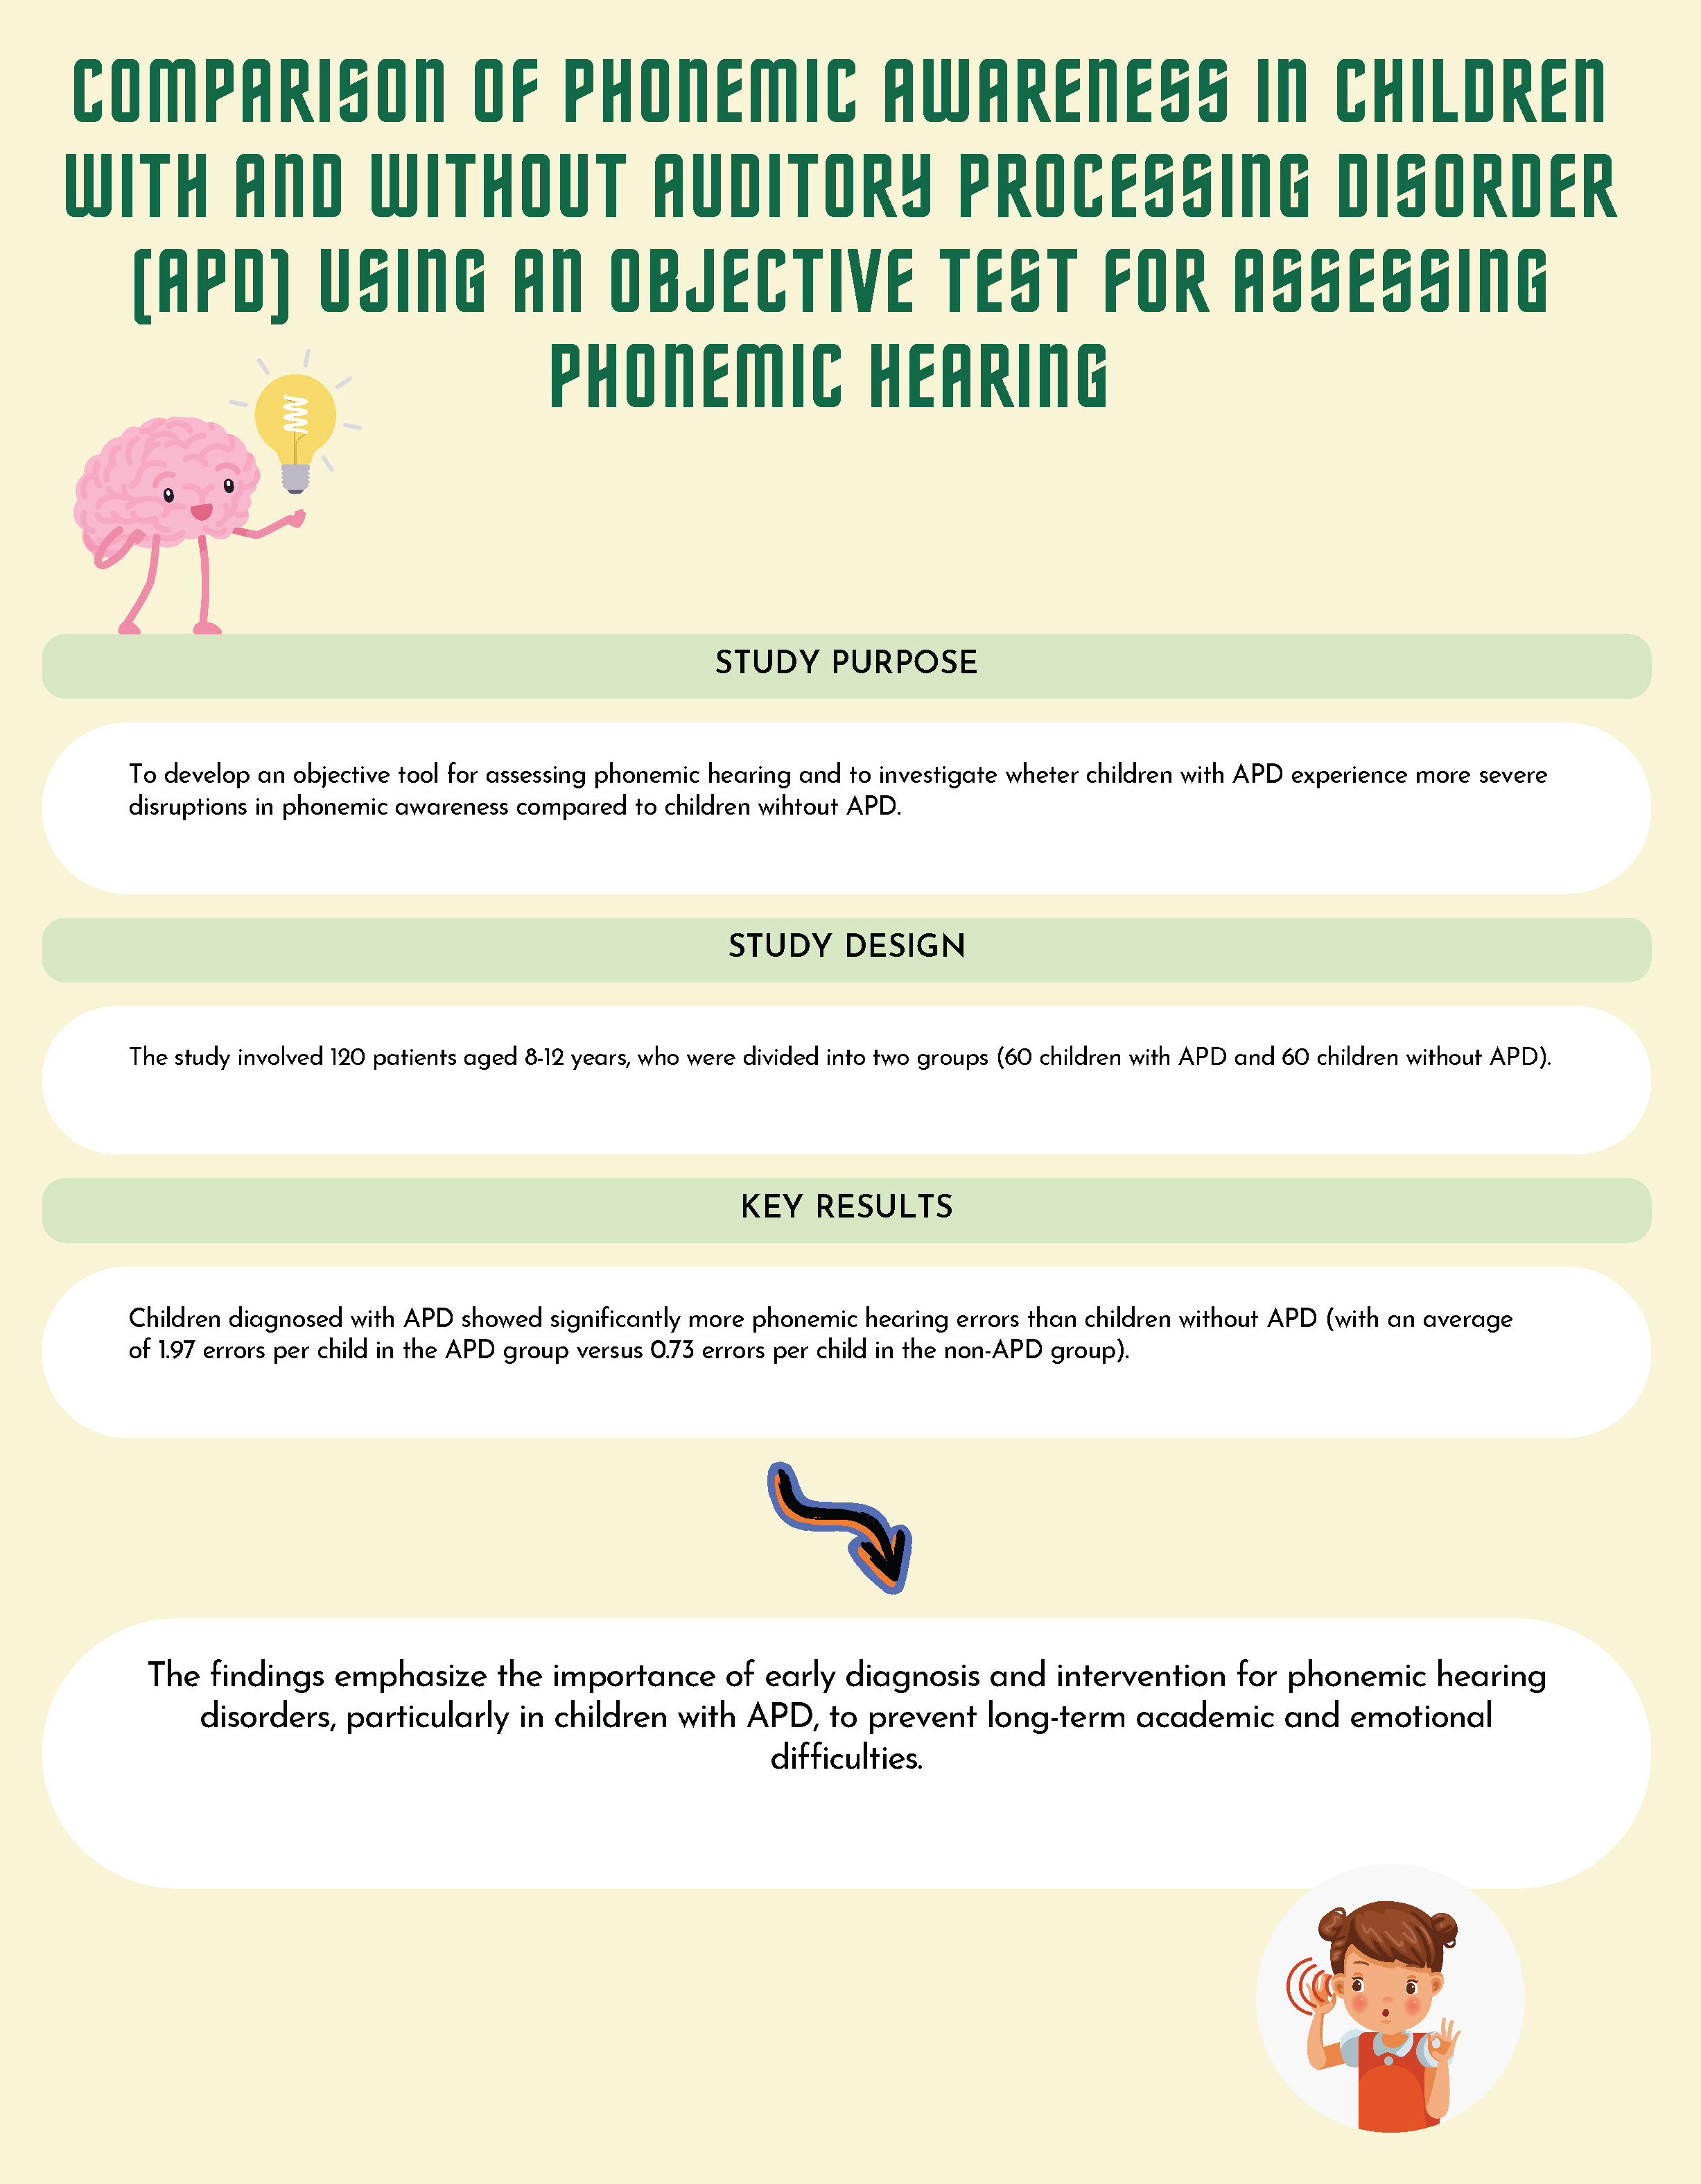
The main goal of this study was to develop an objective tool for diagnosing phonemic hearing. The tool was designed to ensure consistent presentation of verbal stimuli in terms of intensity, distance, and direction. A secondary objective of the study was to compare phonemic hearing abilities between children with and without APD to determine whether significant differences exist between the two groups.
Materials and methods
Study design and sample
To examine how professionals conduct phonemic awareness assessments, a study with 20 participants was carried out. A sound level meter measured the loudness of the therapist’s voice during the diagnosis. Each participant was asked to naturally repeat 2 pairs of words that contain opposing sounds: “Tomek – domek” (t:d) and “dróżka – gruszka” (d:g). Based on these measurements, we calculated the amplitude differences for each therapist, referred to as Diff TD and Diff DG. The study was conducted in a medium-sized room measuring approx.16 m2, resembling a typical speech therapy office. The participant was seated facing the sound level meter at a standard desk distance, replicating real-world assessment conditions. They were instructed to repeat the presented word pairs (“Tomek,” “domek,” “dróżka,” “gruszka”) with the opposing sounds in 5 different ways: With an uncovered mouth, covered by a sheet of paper, covered by a book, covered by a hand, and sitting sideways to the meter. These positions reflect common methods used by speech therapists during natural phonemic hearing tests.
Statistical analyses
All analyses were performed using the Automated Statistical Description System (System Zautomatyzowanego Tworzenia Opisu Statystycznego (SZTOS)). To assess the normality of the data, 2 Shapiro–Wilk tests were conducted. The results showed that the Diff DG measurements significantly deviated from a normal distribution (SW = 0.90; p = 0.034), while the Diff TD measurements were closer to normal (SW = 0.91; p = 0.078).
Since the Diff DG data did not follow a normal distribution, the nonparametric Wilcoxon signed-rank test was applied. In contrast, the Diff TD data met the assumptions of normality, allowing for the use of a one-sample Student’s t-test. To compare amplitude measurement values across different methods of presenting verbal stimuli, a series of t-tests were conducted against reference values increasing in 0.5 dB increments.
Results
Preliminary results are presented in Table 1. Values highlighted in green represent the minimum, while those in red indicate the maximum, within the significance analysis of discrepancies. These discrepancies pertain to two key aspects: The variation observed when the same diagnostician presented phonemic oppositions using different methods, and the variation when the same phonemic opposition was presented by different diagnosticians.
The analysis revealed significant variability both in the articulation of verbal material by different examiners and in the presentation methods used by the same examiner. When the same phonemic opposition was presented in an identical manner by different diagnosticians, amplitude differences of up to 10.8 dB were observed (SD = 2.5 dB). In comparison, when the same diagnostician presented the opposition using different articulation methods, differences reached up to 8.4 dB (SD = 3.4 dB).
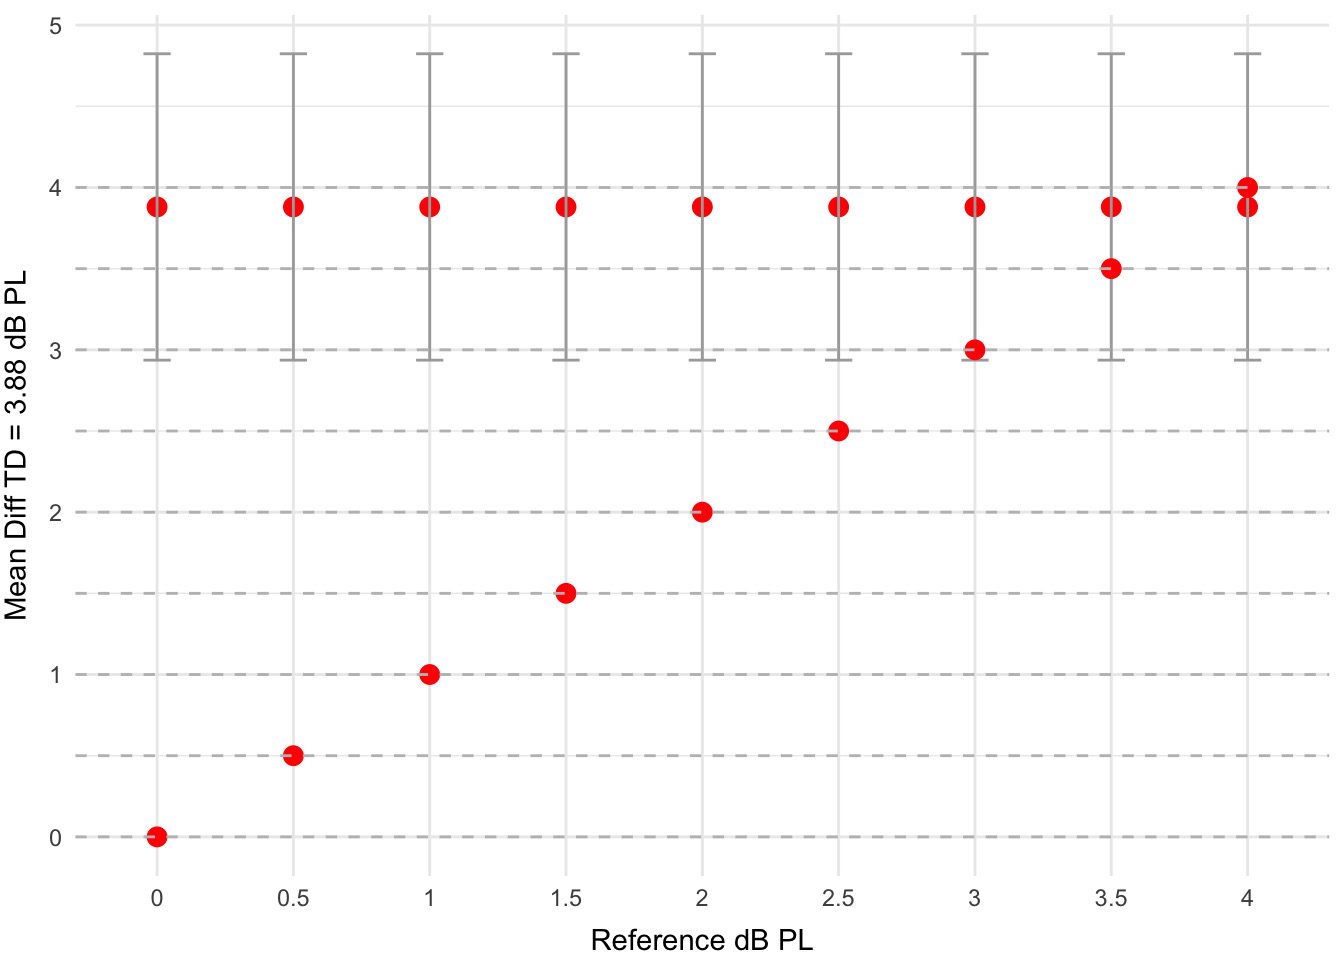
An analysis of amplitude intensities for the phonemic opposition t : d, which had an average of 3.88 dB PL in the tested group, showed a significant difference from the reference value range of 0 to 2.5 dB PL. For a reference value of 3 dB PL, the difference was at the borderline of statistical significance (p = 0.083). These results are shown in Table 2 and Figure 1.
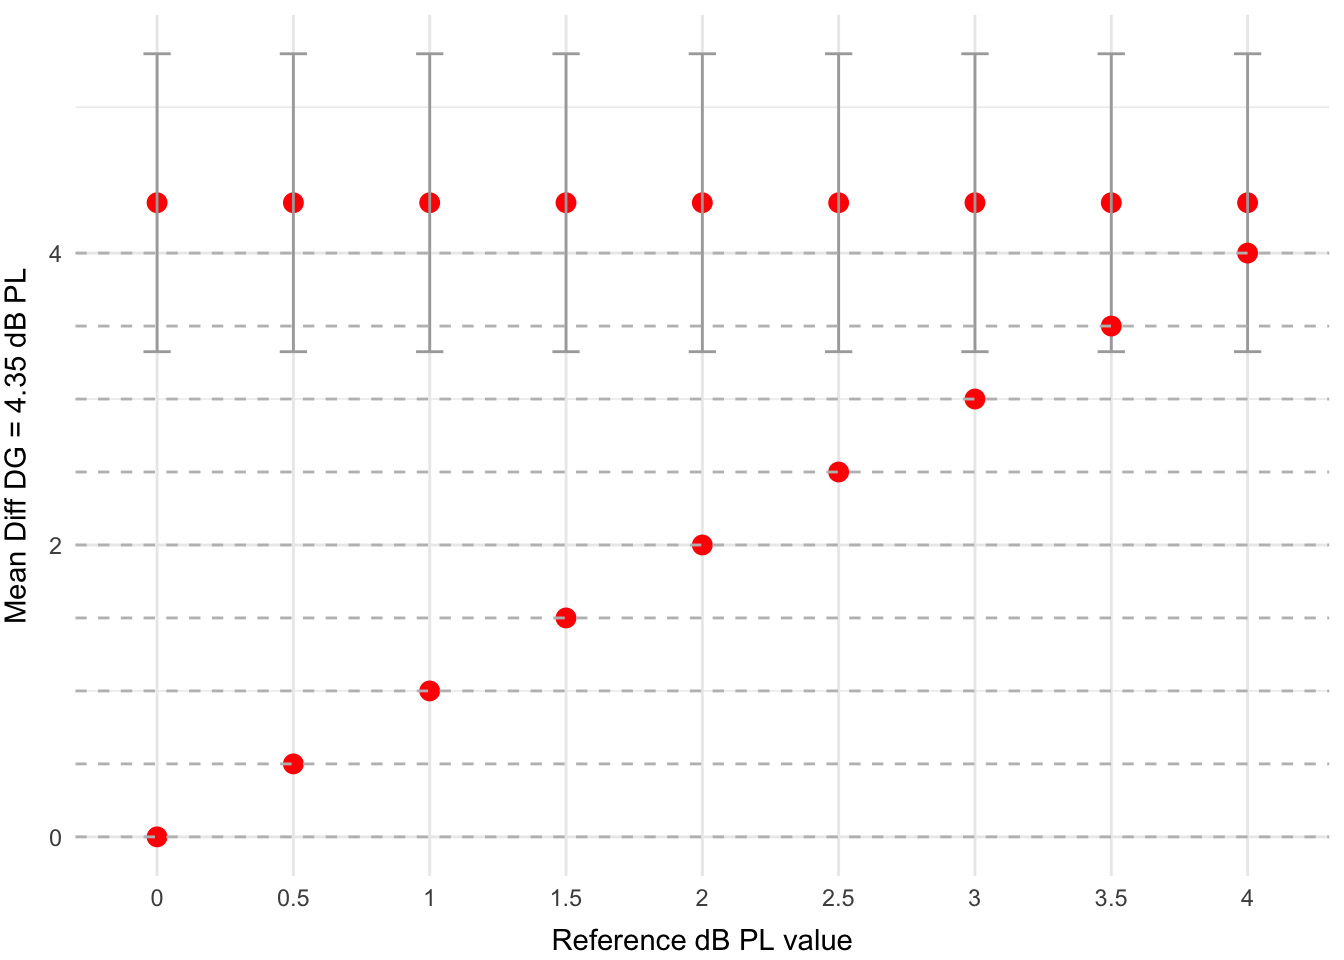
Similarly, for the phonemic opposition d:g, which had a mean amplitude of 4.34 dB PL, a significant difference was observed within the range of 0 to 2.5 dB PL (p = 0.010). These results are summarized in Table 3 and illustrated in Figure 2. The observed variability exceeds the commonly accepted threshold for test-retest reliability in speech recognition tasks, which is 2 dB for typically functioning listeners.14
Discussion
The various discrepancies identified above, which adversely impact the consistency of test results, support the conclusion that an objective tool for phonemic hearing diagnostics is essential. Such a tool would ensure that verbal stimuli are consistently presented at the same intensity, distance, and direction. This level of standardization would enhance the repeatability and comparability of assessments – both across different patients and within repeated assessments of the same patient. Key factors influencing the reliability of these tests include procedural consistency, adherence to standardized protocols and diagnostic methods, and the use of uniform, calibrated equipment during testing.15
Audiological module for objective diagnosis of phonemic awareness
Considering the need for an objective diagnostic tool, an audiometric module was developed for assessing phonemic awareness. This tool is useful for specialists diagnosing auditory processing disorders and related issues. The audiometer is equipped with a program containing 42 phonemic oppositions common in Polish. For each pair of rhyming words, 2 additional non-rhyming, differently sounding words are included to verify the patient’s understanding and attention (Table 4).
The use of the Interacoustics AD 528 audiometer (Interacoustics A/S, Middelfart, Denmark), into which the diagnostic module is integrated, enables reliable phonemic hearing assessments. These assessments typically include evaluation of both air and bone conduction hearing. It is important to remember that phonemic awareness is fundamental to proper hearing function.
The dedicated audiometric module makes phonemic diagnosis objective and repeatable. The same narrator always delivers speech in the same manner, and the patient is positioned at the same distance from the speakers. The module also includes a photo-based book featuring modern graphics and vibrant colors. Photographs, rather than drawings, were intentionally used to make the assessment more appropriate for older patients and to avoid an infantilizing impression.
A dedicated diagnostic card accompanies the module, providing a clear and structured presentation of the phonemic assessment results. This facilitates subsequent diagnostic and therapeutic decision-making, including the need for further testing for APD or dyslexia, referrals for speech therapy, or the formulation of appropriate educational recommendations.
During the examination, the patient sits at a designated spot calibrated by the device, facing a centrally located speaker. In an open-field setting, phonemic hearing tests are conducted according to the following steps:
1. The examiner names objects depicted in photographs, and the patient is asked to point to the corresponding image (concept learning phase).
2. The examiner then asks targeted questions, and the patient selects the appropriate photograph in response.
3. If the patient responds correctly to all items, the examiner proceeds to the next phonemic opposition.
4. If any errors occur, the specific phonemic opposition is retested to confirm or clarify the result.
Repeated errors involving rhyming words may indicate a specific disturbance in the corresponding phonemic function. A higher number of errors across various items may suggest broader difficulties with phonemic awareness. Based on the results of these assessments, clinicians can confirm or rule out phonemic hearing disorders and identify appropriate therapeutic interventions.
Diagnosing phonemic functions is essential in evaluating learning difficulties, persistent articulation issues despite speech therapy and in diagnosing dyslexia.
Utilizing the audiometric module for assessing phonemic awareness in children with APD and children without APD
Given the complexity of APD symptoms and its various aspects, it is crucial to use diagnostic methods that can provide comprehensive insights into a patient’s condition within the limited time of a consultation.16 Having developed an objective tool for assessing phonemic hearing, a key question arises: Do children with APD, who have difficulties with learning, understanding complex commands, and recalling verbally delivered information, also experience more severe disruptions in phonemic hearing compared to children without APD? To explore this, in-depth diagnostics were conducted on 2 groups – children with APD and typically developing children (without higher auditory function disorders) – assuming that phonemic hearing issues might be more pronounced in the 1st group.
Study design and sample
The study involved 120 children aged 8–12 years (since auditory perception continues to develop until around age 7), divided into 2 groups of 60 each. All participants had normal hearing confirmed by audiometric and tympanometric tests, and intellectual disability was ruled out based on IQ assessments. The 1st group included children diagnosed with APD based on tests evaluating higher auditory functions. The 2nd group consisted of children whose testing did not indicate the presence of APD.
All participants underwent a diagnostic assessment of higher auditory functions, including the following test:
Adaptive Speech Understanding in Noise – Word Level: The child wears headphones and listens to speech babble noise in their native language. During this noise, a narrator presents single words, and the child’s task is to repeat them. The noise level increases gradually until the child makes errors, allowing the determination of the signal-to-noise ratio (SNR) threshold.
Adaptive Speech Understanding in Noise – Sentence Level: The child wears headphones and listens to speech babble noise in their native language. During this noise, a narrator presents short sentences, which the child repeats. The noise level gradually increases until errors occur, allowing the determination of the signal-to-noise ratio (SNR) threshold.
The dichotic Digit Test involves the child wearing headphones through which 4 digits are presented, 2 to each ear, almost simultaneously. The child’s task is to repeat as many heard and remembered digits as possible. The results in this test are given separately for the right and left ear.
Auditory Reaction Test: The child wears headphones and listens to single sounds of the same frequency. The child’s task is to react as quickly as possible whenever they hear the stimulus.
Frequency Pattern Test: The child wears headphones and hears a sequence of 3 sounds, each of high or low pitch. The child’s task is to identify and name each sound in the correct order.
Difference Limen of Frequency test: The child wears headphones and hears a constant, irrelevant tone with occasional higher-pitched sounds interspersed. The child’s task is to react when they detect the higher-frequency sound.
Gap Detection in Noise: The child listens to noise through headphones, with occasional silent gaps inserted. The child’s task is to detect and react when they hear a break in the noise.
Next, all 120 children underwent a phonemic function assessment using an audiometric module containing 42 phonemic oppositions. The results are presented in the tables below, with disrupted phonemic oppositions highlighted in red. Table 1 presents the data for children diagnosed with APD, while Table 2 shows the results for children in whom APD was excluded.
Statistical analyses
To assess significant differences between the 2 groups – children diagnosed with APD and children with excluded APD – a Mann–Whitney U test was performed. Despite the variances of the DFF42 measurements being equal across groups (F = 0.08; p = 0.772), the non-parametric test was chosen due to the failure to meet normality assumptions both overall and within the subgroups. The total sample size was n = 120, with 60 children in each group.
The effect size was evaluated using Glass’s biserial correlation measure. Descriptive statistics for the DFF42 measurements are presented in Table 5.
To verify the assumption of normality, the Kolmogorov–Smirnov test with Lilliefors correction was employed (appropriate for n > 50). Results indicated that normality was not met in the overall sample (KS = 0.22; p < 0.001), nor within either subgroup: children with excluded APD (KS = 0.33; p < 0.001) and children with diagnosed APD (KS = 0.25; p < 0.001). These results, along with measures of skewness and descriptive statistics, are summarized in Table 6, Table 7. Between-group comparisons are shown in Table 8. Table 9 displays the phonemic opposition results from the audiometric assessment in children with APD. The average number of incorrectly identified phoneme positions in this group was 1.97 per person (SD = 1.09).
Table 10 presents the results for children without APD, with an average of 0.73 incorrect phoneme identifications (SD = 0.94).
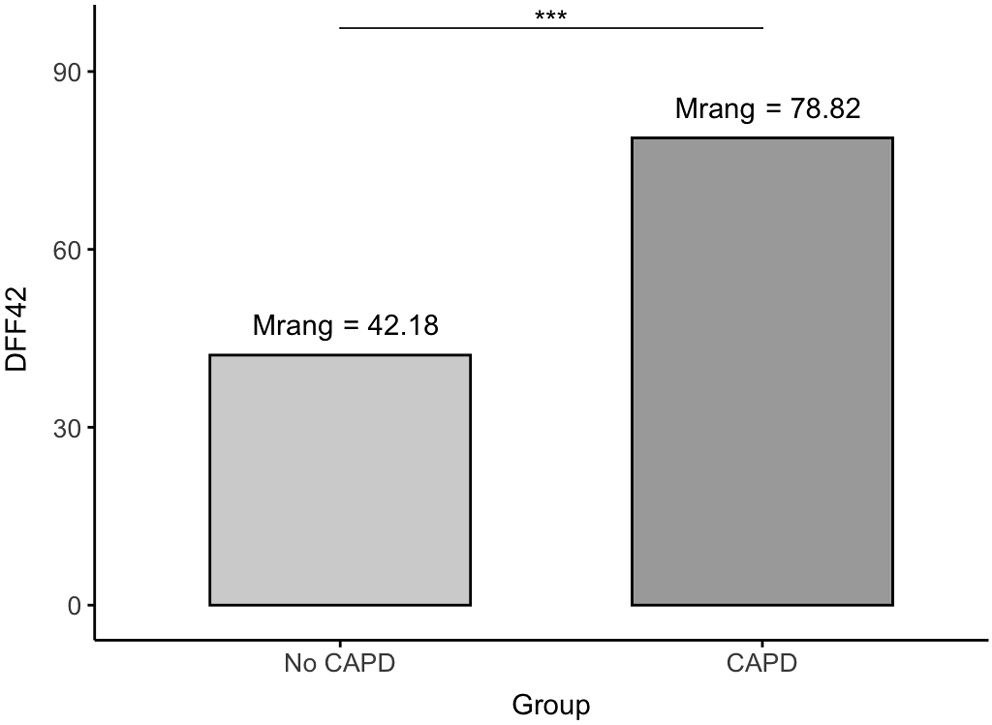
Mann–Whitney U test revealed a significant difference between the groups (U = 701.00; p < 0.001). The APD group scored higher (mean rank = 78.82), indicating more errors, while the non-APD group scored lower (mean rank = 42.18). The effect size was large (r_g = 0.61). The results are visually summarized in Figure 3.
Limitations
Several limitations of this study should be acknowledged. First, the research sample was limited to children aged 8–12 years, which restricts the generalizability of the findings to other age groups. Second, there is a notable lack of comparable studies in this area, making it difficult to contextualize the results within the broader literature. Given these limitations, future research should investigate similar issues in both adolescent and adult populations.
Conclusions
Variability in sound intensity during phonemic hearing tests – observed in a group of 20 specialists operating under different acoustic conditions – underscored the need for an objective diagnostic tool. These differences were primarily attributed to inconsistencies in the vocal intensity of diagnosticians. In response, an audiometric module for phonemic hearing assessment was developed. This tool ensures standardized presentation of verbal stimuli, thereby enhancing the reliability and repeatability of diagnostic results.
The study revealed a highly significant (p < 0.001) difference between the phonemic hearing assessment results of children with APD and those without. Among the 60 children with APD, phonemic hearing deficits were more frequent and more pronounced – indicating that more phonemic oppositions were not heard by these patients – while in the group of 60 children without APD, the number of incorrectly identified oppositions was reduced by 62.9%. Nevertheless, phonemic hearing difficulties were also observed in children without a diagnosis of APD. Such deficits may result in substantial challenges in both learning and everyday functioning.
These preliminary findings suggest the importance of developing targeted therapeutic procedures for children with phonemic hearing deficits. Special attention should be given to children with both APD and phonemic hearing disorders, as their coexistence can severely impact academic performance and peer relationships. This can result in lowered self-esteem and, in some cases, psychological issues – such as behavioral problems, outbursts of aggression, tearfulness, and, in extreme cases, self-harm and suicide attempts. These issues have been particularly evident following periods of remote learning during the COVID-19 pandemic.
Data availability
The datasets generated and/or analyzed during the current study are available from the corresponding author on reasonable request.
Consent for publication
All authors agree to publish personal information about an individual.
Use of AI and AI-assisted technologies
Not applicable.