Abstract
Background. Concurrent chemoradiotherapy (CRT) is the standard treatment for locally advanced esophageal squamous cell carcinoma (ESCC). However, out-of-field locoregional relapse remains common. The optimal longitudinal expansion from gross tumor volume (GTV) to clinical target volume (CTV) varies across practice, and its impact on local control is not fully defined.
Objectives. To explore the relationship between GTV–CTV margin expansion and inflammatory biomarkers and their combined impact on prognosis to determine a more optimal target volume range for esophageal cancer (EC).
Materials and methods. A retrospective analysis of 209 ESCC patients undergoing radical CRT was conducted. Patients were categorized into small (SM), medium (MM) and large (LM) margin groups based on GTV–CTV expansion. The neutrophil-to-lymphocyte ratio (NLR), platelet-to-lymphocyte ratio (PLR), systemic immune-inflammation index (SII), and their respective fold changes were calculated and analyzed for correlations with CTV margin expansion and patient prognosis.
Results. Larger radiation fields led to higher post-treatment inflammatory markers with significant fold changes. Kaplan–Meier (KM) curves and receiver operating characteristic (ROC) curves indicated that the LM group, low pre-treatment NLR, low post-treatment NLR, PLR and SII, and fold changes in NLR, PLR and SII before and after treatment could predict local recurrence-free survival (LRFS). However, Cox analysis identified pre-treatment NLR, the change in SII from pre- to post-treatment, and GTV–CTV margin expansion as independent predictors.
Conclusions. Although inflammatory biomarkers offer prognostic value, primary GTV–CTV margin expansion has a stronger influence on LRFS in ESCC patients undergoing CRT. Further multi-institutional studies are needed to validate these findings and address current study limitations, including single-center design, small sample size and exclusion of in-field recurrences.
Key words: prognosis, esophageal squamous cell carcinoma, inflammatory biomarkers, clinical target volume, local recurrence
Background
Esophageal cancer (EC) is the 7th most common malignancy worldwide and is now considered an important global health challenge, with more than 470,000 new cases each year.1 In Asia and Eastern Europe, the most common histological subtype is esophageal squamous cell carcinoma (ESCC).2, 3 Patients with ESCC are usually diagnosed at an advanced stage.4 The National Comprehensive Cancer Network (NCCN)-based treatment guidelines recommended definitive concurrent chemoradiotherapy (dCRT) as the standard for these patients, achieving a comparable 5-year survival rate to surgery by 2020.5 Nonetheless, dCRT has some limitations: The local recurrence rate of EC patients who received dCRT is as high as 40–60%, with a 5-year overall survival rate of only 10–30%.6 The range of clinical target volume (CTV) in the definitive radiotherapy (RT) for patients with EC is heterogeneous. Early clinical trials often had larger margins for CTV in the craniocaudal direction. The Radiation Therapy Oncology Group (RTOG) conducted a phase III trial (RTOG9405), in which they defined the CTV with 5-cm margins at both the superior-inferior (SI) edges.7 In the RTOG 0113 trial, the CTV was defined as a 4-cm margin in the SI direction.8 With advancing pathological studies, Gao et al. found that about 94% of ESCC patients had microscopic tumor extensions of less than 3 cm.9 The current NCCN guidelines recommend that the CTV include the gross tumor volume (GTV) plus 3–4-cm extensions in the esophagus and gastroesophageal junction, and a 1-cm margin around them. Currently, the Chinese guideline of EC RT defines CTV as GTV plus a 3-cm margin around the primary tumor.10 However, in clinical scenarios, differences in delineation of the target volume still exist among clinicians and institutions because of varying clinical experience and a patient-specific scenario. Clinical studies have emerged where the CTV margin in the craniocaudal direction was reduced to 2 cm or less,11, 12, 13 showing acceptable local recurrence rates. Since it is believed that in-field recurrences account for most local recurrences,14 many existing clinical studies have focused on RT doses, ignoring the impact of inadequate RT margins leading to out-of-field recurrences.
Aside from the significance of radiation field size, the immune system contributes substantially to cancer therapy results. Peripheral blood cell counts and their derived ratios reflect the balance between inflammatory and immune responses. Specifically, elevated peripheral neutrophil counts suggest active inflammation and contribute to immune dysfunction, whereas normal lymphocyte levels help sustain adequate CD8+ T cell function, which is critical for effective anti-tumor immunity.15 However, the neutrophil-to-lymphocyte ratio (NLR), platelet to-lymphocyte ratio (PLR) and systemic immune-inflammation index (SII) molecules can evaluate systemic inflammatory and immune responses to identify indicators of prognosis of solid tumors such as pancreatic cancer and hepatocellular carcinoma (HCC).16, 17 A good response to chemotherapy is associated with low levels of inflammatory markers.18 However, lymphopenia due to RT can induce severe immunosuppression,19 potentially related to an increased CTV in EC RT.20 Hence, the degree of CTV expansion may have a direct impact on recurrence and an indirect effect on tumor prognosis by influencing peripheral blood inflammatory markers. In the context of concurrent CRT for EC, it is necessary to analyze the relationship between the CTV margin and blood inflammatory markers and how they jointly impact prognosis. To date, no similar retrospective analyses have been conducted.
Objectives
To investigate the relationship between GTV–CTV margin expansion and peripheral inflammatory biomarkers in locally advanced ESCC patients, and to determine their combined prognostic impact on local recurrence-free survival (LRFS).
Material and methods
Study cohort
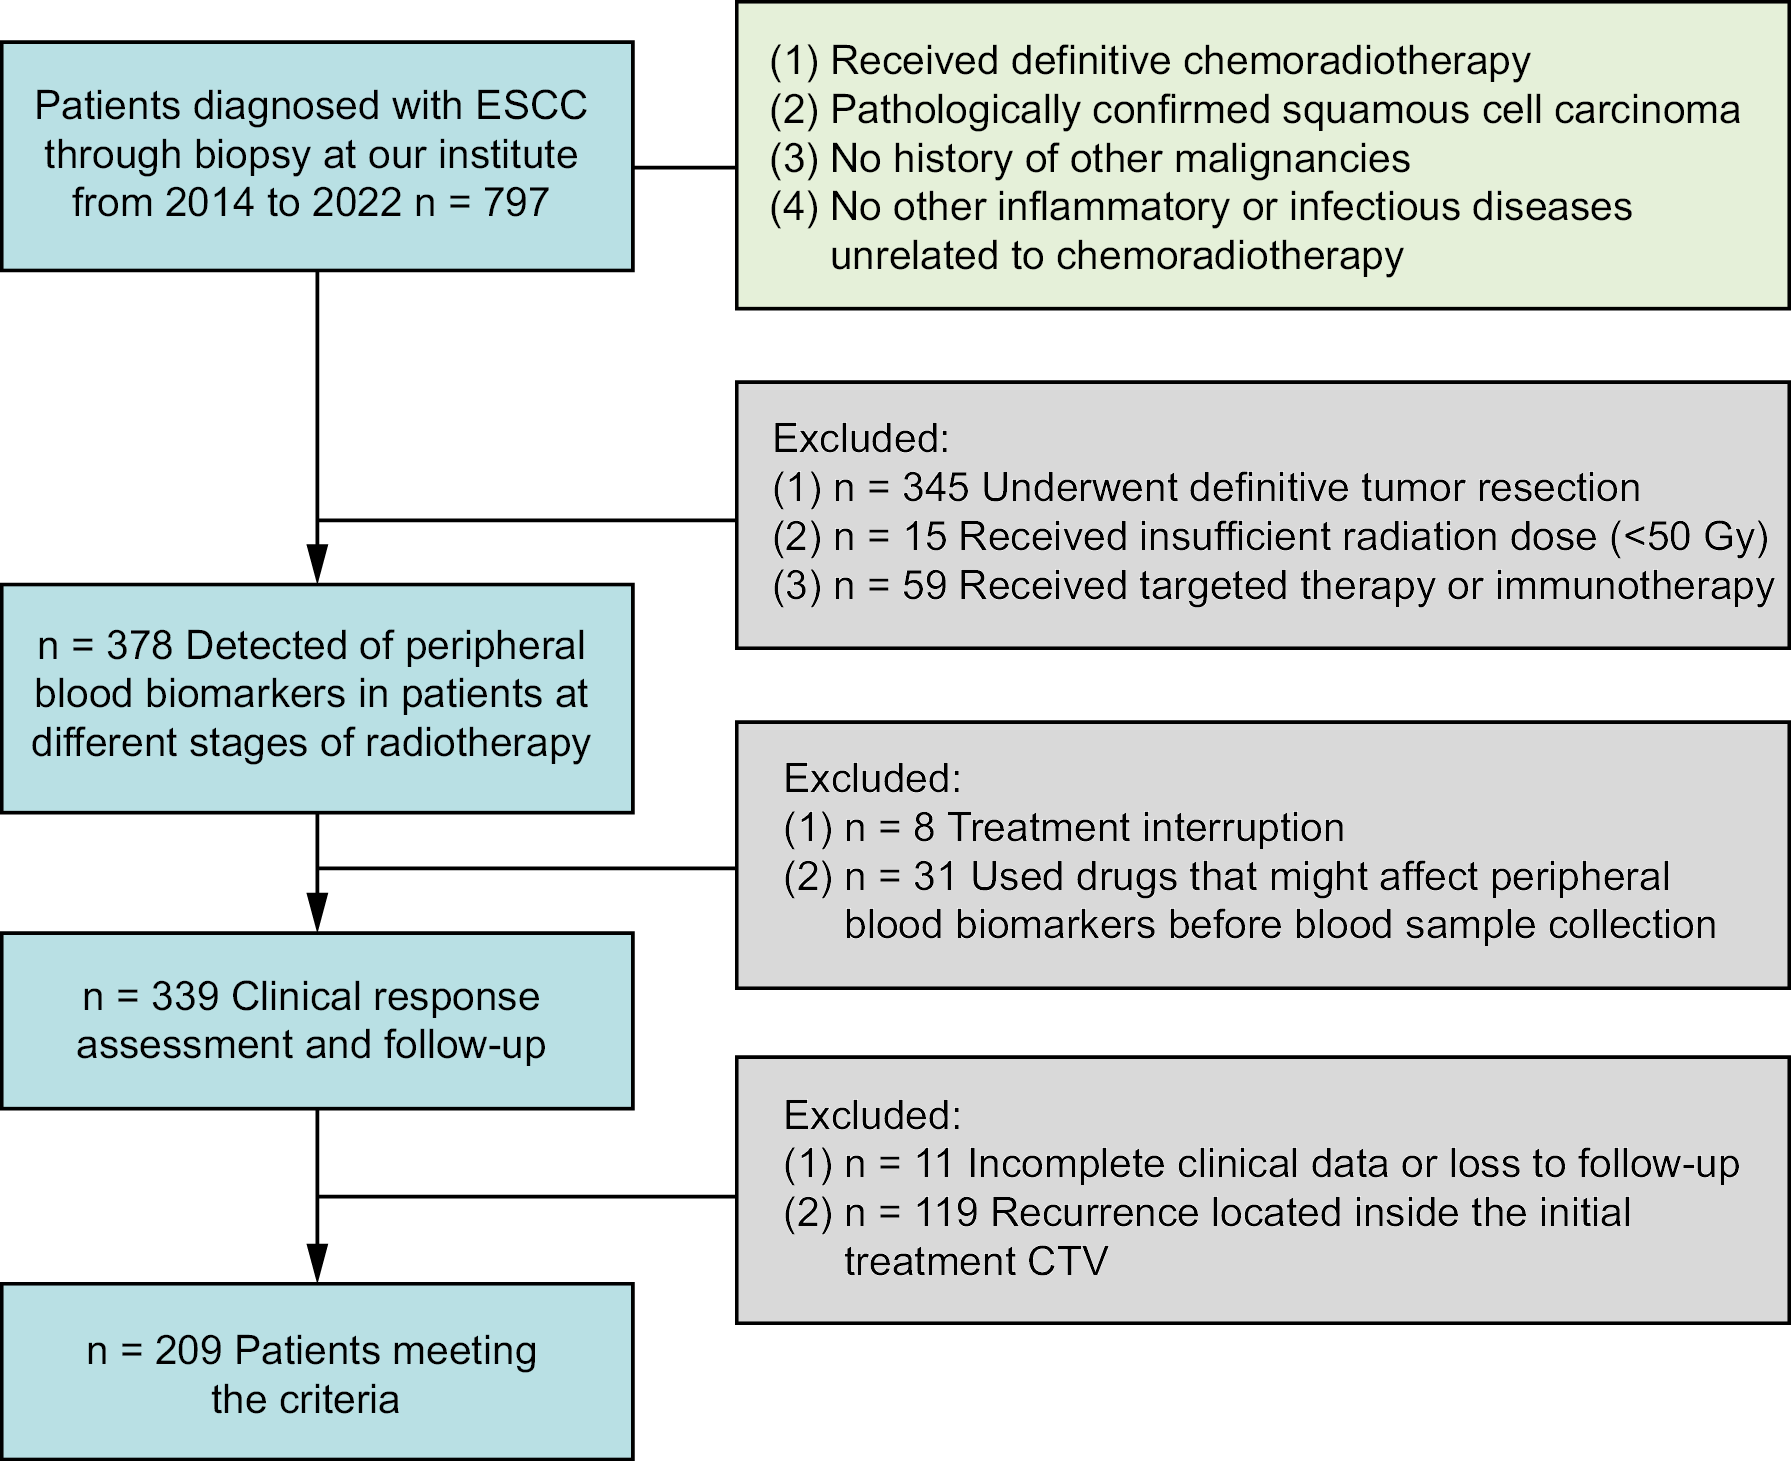
We gathered data of 797 patients who were diagnosed with ESCC via biopsy at the Qilu Hospital of Shandong University (Jinan, China) from 2014 to 2022. The inclusion criteria were: 1) patients who have accepted definitive CRT; 2) pathologically diagnosed squamous cell carcinoma (SCC); 3) patients without a history of previous malignancy; 4) patients without other non-CRT-induced inflammatory or infectious diseases. Exclusion criteria were: 1) macroscopic resection (R0 or R1), 2) insufficient irradiation dose (<50 Gy), 3) systemic therapy with targeted therapeutics or immune checkpoint inhibitors, 4) medications that could influence peripheral blood biomarker results prior to blood sampling (such as recombinant human granulocyte-stimulating factor), 5) interruption of treatment, 6) recurrence inside the original treatment CTV, and 7) incomplete clinical records or being lost to follow-up (absence of adequate official medical records, missing imaging data or absence of information on RT target volume). Based on these criteria, 209 patients were selected. The sample size was calculated to ensure adequate statistical power for detecting clinically meaningful differences in survival outcomes between groups. The patient enrolment flowchart is shown in Figure 1.
Treatment and group definitions
After endoscopy and chest-abdominal computed tomography (CT) scans, tumors were staged according to the TNM classification for EC (American Joint Committee on Cancer (AJCC) Cancer Staging Manual, 8th edition, 2017).21 For tumor localization, endoscopic-guided titanium clip placement was performed at the superior and inferior borders of the lesion prior to RT simulation. These radiopaque markers were clearly visualized on planning CT images, serving as precise fiducial landmarks to facilitate accurate GTV delineation in the treatment planning process. All patients received baseline-enhanced CT scans in the supine position before RT. The primary GTV was defined as the esophageal tumor observed on CT and endoscopy. The CTV was created by expanding the GTV by 0.5 cm radially. Based on longitudinal external expansions of the primary GTV to the CTV, 61 patients were categorized into CTV small margin (SM) group (expansion ≤2 cm), 79 into CTV medium margin (MM) group (expansion 2–3 cm, including 3 cm) and 69 into CTV large margin (LM) group (expansion >3 cm). The planning target volume (PTV) was generated by applying a margin of 0.5–1.0 cm around the CTV. Although the determination of the GTV–CTV margin followed guideline recommendations, the final decision was based on the physician-specific clinical experience and individual patient characteristics. For example, narrower margins may be used for elderly patients, whereas wider margins may be used for patients with superior performance status. However, these changes were not subject to any stringent institutional rules.
All patients received definitive RT with a total radiation dose ≥50 Gy, administered in 27–33 fractions. Organs at risk (OAR), such as the lungs, heart, spinal cord, thyroid, trachea, and larynx, were contoured. Patients were treated with either 3D-CRT or intensity-modulated radiotherapy (IMRT). They received 2 cycles of TP (paclitaxel + cisplatin) or PF (5-fluorouracil + cisplatin) chemotherapy regimens, given on day 1 and day 22 of RT.
Peripheral blood laboratory data analysis
Blood samples were collected at 3 time points: before RT, during RT (from 2 weeks after initiation to 1 week before completion) and after RT. The absolute neutrophil count (ANC), absolute lymphocyte count (ALC), absolute platelet count, and the exact timing of each blood sample were recorded. The NLR was calculated as ANC divided by ALC; the PLR was calculated as absolute platelet count divided by ALC; and the SII was calculated as the absolute platelet count multiplied by the NLR.
Definition of failure site
Local failure was defined as any recurrence at or around the primary tumor site, and classified as in-field or out-of-field recurrences. Failure patterns in our cohort were determined by reviewing all patient records. Local recurrences at or around the initial tumor bed were diagnosed using upper gastrointestinal endoscopy (with or without CT) and compared to the areas included in the prior RT CTV. Recurrence regions were classified by experienced clinicians or multidisciplinary team consensus into: 1) out-of-field recurrence when <50% of the recurrent tumor was within the CTV, 2) in-field recurrence when ≥50% of the recurrent growth was within the CTV. Out-of-field recurrence was defined using volumetric criteria, where recurrences with <50% of their volume intersecting with the original CTV were classified as out-of-field failures. In-field recurrences were excluded from this study as these failures are typically due to insufficient radiation dose or inherent tumor radioresistance and not due to inadequate target volume delineation.22, 23 The primary aim of our study was to specifically evaluate the impact of CTV margin expansion on out-of-field recurrences, which directly reflect the adequacy of radiation field coverage. The primary endpoint was LRFS, defined as the time from the date of completion of CRT to the date of first documented local recurrence or to the date of last follow-up in patients free of recurrence. Patients without documented recurrence were censored at their last disease assessment.
Statistical analyses
Statistical analysis was performed using IBM SPSS v. 27.0 (IBM Corp., Armonk, USA) for Windows and GraphPad Prism v. 10.0 (GraphPad Software, San Diego, USA). Kaplan–Meier (KM) survival analysis and log-rank tests were utilized to estimate and compare LRFS between patients. Time-dependent receiver operating characteristic (ROC) curves were created in R v 4.2.1 (R Foundation for Statistical Computing, Vienna, Austria) using the timeROC [0.4]24 and ggplot2 [3.4.4]25 packages. Optimal cutoff values corresponding to the time points with the highest area under the curve (AUC) values were determined using X tile v. 3.6.1 (Yale University, New Haven, USA). Univariate and multivariate Cox regression analyses were performed in R v. 4.2.1 using the survival [3.3.1]26 and rms [6.3-0]27 packages to identify risk factors for local out-of-field recurrence. Schoenfeld residual tests were performed, and the variance inflation factor (VIF) was calculated for each predictor variable to confirm the statistical validity and robustness of the multivariable analysis. To analyze peripheral blood changes, box plots, heat maps and Loess smooth trend lines were generated to visualize temporal variations over time. For multiple group comparisons, one-way analysis of variance (ANOVA) was conducted, followed by Tukey’s multiple comparisons test to identify significant pairwise differences.
Results
Patient characteristics
The clinicopathological baseline characteristics of the 209 patients who met the inclusion criteria, along with their relationship to LRFS, are summarized in Table 1. The patients had a median age of 65 years, with 105 patients (50.2%) older than 65. Analysis revealed that male sex, a history of alcohol consumption and belonging to the SM group were all significantly associated with poorer LRFS outcomes.
The impact of clinical target volume margin expansion on patient prognosis and peripheral inflammatory biomarkers
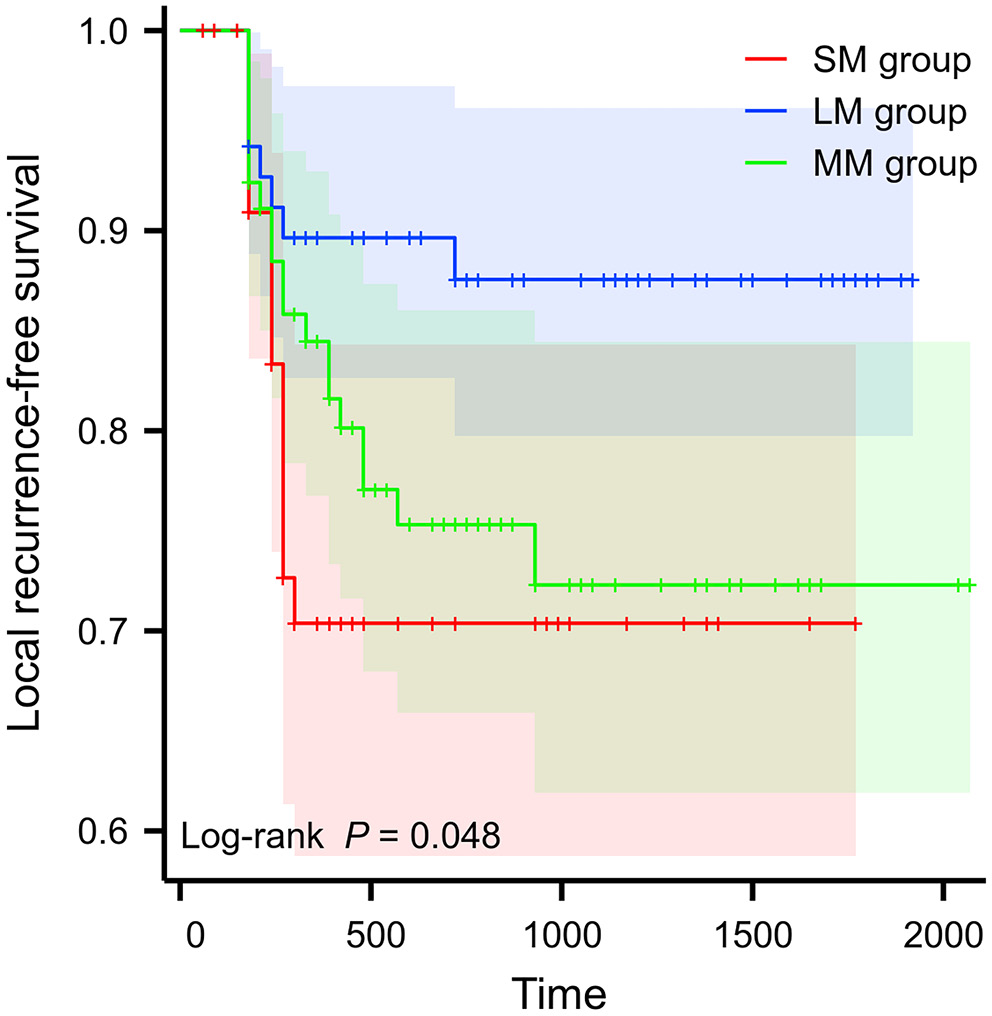
Kaplan–Meier curves were used to analyze the correlation between the longitudinal CTV margin expansion and LRFS (Figure 2). Overall, the LM group had a better prognosis than the other 2 groups (p = 0.048). Upon pairwise comparisons and p-value adjustment (Bonferroni method), the statistical significance was attenuated (LM group vs SM group, padj = 0.059; MM group vs SM group, Padj = 1.000; MM group vs LM group, Padj = 0.160).
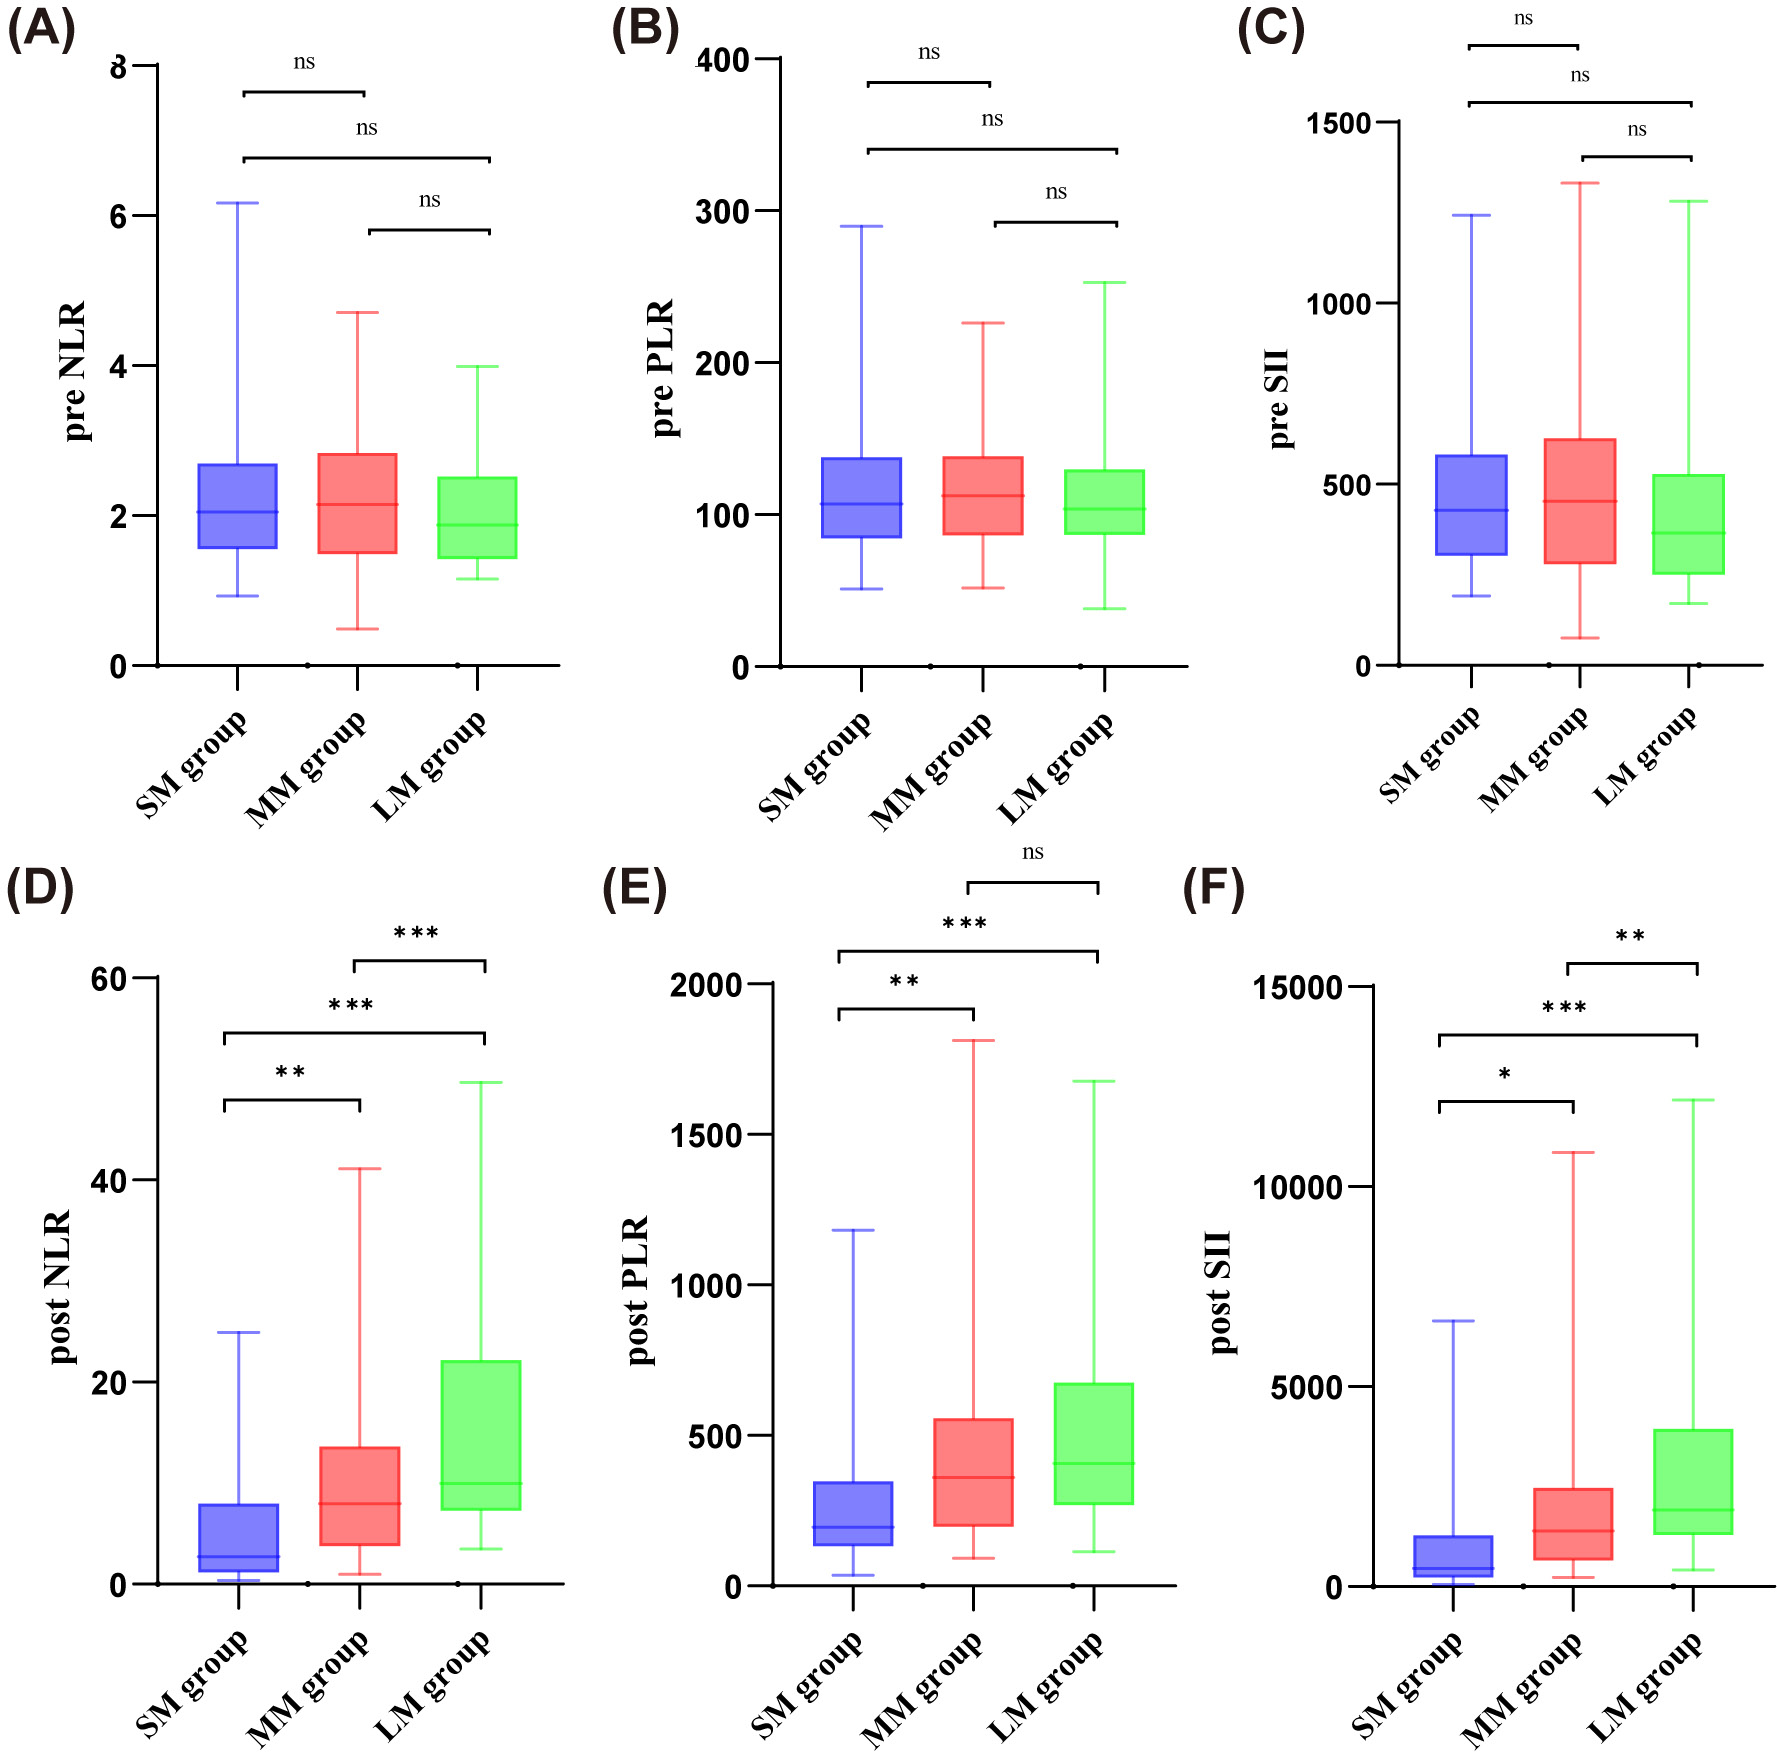
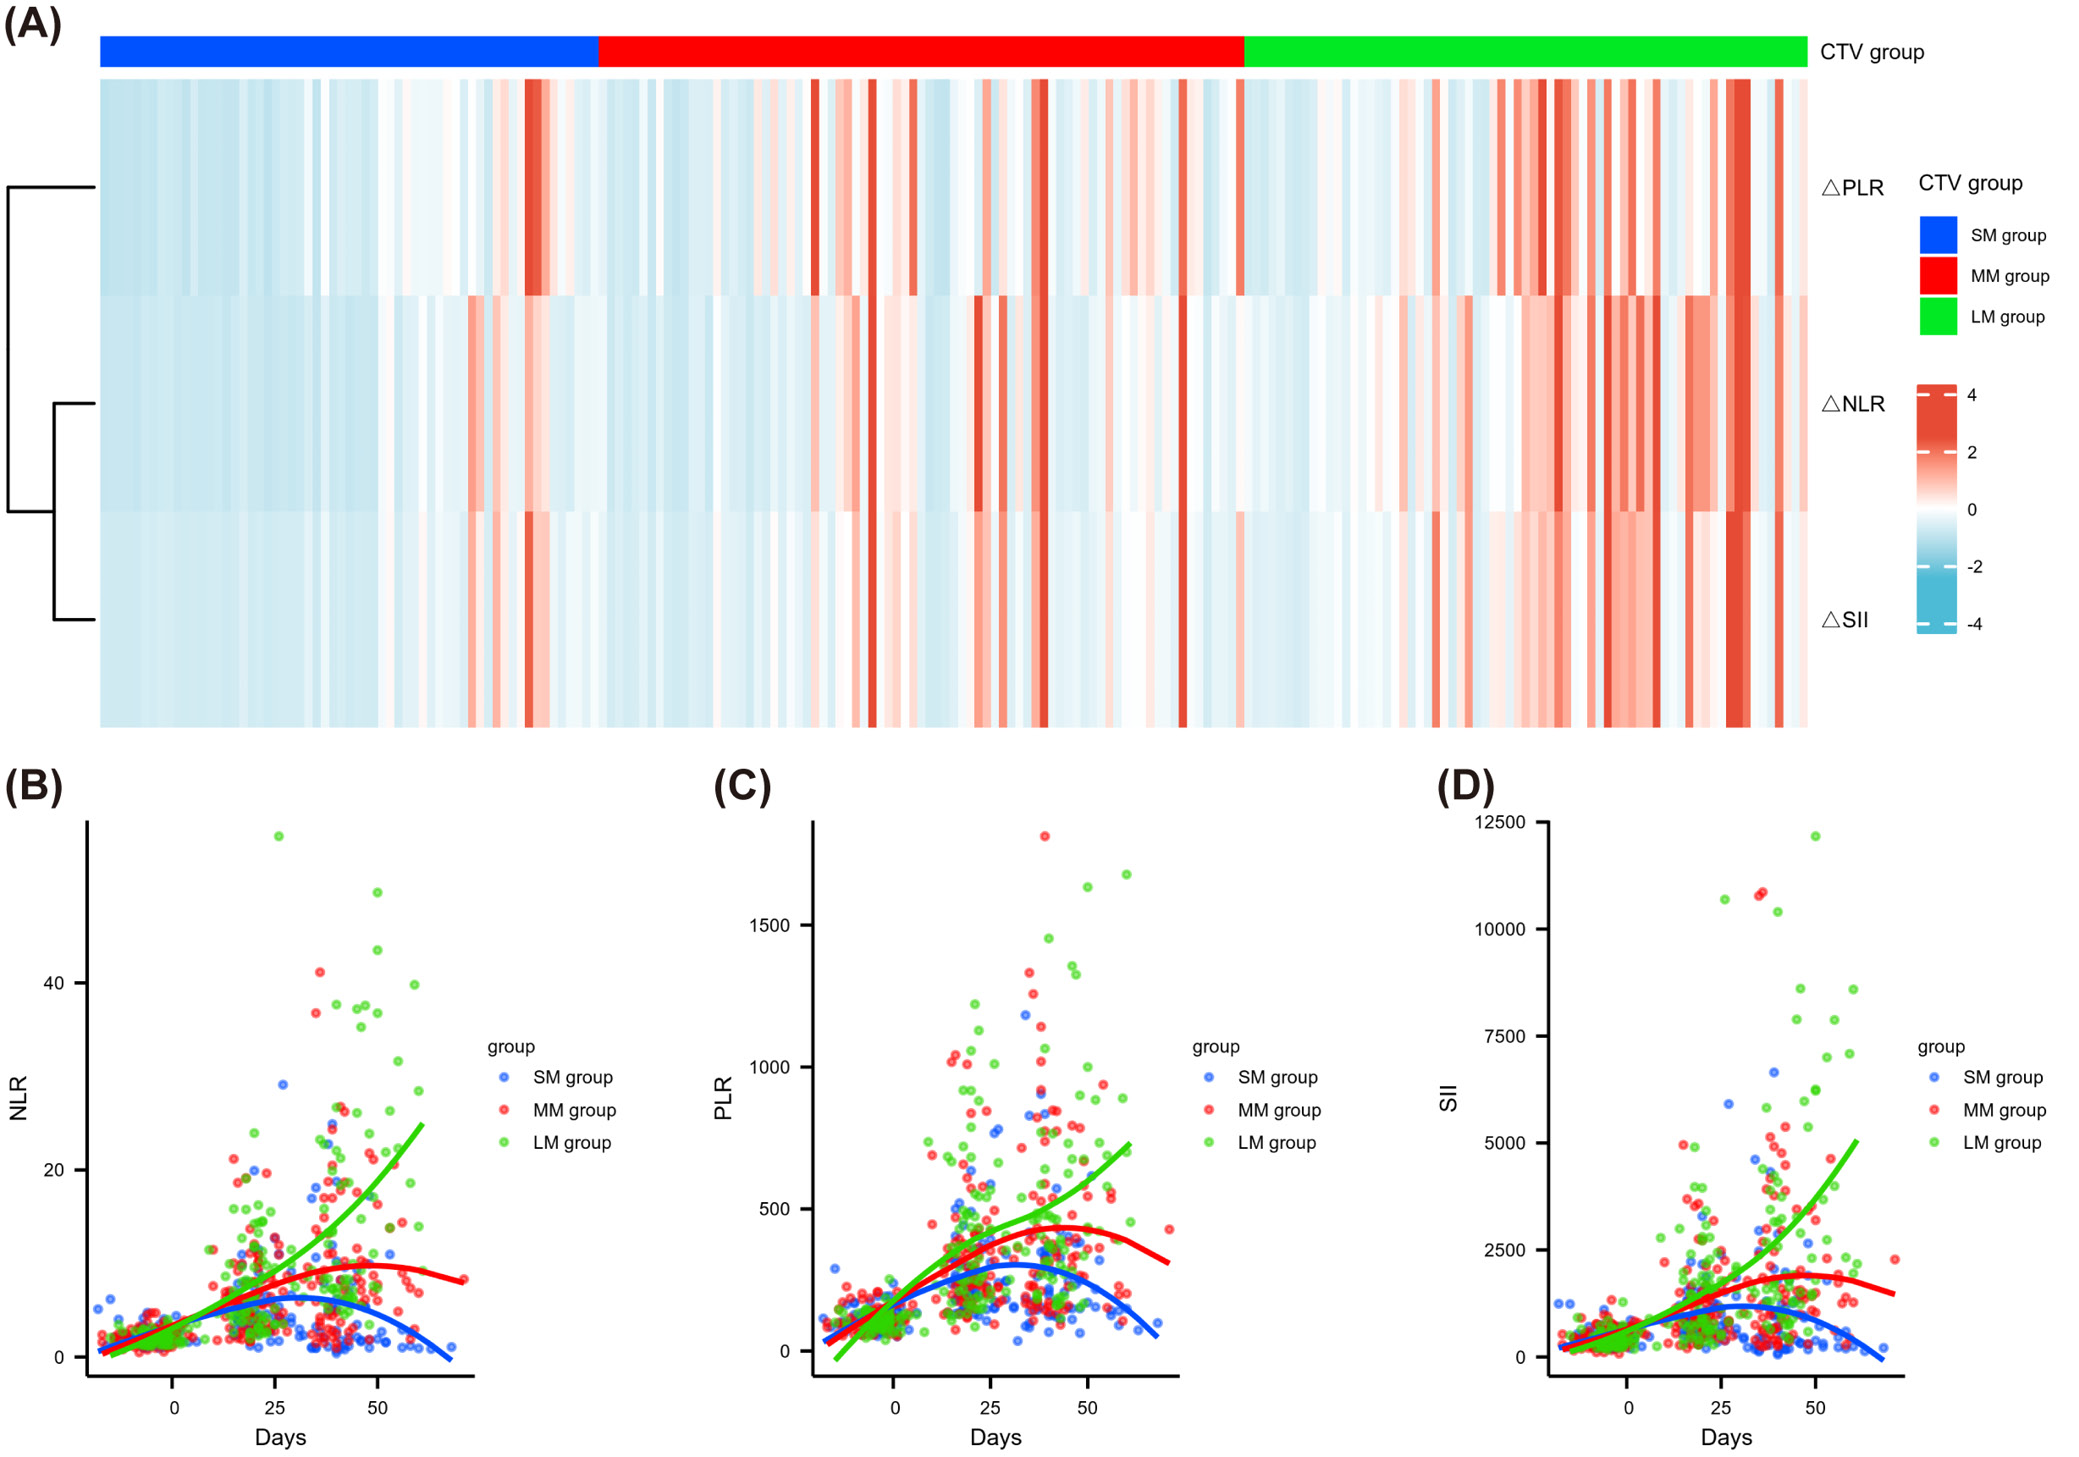
The distribution of NLR, PLR and SII before treatment was similar among the 3 groups with different CTV margin expansions (Figure 3). Nevertheless, the post-treatment NLR, PLR and SII were significantly lower in the SM group than in the MM and LM groups (median NLR: 2.70 vs 7.97 vs 9.96, p < 0.001; median PLR: 196.52 vs 360.87 vs 408, p < 0.001; median SII: 457.47 vs 1,391.9 vs 1,918.4, p < 0.001). In addition, the heatmap (Figure 4A) illustrating the distributions of ΔNLR, ΔPLR and ΔSII showed that the proportion of patients with increased PLR and SII was significantly higher in the LM group compared to the SM group. ΔNLR/ΔPLR/ΔSII were defined as fold change (post-treatment/pre-treatment). Figure 4B–D shows the inflammatory biomarkers for each patient at various time points before, during and after CRT. The NLR (Figure 4B), PLR (Figure 4C) and SII (Figure 4D) all showed an initial upward trend, followed by a decline back to their original values, in patients from the MM and SM groups. The MM group had a slightly larger increase and a relatively smaller decline. For patients within the LM group, inflammatory biomarkers were elevated after RT without rebound.
Inflammatory markers as predictors of local recurrence and their optimal cutoff values
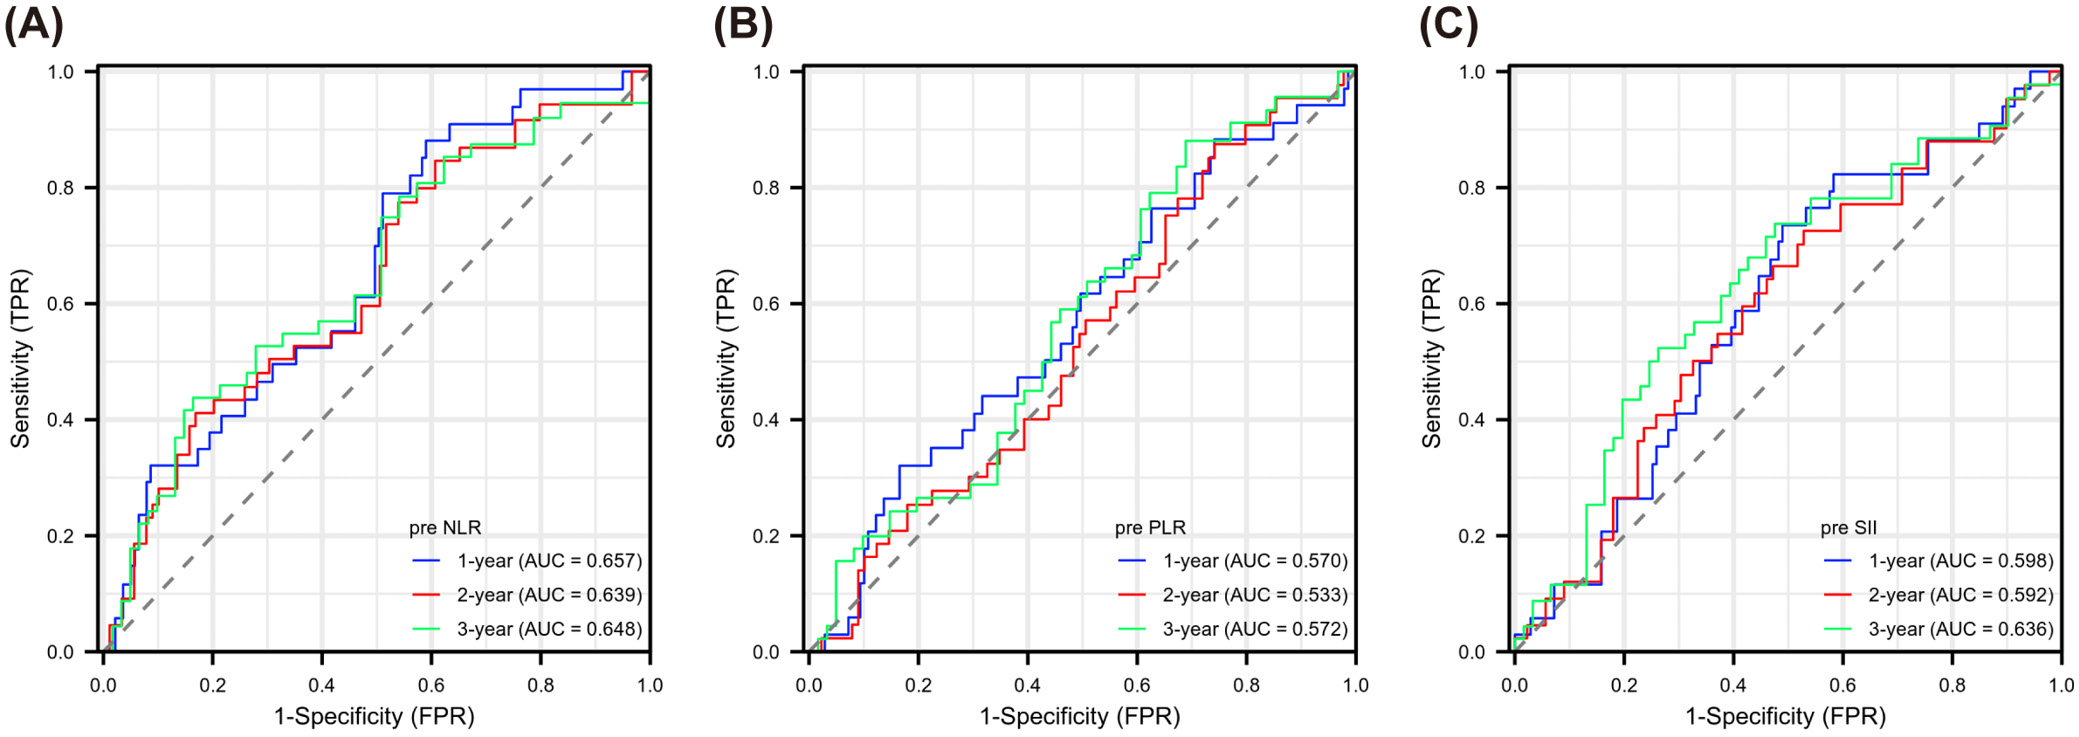
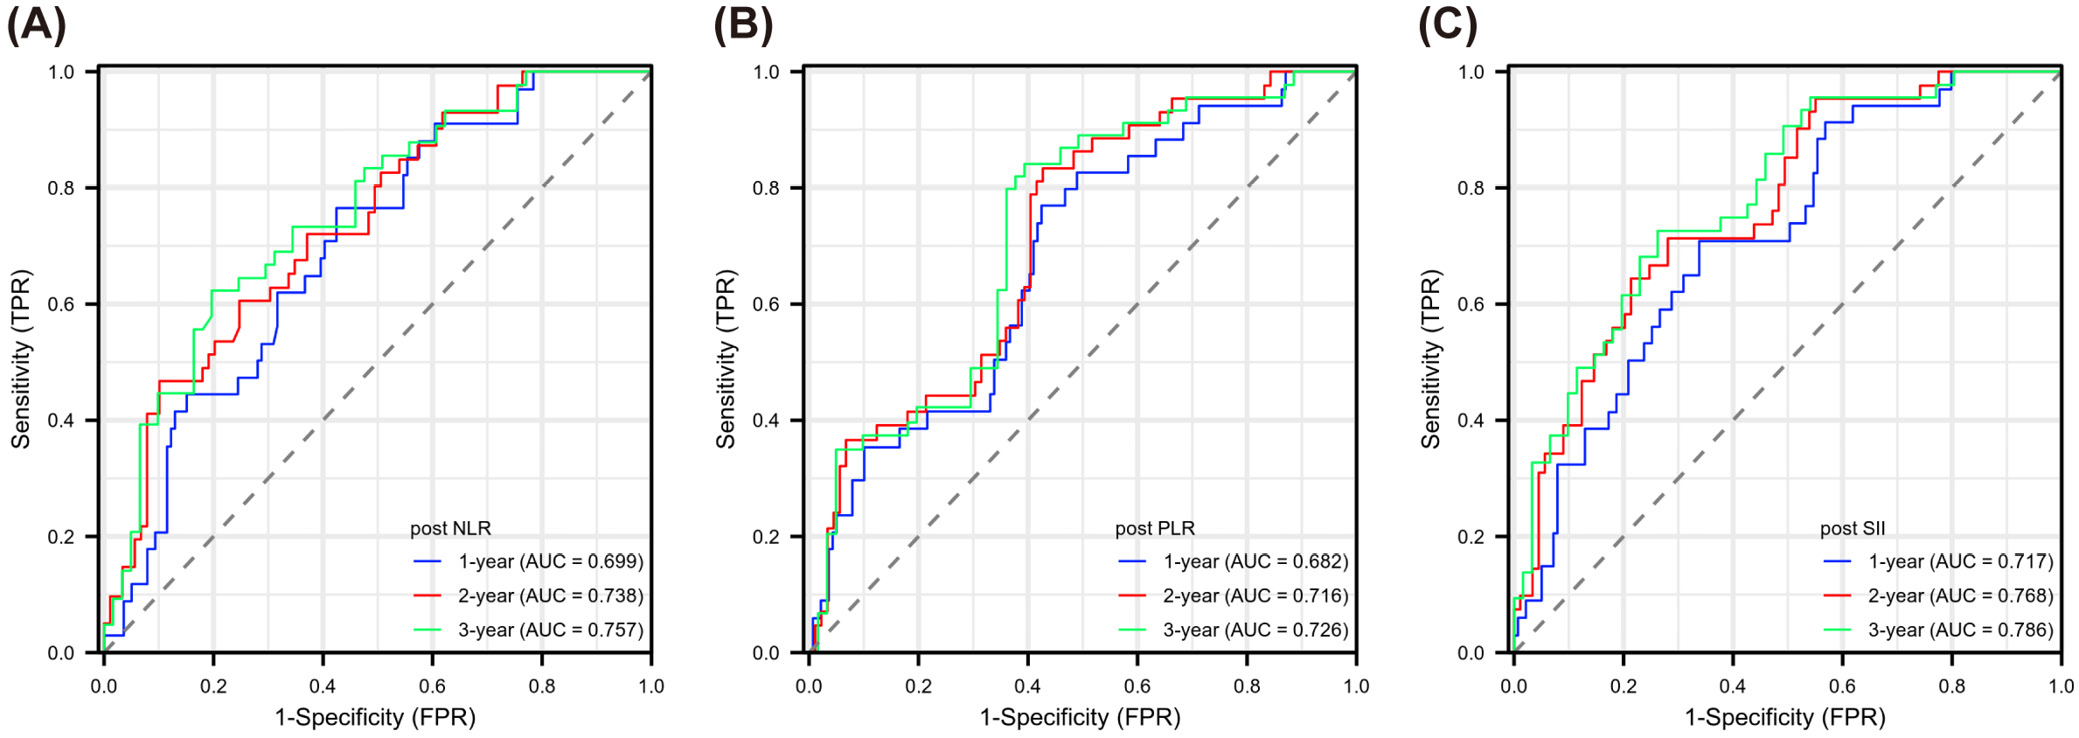
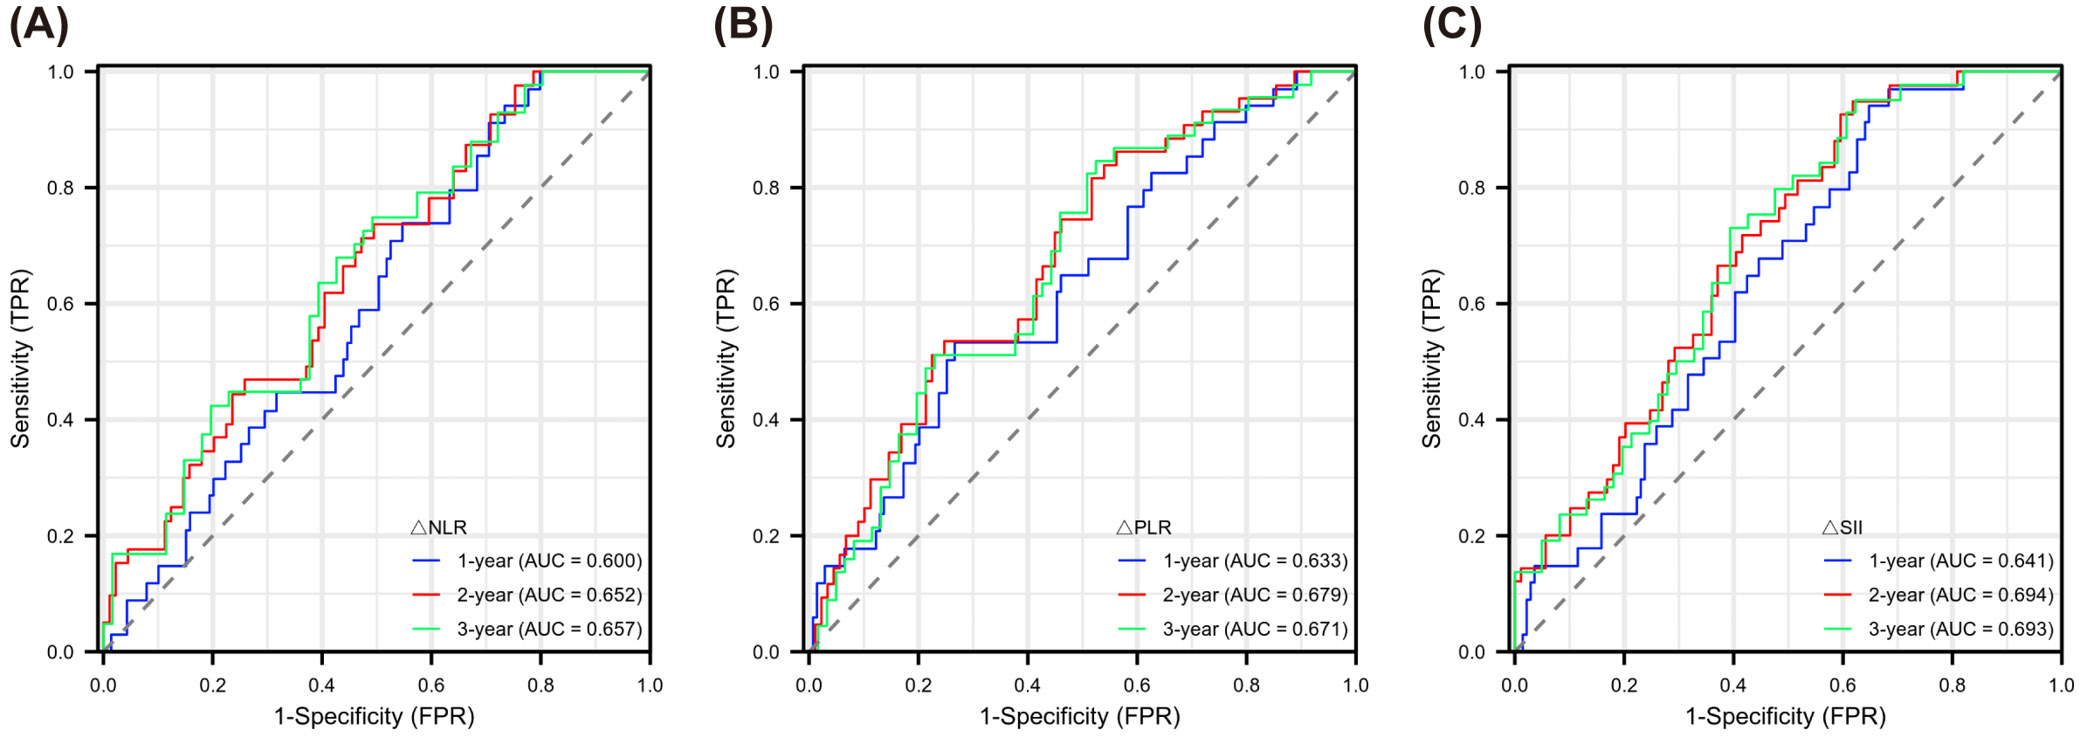
Evaluating Figure 5, Figure 6, Figure 7, we observed varying efficacy of inflammatory markers in predicting cancer recurrence. Before treatment, NLR maintained relatively steady predictive performance across the 3-year observation period (AUC: 0.657, 0.639, 0.648). The PLR showed weaker pre-treatment predictive capability, with AUC values in the range of 0.533–0.572. Pre-treatment SII demonstrated slightly better predictive potential than PLR, but its predictive value was lower than that of NLR (AUC: 0.598, 0.592, 0.636). The markers’ predictive accuracy improved considerably after treatment. The NLR showed a gradual improvement in prediction strength over time (year 1: 0.699; year 2: 0.738; year 3: 0.757). Post-treatment PLR similarly demonstrated enhanced predictive capacity across years 1 to 3 (0.682, 0.716, 0.726). The SII emerged as the most robust post-treatment predictor, with its highest predictive power in year 3 (AUC: 0.786). The difference between pre- and post-treatment values (Δ) also offered meaningful prognostic information. ΔNLR’s prediction ability peaked in year 3 (AUC: 0.657), while both ΔPLR and ΔSII reached maximum prediction efficiency in year 2 (AUC: 0.679 and 0.694, respectively). To categorize patients by recurrence likelihood, we determined optimal thresholds for each marker using x-tile software, enabling stratification into higher and lower risk categories (see shared data).
Inflammatory markers predict patient outcome
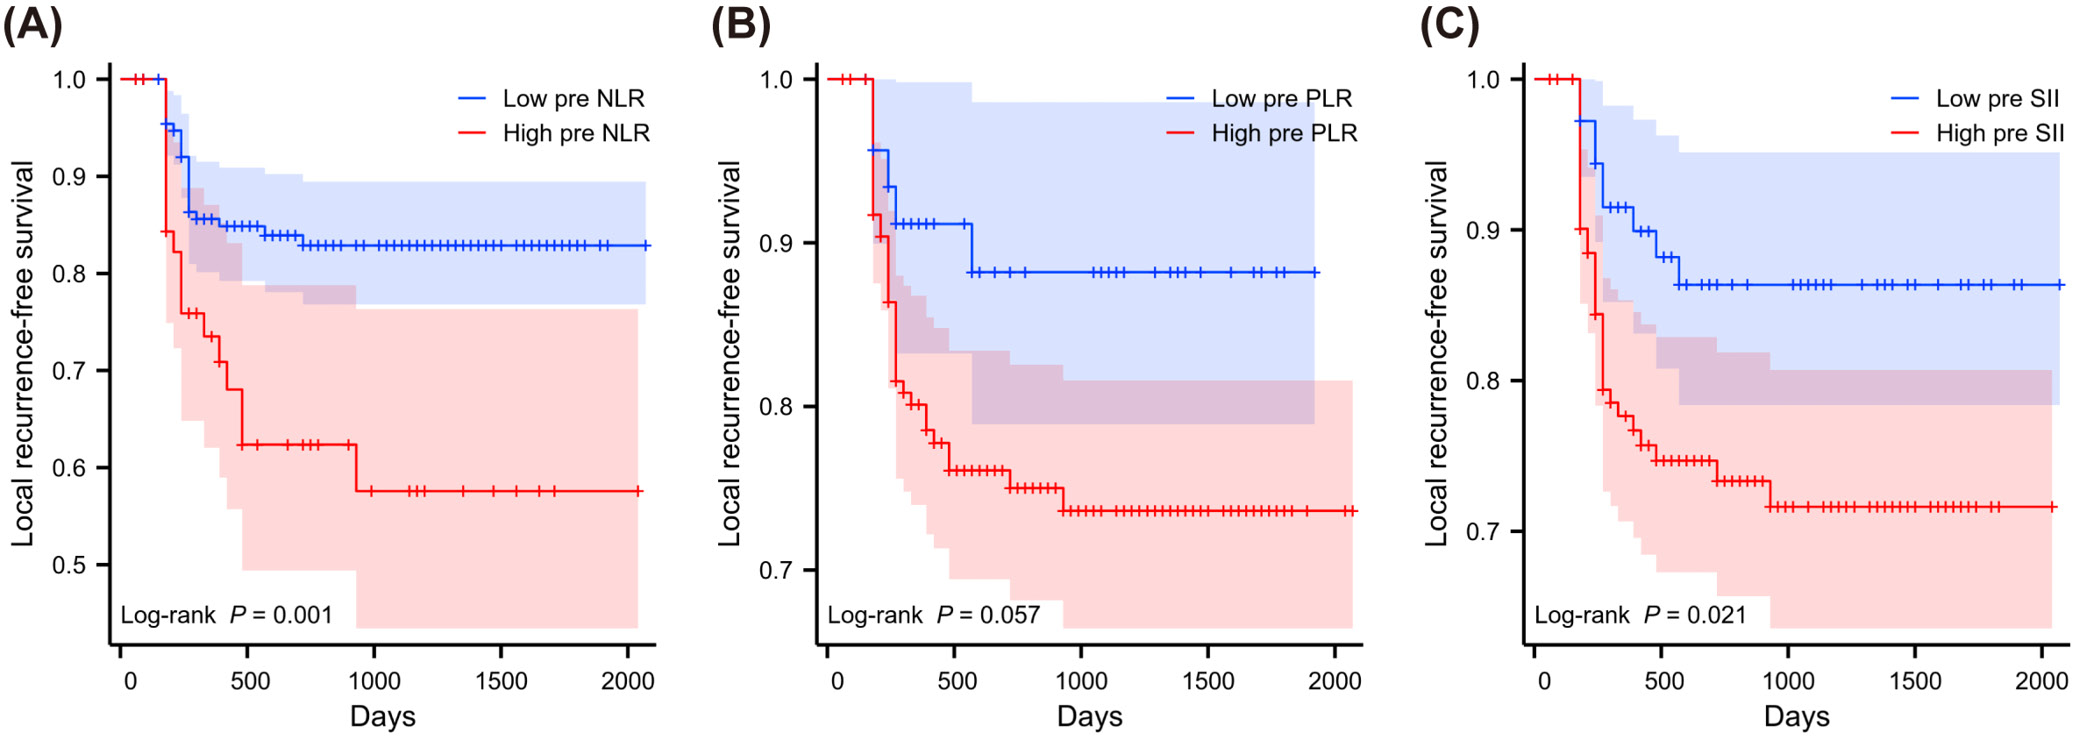
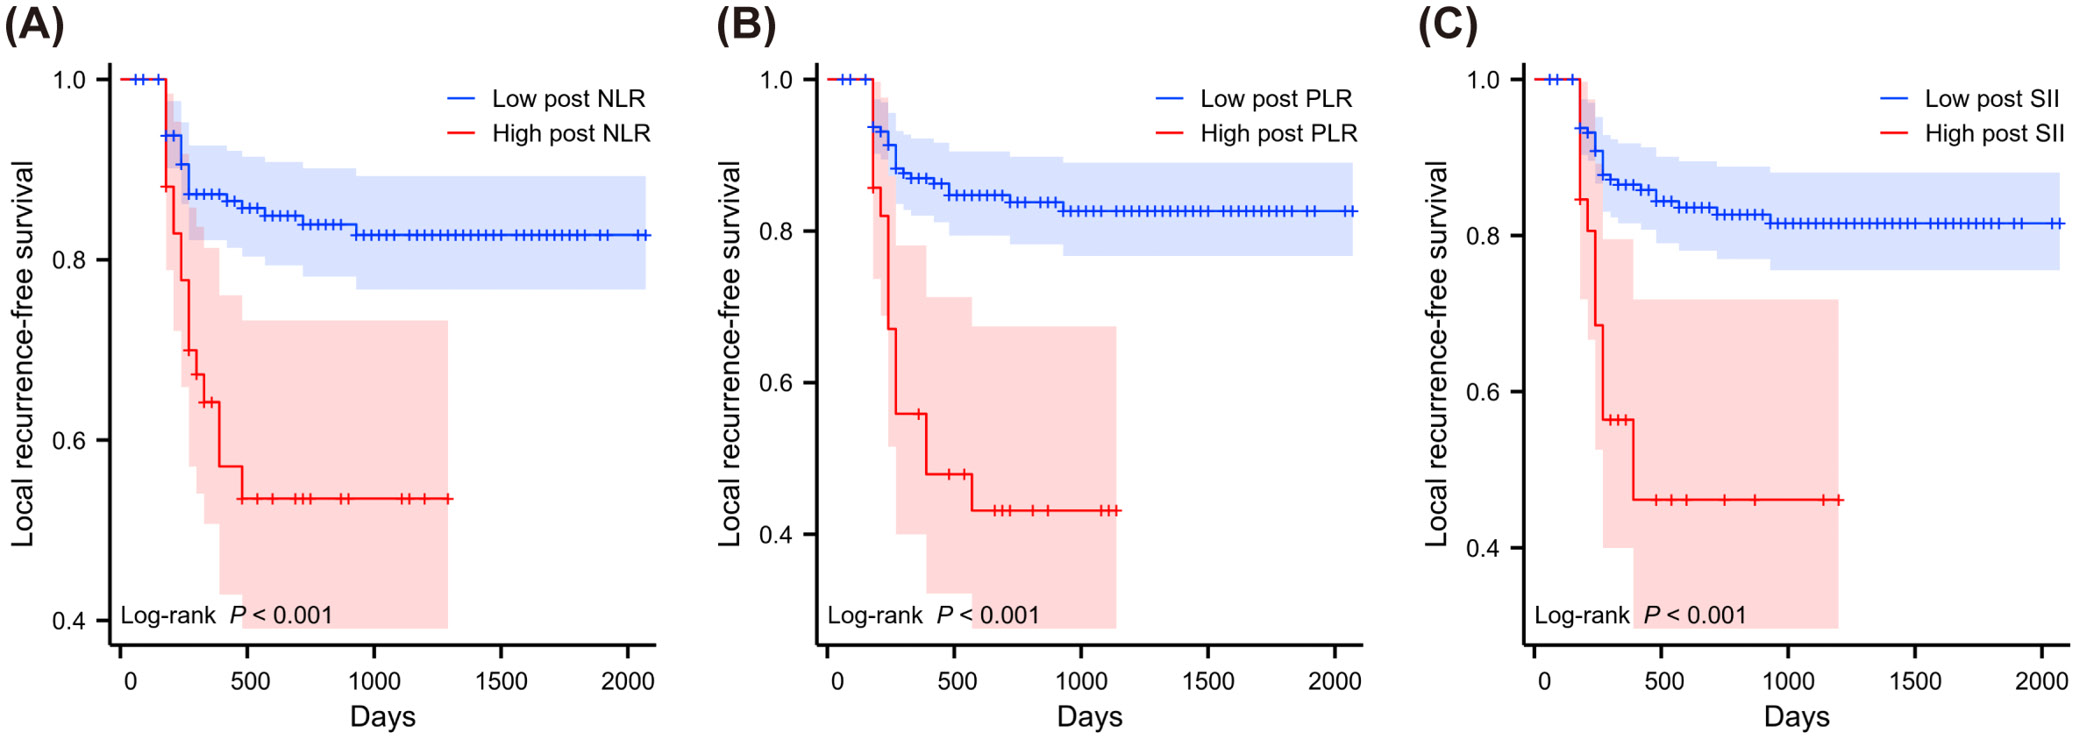
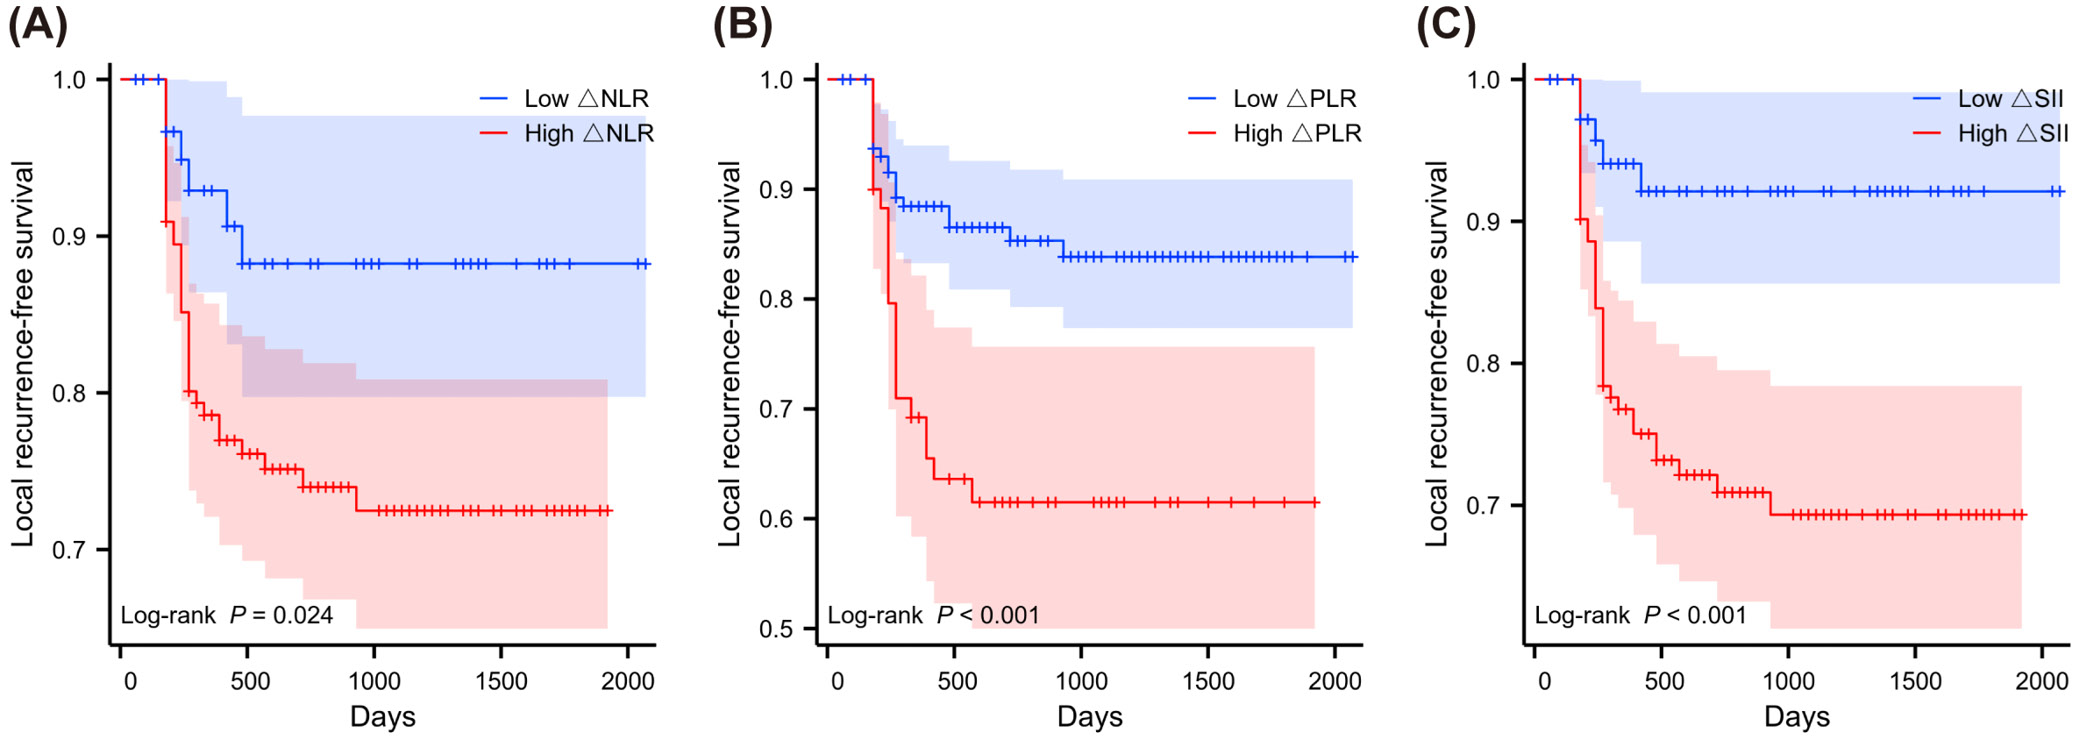
The KM method was used to examine the relative risk of LRFS from inflammatory indicators in patients with concurrent CRT (Figure 8, Figure 9, Figure 10). High and low groups of inflammatory markers were divided according to optimal cutoff values based on previous x-tile analysis. Inflammatory markers grouped by optimal cutoff value were significantly associated with LRFS. Using KM methodology, we identified significant relationships between inflammatory indicators and recurrence patterns. Patients showing high NLR before treatment faced worse outcomes (p = 0.001, depicted in Figure 8A). Pre-treatment SII elevation similarly predicted poor prognosis (p = 0.021, shown in Figure 8C). Though pre-treatment markers showed limited correlations, the post-treatment measurements demonstrated robust predictive strength. After treatment, patients with increased NLR values experienced significantly shorter recurrence-free periods (p < 0.001, Figure 9A). Likewise, elevated post-treatment PLR and SII levels strongly correlated with earlier recurrence (p < 0.001, Figure 9B and Figure 9C, respectively). The degree of marker elevation from baseline to post-treatment time points further enhanced predictive accuracy. Greater increases in ΔNLR (p = 0.024, Figure 10A), ΔPLR (p < 0.001, Figure 10B) and ΔSII (p < 0.001, Figure 10C) all corresponded with significantly accelerated time to disease recurrence.
Univariate and multivariate analysis of patient local recurrence-free survival
In the assessment of prognostic indicators, inflammatory markers and CTV margin expansion were examined using Cox regression methods (Table 2). Within the univariate analysis framework, several inflammatory parameters demonstrated significant correlations with LRFS. Such correlations were observed for multiple inflammatory indicators. Before treatment began, both NLR (p = 0.002) and SII (p = 0.025) showed meaningful associations. During the treatment period, PLR measurements (p = 0.027) demonstrated prognostic value. All 3 biomarkers showed strong statistical significance following treatment completion (NLR, PLR and SII p < 0.001). Moreover, the magnitude of the variation of these inflammatory indices between time points remained statistically significant predictors (p = 0.030, p < 0.001 and p = 0.002 for ΔNLR, ΔPLR and ΔSII values, respectively). Univariate analysis found that patients with large CTV margins had significantly higher outcomes than patients with small margins (p = 0.018) with respect to treatment volumes. No significant prognostic difference emerged between medium and large margin groups (p = 0.096). Additional factors in the multivariate model – including sex, alcohol consumption history, post-treatment inflammatory markers, and their changes – failed to reach statistical significance (all p > 0.05). The proportional hazards assumption was confirmed through global testing (χ2 = 21.39, degrees of freedom (df) = 24, p = 0.616), as detailed in shared data. There were no indications of multicollinearity issues in the multivariate model, as the assessment of multicollinearity indicated that all predictors possessed VIF < 5 (see shared data). Results of the goodness-of-fit tests are presented in shared data. The results suggest that margin expansion of GTV–CTV has a major contribution to local recurrence prevention than inflammatory markers. Another inflammatory marker is the NLR before treatment. The changes in inflammatory markers during treatment require the combined effect of neutrophils, platelets and lymphocytes (ΔSII) to significantly impact prognosis.
Discussion
High recurrence rates after RT in EC patients remain a significant challenge for oncologists, as it greatly reduces survival chances. Our study investigated the impact of using different primary GTV–CTV margin expansions in definitive concurrent CRT for unresectable ESCC, the effect of inflammatory biomarkers on prognostic outcomes, and the relationship between RT fields and inflammatory markers.
The present study differs from most other studies on CTV margin expansions. Previous research often included all locally recurrent patients in the analysis. Patients who developed recurrences inside the CTV were excluded from this comparison, as in-field recurrences are usually due to tumor radioresistance or the dose of irradiation. Previously, it has been shown that the majority of recurrences after RT for EC occur within the irradiated field (CTV) and that <20% of local recurrences are found away from the irradiated field.28, 29 However, these studies often used CTV margin expansions of more than 3 cm. Currently, the optimal SI distance from GTV–CTV is still under discussion. Previous RTOG 850130 and RTOG 94057 trials used large radiation fields extending 5 cm beyond the GTV from the supraclavicular fossa to the esophagogastric junction. According to pathological conclusions, a 3-cm GTV–CTV margin can cover 80–90% of the tumor range,9, 11, 31 leading many radiation oncologists to be reluctant to reduce the longitudinal primary GTV–CTV margin to less than 3 cm. With the development of RT technology, more radiology experts are considering the radiation-related toxicity caused by large radiation fields,32 favoring the use of smaller CTV fields, such as involved-field irradiation.20, 33 Clinicians in many institutions are also considering smaller longitudinal CTV expansions for EC, with attempts within 2 cm being common.12, 13 Our study concluded through KM curve analysis that the smaller the CTV margin, the significantly higher the probability of local recurrence, although the overall curve had considerable censoring. Further univariate and multivariate Cox analysis found that a GTV–CTV margin expansion of less than or equal to 2 cm is insufficient. The MM group and LM group showed lower out-field local recurrence rates compared to the SM group, with no significant difference between the MM and LM groups. This suggests that a longitudinal CTV expansion of 2–3 cm may be adequate and does not increase the risk of recurrence compared to a CTV margin greater than 3 cm.
Chronic inflammation is often considered a hallmark of tumors, promoting the progression of various solid tumors by modulating the tumor microenvironment (TME) and affecting patient survival.34 Based on their effector functions, such as the secretion of pro-tumoral cytokines, chemokines and angiogenesis, circulating neutrophils enhance tumor progression, which could contribute to tumor radioresistance.35, 36, 37 Platelets have also been shown to have critical functions in tumor invasion, angiogenesis and metastasis.38 Lymphocytes, as the main component of anti-tumor immunity, are widely recognized for inhibiting tumorigenesis and progression.39 It has been established that NLR, PLR and SII are common inflammatory biomarkers that exhibit confirmed predictive value in various solid tumours.18, 40, 41, 42, 43, 44 We assessed the ability of these inflammatory markers to predict local recurrence in patients through time-dependent ROC curves and found that the predictive ability of post-treatment inflammatory markers was high, with the strongest predictive ability in the 3rd year after treatment. Inflammatory markers during treatment did not have predictive ability, possibly due to inconsistent blood sample collection times among different patients during treatment. Among pre-treatment inflammatory markers, only NLR had predictive ability, while PLR and SII did not. Changes in inflammatory markers before and after treatment also had predictive ability, with ΔSII showing the strongest predictive value. The KM curves and univariate Cox analysis, following the determination of cutoff values with x-tile, demonstrated analogous conclusions. Low inflammatory markers post-treatment and low changes in inflammatory markers during treatment showed better LRFS. Pre-treatment low NLR and SII were also associated with good LRFS. However, after multivariate Cox analysis, only pre-treatment NLR and ΔSII were independent influencing factors, indicating that the impact of inflammatory markers calculated from neutrophils, lymphocytes and platelets on LRFS was not as significant as anticipated but still had some predictive significance. However, a potential confounding factor is that we excluded a considerable proportion of in-field local recurrence patients to more accurately explore the impact of CTV margin expansion, which may have led to the exclusion of peripheral blood indicators of many recurrent patients from the statistics.
Lymphocytes are more sensitive to RT,45, 46 and as EC is a thoracic tumor, radiation is closer to the heart during treatment, resulting in more significant lymphocyte reduction due to large radiation entry points.47 Neutrophils are less affected by RT and may not show significant changes after conventional RT.48, 49 Platelets and red blood cells may also decrease after RT, but their reduction is considered significantly less than that of white blood cells.50, 51 Current studies suggest that increased radiation fields may lead to stronger RT toxicity,20, 52 which may also result in more severe lymphocyte reduction.53 However, the impact of longitudinal CTV expansion on peripheral blood inflammatory markers in EC has not been studied. Our study found that larger radiation fields lead to increased post-treatment inflammatory biomarkers, with significant differences between the LM group and MM group compared to the SM group and also between the LM and MM groups. This may be related to the reduction of lymphocytes with the expansion of the radiation field. The heatmap of changes in inflammatory markers before and after RT also supported this, with larger radiation fields leading to elevated inflammatory markers during treatment in more patients. We also studied the trend of changes in inflammatory markers during treatment. Both the SM and MM groups experienced a rise and fall trend in inflammatory markers from baseline levels, with the MM group showing a more pronounced fluctuation trend during treatment. The LM group maintained an upward trend until blood sample collection after treatment. This may be due to more severe lymphocyte reduction caused by expanded radiation fields, which persisted without recovery after RT, or it could indicate increased RT-related inflammation. This suggests that larger CTV margin expansions may lead to increased RT-related adverse reactions.
This study also found that larger longitudinal CTV expansions lead to elevated inflammatory biomarkers, affecting the trend of changes in inflammatory markers when greater than 3 cm, possibly leading to increased RT-related inflammation or adverse reactions. These findings indicate that the strategy of unduly broadening the radiation range to reduce recurrence rates is not suitable since a too broad radiation range indirectly influences treatment outcomes by affecting inflammatory markers. In the age of immunotherapy, inflammatory biomarkers may have a larger role in treatment, which should warrant their increasing consideration. In addition, inflammatory markers have been shown to be associated with immune checkpoint blockade efficiency in various solid tumors, including lung cancer, melanoma and colorectal tumors.54, 55, 56, 57 Elevated inflammatory markers are often signs of tumor-induced immune suppression, which directly correlates with poor responses to immunotherapy. Even though immunotherapy remains a second-line treatment for EC according to guidelines, the speed of its development indicates that inflammatory biomarkers may become increasingly relevant in the future. Based on the impact of radiation field size on inflammatory markers, more careful deliberation into the primary tumor CTV range of our patients may be warranted in those who are likely to receive immunotherapy in the future.
Limitations of the study
A limitation of this study is the exclusion of patients with in-field local recurrence, which may affect the predictive value of peripheral blood biomarkers for recurrence. Additional limitations include the small sample size drawn from a single center, potentially introducing statistical bias, and the challenge of accounting for treatment-related differences, such as variations in radiation techniques (3D-CRT vs IMRT), irradiation frequencies and fractionation doses. Another limitation is the gender imbalance in the cohort, with 78% (163 patients) male and only 22% (46 patients) female participants. While this disparity likely reflects the higher reported incidence of ESCC in men, as shown in epidemiological studies, it may limit the generalizability of the findings to the female population.
Conclusions
This study suggests that although local out-field recurrence in EC after concurrent CRT is rare, it remains clinically significant. Such recurrence may be associated with the recent trend of reducing the GTV–CTV margin expansion. A GTV–CTV margin expansion ≤2 cm was identified as an independent risk factor for local out-field recurrence, indicating that a 2 cm radiation margin may be insufficient. Notably, no significant difference in recurrence rates was observed between 2–3 cm and >3 cm expansions. While inflammatory biomarkers have predictive value, the primary GTV–CTV margin expansion appears to have a stronger influence on the prognosis of local out-field recurrence.
Data Availability Statement
The datasets supporting the findings of the current study are openly available in figshare.com at https://figshare.com/s/5b41dcc88ea8f2ff1c23.
Consent for publication
Not applicable.
Use of AI and AI-assisted technologies
Not applicable.