Abstract
Background. Breast cancer remains a major healthcare challenge, highlighting the need for early and accurate diagnosis. Shear-wave elastography (SWE), an ultrasound-based imaging technique that quantifies tissue elasticity, has emerged as a promising tool. Recent studies suggest that SWE may provide additional diagnostic value when used alongside conventional imaging methods.
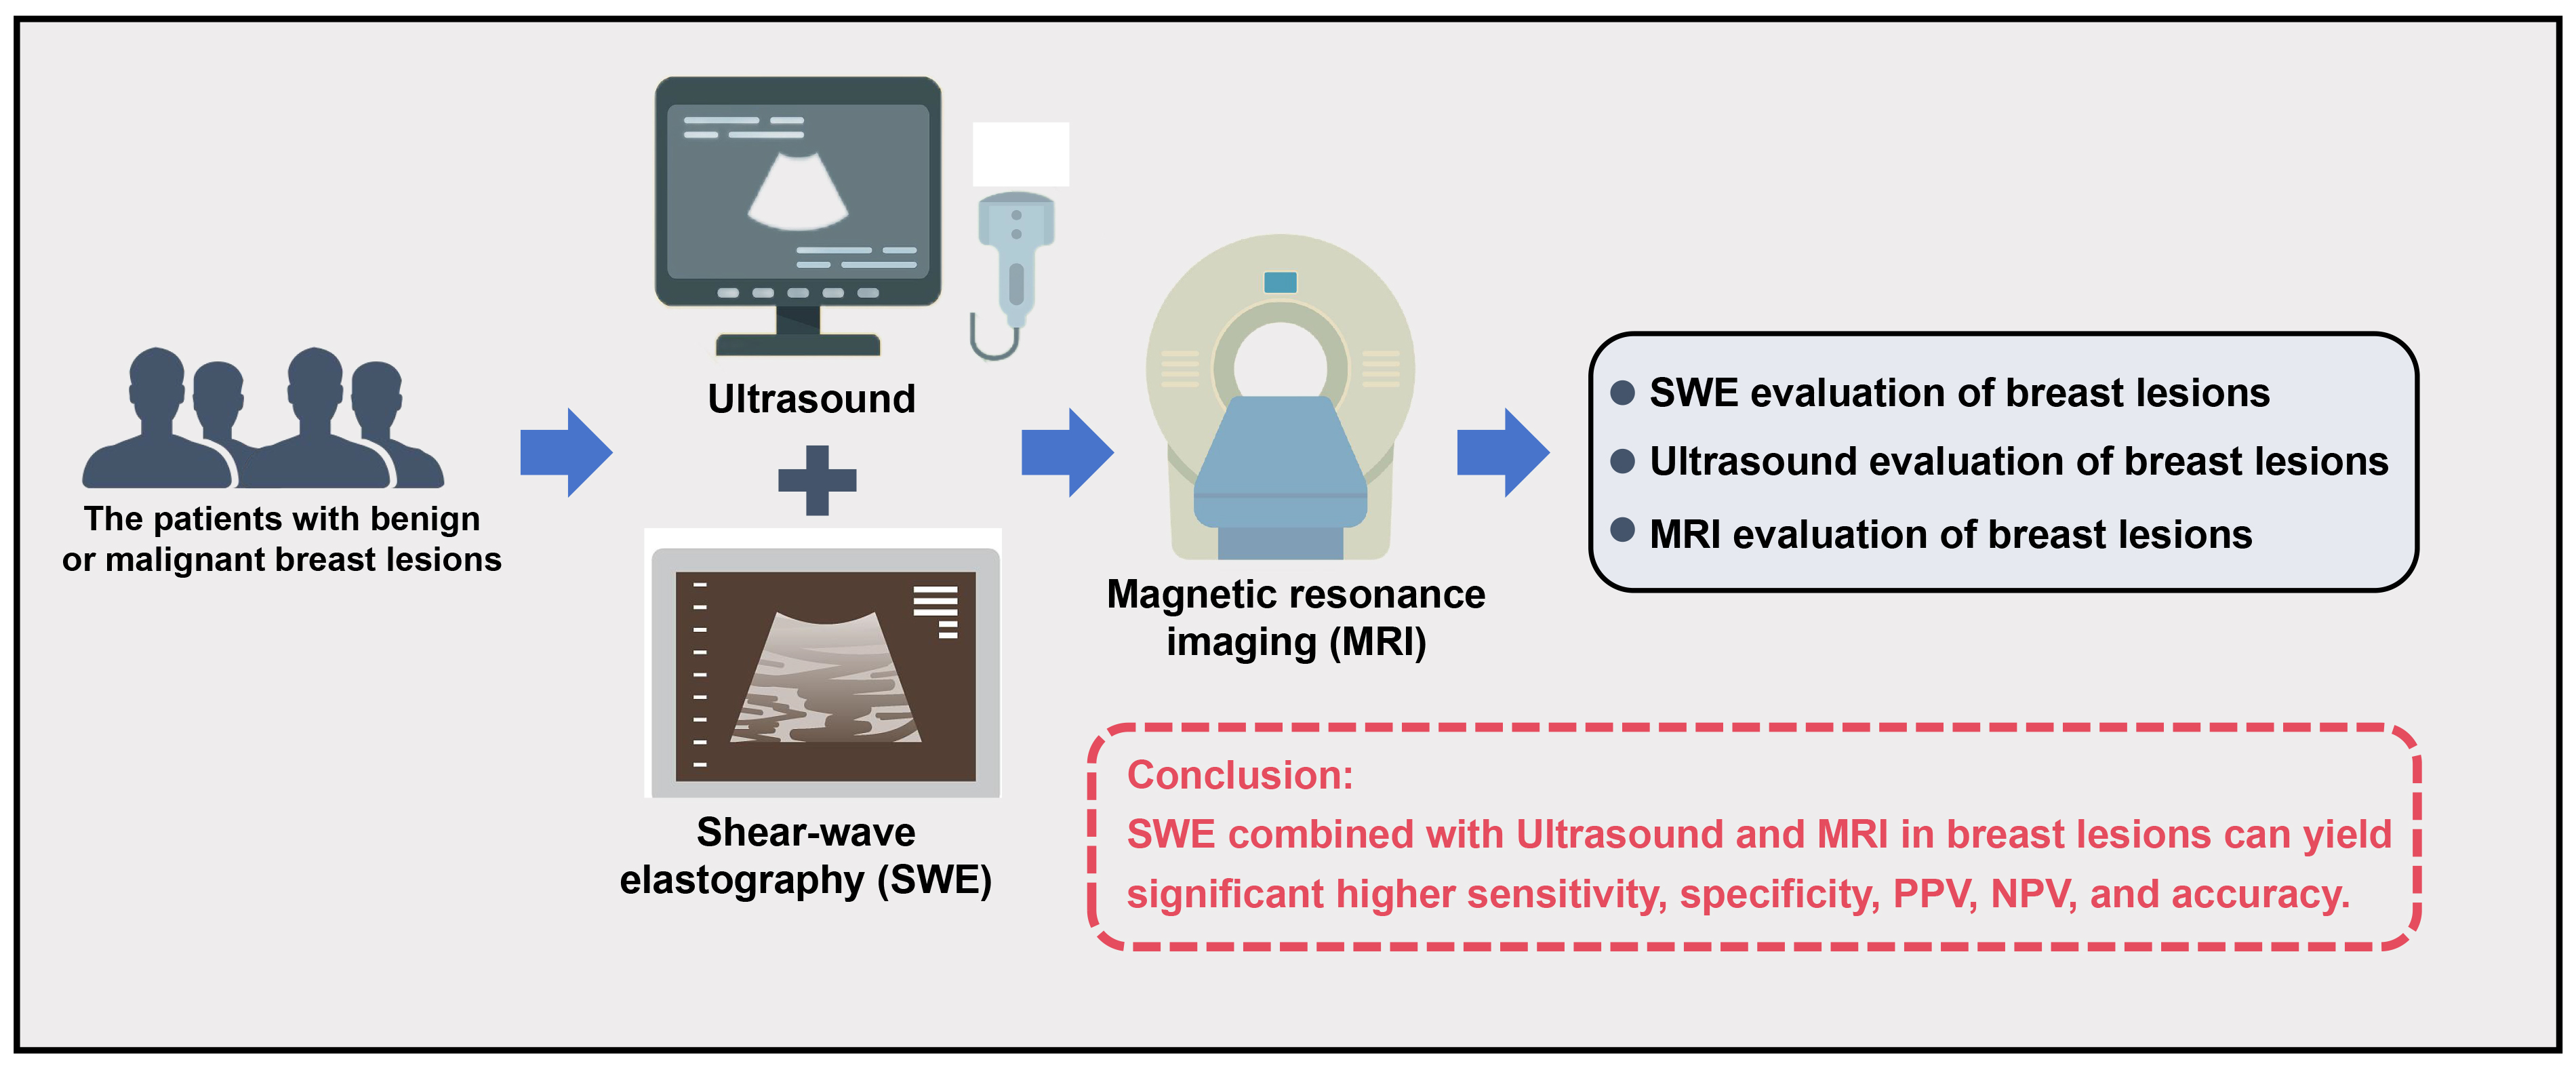
Objectives. This study aimed to assess the diagnostic performance of SWE when combined with conventional ultrasound and magnetic resonance imaging (MRI) in the evaluation of breast lesions.
Material and methods. This retrospective study included patients with breast lesions who underwent SWE, conventional ultrasound and MRI. The diagnostic performance of each modality was evaluated individually and in combination. Histopathological results served as the gold standard for diagnosis. Key performance metrics – sensitivity, specificity, positive predictive value (PPV), negative predictive value (NPV), and overall accuracy – were calculated for each imaging approach.
Results. A total of 99 patients were included in the study, comprising 64 with benign lesions and 35 with malignant lesions. Malignant lesions were generally larger and exhibited distinct imaging characteristics across ultrasound, SWE and MRI. When assessed individually, SWE, ultrasound and MRI showed comparable diagnostic accuracy (64.6%, 62.6% and 62.6%, respectively). However, combining all 3 modalities significantly improved diagnostic performance, yielding sensitivity, specificity, PPV, NPV, and overall accuracy of 94.3%, 89.1%, 82.5%, 96.6%, and 90.9%, respectively (p < 0.001). The area under the curve (AUC) for the combined approach was significantly higher than for any single modality (0.917 vs 0.642, 0.627 and 0.633; p < 0.001).
Conclusions. While SWE alone offers diagnostic performance comparable to that of ultrasound and MRI individually, its greatest value lies in combination with these imaging modalities. Integrating ultrasound, SWE and MRI significantly enhances diagnostic accuracy, sensitivity and specificity, offering a promising multimodal approach for more reliable differentiation between benign and malignant breast lesions.
Key words: breast cancer, magnetic resonance imaging, ultrasonography, shear-wave elastography, breast diseases
Background
Cancer is a disease characterized by the uncontrolled proliferation of abnormal cells within the body. It disrupts the usual regulatory processes that govern cellular growth and proliferation. Among different types of cancers, breast cancer is a prominent cause of cancer-related deaths in women.1 According to GLOBOCAN 2018, there were over 2 million new breast cancer cases, making it the most frequently diagnosed cancer among women in 154 of the 185 countries assessed.2 Its epidemiological spread has not only highlighted disparities in incidence between developed and developing nations, but also brought to the fore the critical role of early diagnosis.3 Early-stage detection, primarily through mammographic screenings, can improve 5-year survival rates to over 90% in developed countries.2, 4 However, in low-income countries, where diagnosis often occurs at more advanced stages, 5-year survival rates can fall below 40%.2, 3, 4 Therefore, early and accurate diagnosis is crucial for improving patient outcomes.
To distinguish between benign and malignant breast disease, traditional imaging modalities such as mammography, ultrasonography and magnetic resonance imaging (MRI) are typically employed.5 The choice of modality depends on the patient’s age and clinical scenario. For example, in patients under 30 years of age presenting with a palpable breast mass, the National Comprehensive Cancer Network (NCCN)6 and the American College of Radiology (ACR) recommend breast ultrasonography as the initial imaging modality.7 When evaluating with ultrasound, the breast imaging-report and data system (BI-RADS) using ACR is commonly used as an assessment tool to assist imaging report interpretation,8 which reportedly has a high sensitivity of 74% and specificity of 84%.9 However, while these traditional methods are effective in initial screening, they have limitations in specificity, often leading to unnecessary biopsies and overtreatment. This limitation calls for the development of more advanced imaging techniques to reduce false positives and improve the diagnostic accuracy of breast cancer detection.
In this context, advanced imaging modalities have emerged as valuable adjuncts to traditional methods. For instance, transmission electron microscopy (TEM) provides high-resolution visualization of cellular ultrastructure, enabling a deeper understanding of cellular components such as the cytoskeleton, membrane systems and organelles. This technique has shown potential in the study of breast cancer, offering insights into the morphology and structural changes at the cellular level.10 Although TEM is more commonly used in research and pathology studies, its ability to identify subcellular features may have diagnostic implications in the future.
Another advanced technique is ultrasound elastography, which builds upon traditional grayscale ultrasound by assessing tissue stiffness. Two primary elastography methods have been explored: static elastography and shear-wave elastography (SWE). Static elastography provides qualitative information about the stiffness, allowing for better differentiation between benign and malignant lesions.11, 12 However, its application is limited due to the similar diagnostic performance as conventional ultrasound and inconsistency among multiple observers.13, 14 In contrast, SWE offers a more advanced and quantitative approach, providing objective measurements of lesion stiffness in kilopascals (kPa).15 Studies have shown that SWE can yield accurate information with regard to benign or malignant differentiation of solid breast masses.15, 16 A recent meta-analysis by Langdon et al. indicated that SWE may be useful in downgrading BI-RADS 4A lesions or upgrading BI-RADS 3 lesions.17 Despite its apparent advantages, SWE has not yet been recommended by current guidelines. This is largely due to several factors, including the lack of standardized diagnostic thresholds for SWE parameters, operator dependency and limited multicenter validation studies. Additionally, the high cost of elastography-capable ultrasound devices poses a significant challenge, especially for resource-limited healthcare settings.5, 18 These barriers hinder the widespread adoption of SWE, even though its diagnostic potential has been demonstrated.
Objectives
There is currently limited research on the combined use of SWE with conventional imaging modalities such as ultrasound and MRI. Our study addresses this gap by exploring the diagnostic potential of this multimodal approach. By leveraging the complementary strengths of these imaging techniques and addressing key barriers, we hope to facilitate the integration of SWE into standardized clinical guidelines, thereby advancing the precision and efficiency of breast cancer diagnosis.
This retrospective study aims to assess the diagnostic efficacy of combining SWE with ultrasound BI-RADS classification and MRI in distinguishing between benign and malignant breast lesions.
Materials and methods
Study design
This was a single-center retrospective study.
Participants
Patients included in this study were individuals with benign or malignant breast lesions who were diagnosed and treated by surgery. All cases were confirmed and classified the lesions into either benign group or malignant group through pathological evidence. The inclusion criteria were: 1) patients who underwent breast SWE, ultrasound and MRI before surgery in Yancheng No. 1 People’s Hospital (The First People’s Hospital of Yancheng), Affiliated Hospital of Medical School, Nanjing University (Nanjing, China); 2) resection of the lesion site in the breast and pathological examination were performed in this hospital; and 3) complete clinical data. The exclusion criteria were: 1) a history of prior breast surgeries or chemoradiation therapy; 2) coexisting malignancies; 3) metastatic diseases; 4) indeterminate pathology findings; 5) breast implant(s); 6) current pregnancy or breastfeeding status; 7) breast lesions exceeding 3 cm; 8) contraindications for MRI; and 9) critical illness.
Variables
Patient demographic and clinical data included: age, body mass index (BMI), family history of cancer, menstrual status, lesion type, lesion size, nodal involvement, lesion location, and histological grade. The single modality evaluation using either SWE, ultrasound or MRI was documented. A combination diagnosis, combining all 3 modalities, was performed using the existing information to comprehensively reassess included lesions. The above examination used the 2013 BI-RADS guidelines issued by the ACR to evaluate the lesions.8 Pathologic diagnoses were used as the gold standard. If the imaging diagnosis matched with pathology, it was then considered a true positive. Otherwise, it was defined as a false positive.
Data measurement
Ultrasonic examination
A senior sonographer performed the exam by using a standard ultrasound scanner (AixPlorer; SuperSonic Imagine, Aix-en-Provence, France). The patient was placed in a supine position with both arms raised to adequately expose the breast area. Starting from the upper outer quadrant, the scanning continued gradually in a clockwise manner from the breast edges towards the nipple. Bilateral breasts were both scanned. Sonographic characteristics recorded included tissue composition, lesion-related parameters (shape, orientation, margin, echo pattern, posterior features), calcifications, associated features (architectural distortion, duct changes, skin changes, edema, vascularity, elasticity assessment), and other features (cysts, lymph nodes, vascular abnormalities, fat necrosis).
Shear-wave elastography
After the standard ultrasound evaluation, the probe was then placed on the skin to locate the lesion again. The level with the largest cross-sectional area was identified and selected, followed by switching to the SWE elasticity imaging mode. The sonographer then instructed the patient to hold their breath for 3 s and capture the image. The quantitative analysis sampling box (Q-box) was placed to cover the entire lesion as much as possible, with no red compression marks on the box outlines. The Q-box was then adjusted to cover the area with high elasticity surrounding the lesion. The areas extending beyond the Q-box were divided into multiple sections and measured individually. The elastic parameters included the maximum elastic modulus (E-max), average elastic modulus (E-mean), elastic standard deviation (E-sd), and lesion-to-fat elastic ratio (E-ratio). The lesion was measured 3 times, and the average was calculated.
Magnetic resonance imaging
Pre-menopausal patients underwent breast MRI using a 3.0T MRI machine (MAGNETOM Skyra; Siemens AG, Erlangen, Germany) during the 7th to 14th day of their menstrual cycle. No time restrictions applied to post-menopausal patients. The patient was placed in a prone position, and the breasts were appropriately positioned using a dedicated 4-channel coil. Non-enhanced studies included continuous axial slices (thickness: 3 mm, distance factor = 0), and T1-weighted images were captured using turbo spin-echo sequences, while T2-weighted fat-saturated images were obtained via short tau inversion recovery sequences. Dynamic contrast-enhanced studies used three-dimensional (3D) T1-weighted gradient-echo sequences with the following parameters: repetition time (TR)/echo time (TE): 4.66/1.68 ms; matrix: 448 × 362; field of view. Gadoteric acid was intravenously injected at a dose of 0.2 mL/kg, followed by a 15 mL saline flush. The post-contrast imaging was repeated 5 times. Image processing included subtraction (obtained by subtracting pre-contrast images from the 5 sets of post-contrast images on a pixel-by-pixel basis), multi-planar reconstruction, maximum intensity projection, and time-intensity curves (TIC). The size, shape, border, intensity, and enhancement on the MRI imaging were documented.
Statistical analyses
Statistical analyses were performed using IBM SPSS v. 21.0 (IBM Corp., Armonk, USA). Continuous variables were expressed as means and standard deviation (SD) if the data were normally distributed. Normality was assessed using the Shapiro–Wilk test for sample sizes between 10 and 50 (n = 35 for the malignant group), and by examining skewness values and Q–Q plots for larger samples (n = 64 for the benign group). Skewness values close to 0 and data points aligning closely along the diagonal in Q–Q plots were considered indicative of normal distribution. For variables that did not meet the normality assumption, data were presented as median (Q1, Q3). Categorical variables were expressed as numbers or proportions (%).
For normally distributed continuous variables, we conducted an independent samples Student’s t-test to compare differences between the 2 groups, with Welch’s correction applied if variances were unequal (assessed with Levene’s test). For non-normally distributed continuous variables, Mann–Whitney U test was used as a nonparametric alternative to compare the 2 groups. For categorical variables, Pearson’s χ2 test was used to assess independence and compare proportions between the groups.
Diagnostic performance metrics, including sensitivity, specificity, positive predictive value (PPV), negative predictive value (NPV), and accuracy, were calculated and reported as descriptive statistics without statistical comparisons. The receiver operating characteristic (ROC) curve was plotted, and the area under the curve (AUC) was calculated to assess diagnostic performance. DeLong’s test, implemented using the roc.test(roc1, roc2, method=”delong”) function in R (R Foundation for Statistical Computing, Vienna, Austria), was conducted to compare AUC values across diagnostic modalities.
For analyses involving multiple comparisons, Bonferroni correction was applied to control for type I error, with adjusted significance thresholds calculated based on the number of comparisons. The significance threshold was adjusted for the number of comparisons made to reduce the risk of false positives. However, for exploratory analyses (e.g., baseline clinical characteristics, evaluation of SWE, ultrasound, and MRI features), no correction for multiple comparisons was applied. Given the exploratory nature of these analyses, the statistical significance was defined as p < 0.05.
Results
Clinical characteristics of included patients
A total of 99 patients were enrolled in this study; 64 had benign lesions, while 35 had malignant diseases, including 5 invasive ductal carcinomas, 7 cases of ductal carcinoma in situ, 5 mucinous carcinomas, 5 invasive lobular carcinomas, 6 solid papillary carcinomas, 3 borderline phyllodes tumors, and 4 advanced lymphomas. As shown in Table 1, there were significant differences in the age of patients with (49.33 ±8.71 vs 53.49 ±6.47; t(97) = −2.47, p = 0.015), BMI (24.39 (22.45, 26.27) vs 25.78 (23.67, 27.69); z = 2.10, p = 0.036) and the lesions size (1.70 cm vs 2.07 cm; t(97) = −4.19, p < 0.001) between the benign group and malignant group. Also, malignant group patients tend to have more family members with a oncologic diagnosis (42.9% vs 20.3%; χ2 = 5.67, degrees of freedom (df) = 1, p = 0.017), higher proportion of menopause status (51.4% vs 29.7%; χ2 = 4.57, df = 1, p = 0.033) and histology grading III (42.9% vs 17.2%; χ2 = 10.72, df = 2, p = 0.005). There was no statistically significant difference in lesion laterality between the benign and malignant groups (χ2 = 3.41, df = 1, p = 0.065) (Table 1).
Shear-wave elastography evaluation of breast lesions
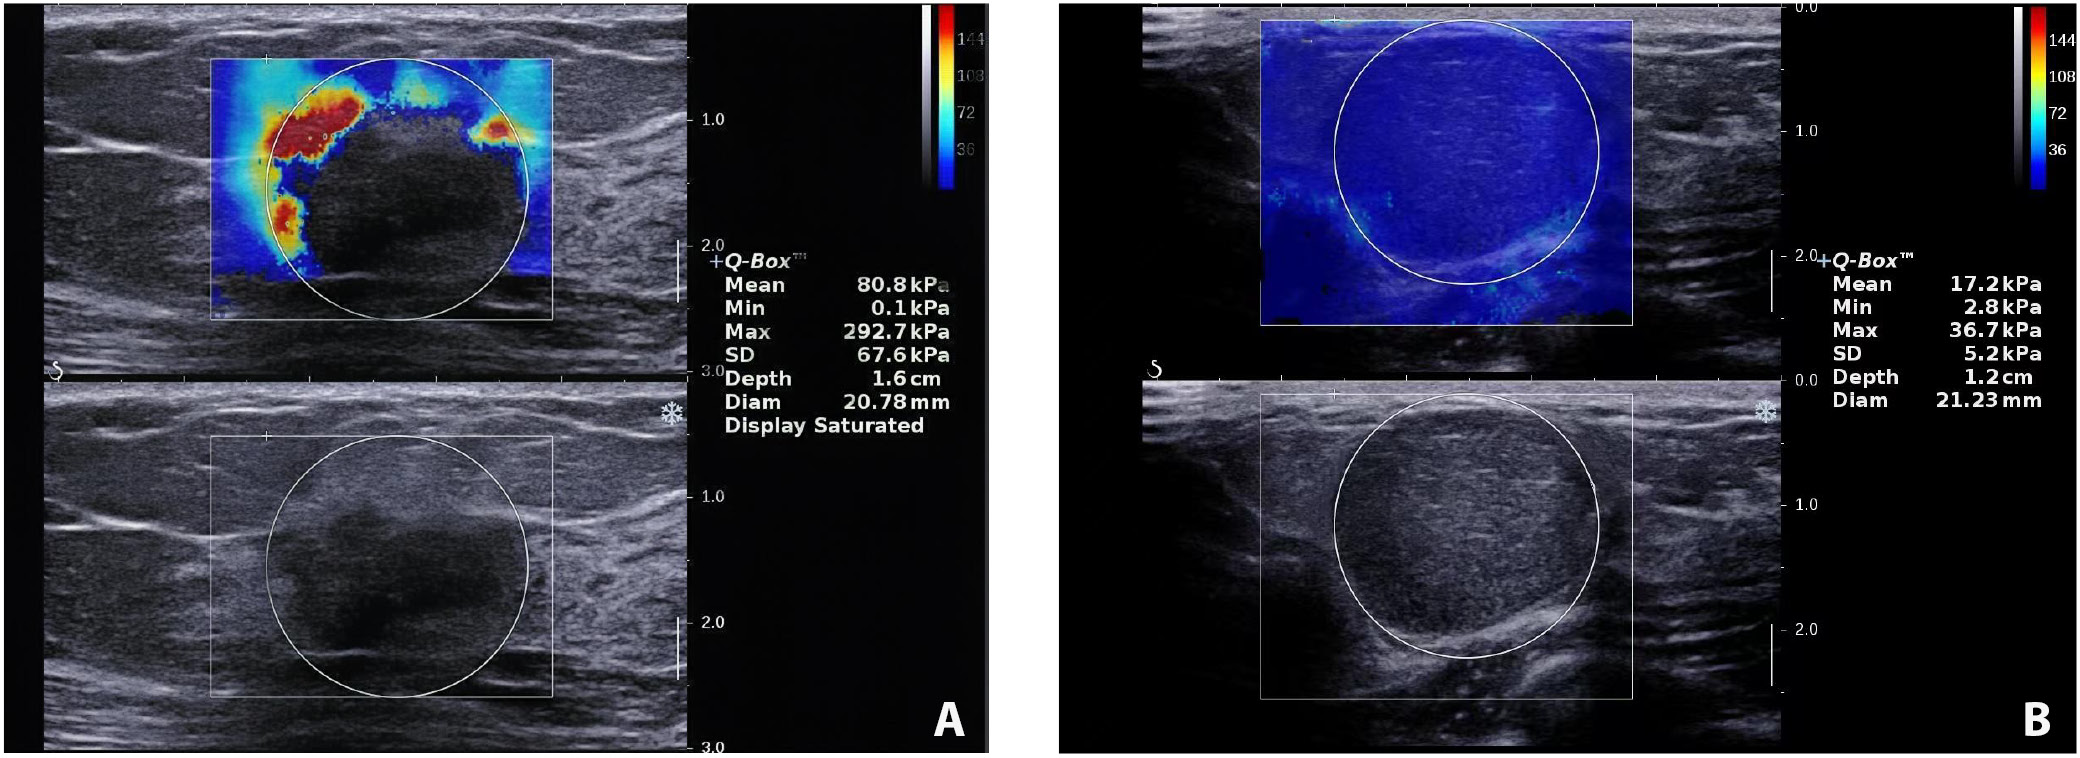
Table 2 summarizes the 4 SWE parameters measured. The malignant group demonstrated higher E-max (151.96 kPa vs 69.65 kPa; t(97) = −9.66, p < 0.001), E-mean (92.30 ±13.05 vs 30.04 ±9.28; t(53) = −24.97, p < 0.001), E-sd (13.09 ±2.45 vs 8.98 ±2.47; t(97) = −7.93, p < 0.001), and E-ratio (14.77 ±3.50 vs 3.39 ±0.80; t(35) = −18.99, p < 0.001) compared to the benign group (Table 2). Representative SWE images from the malignant and benign groups are presented in Figure 1.
Ultrasound evaluation of breast lesions
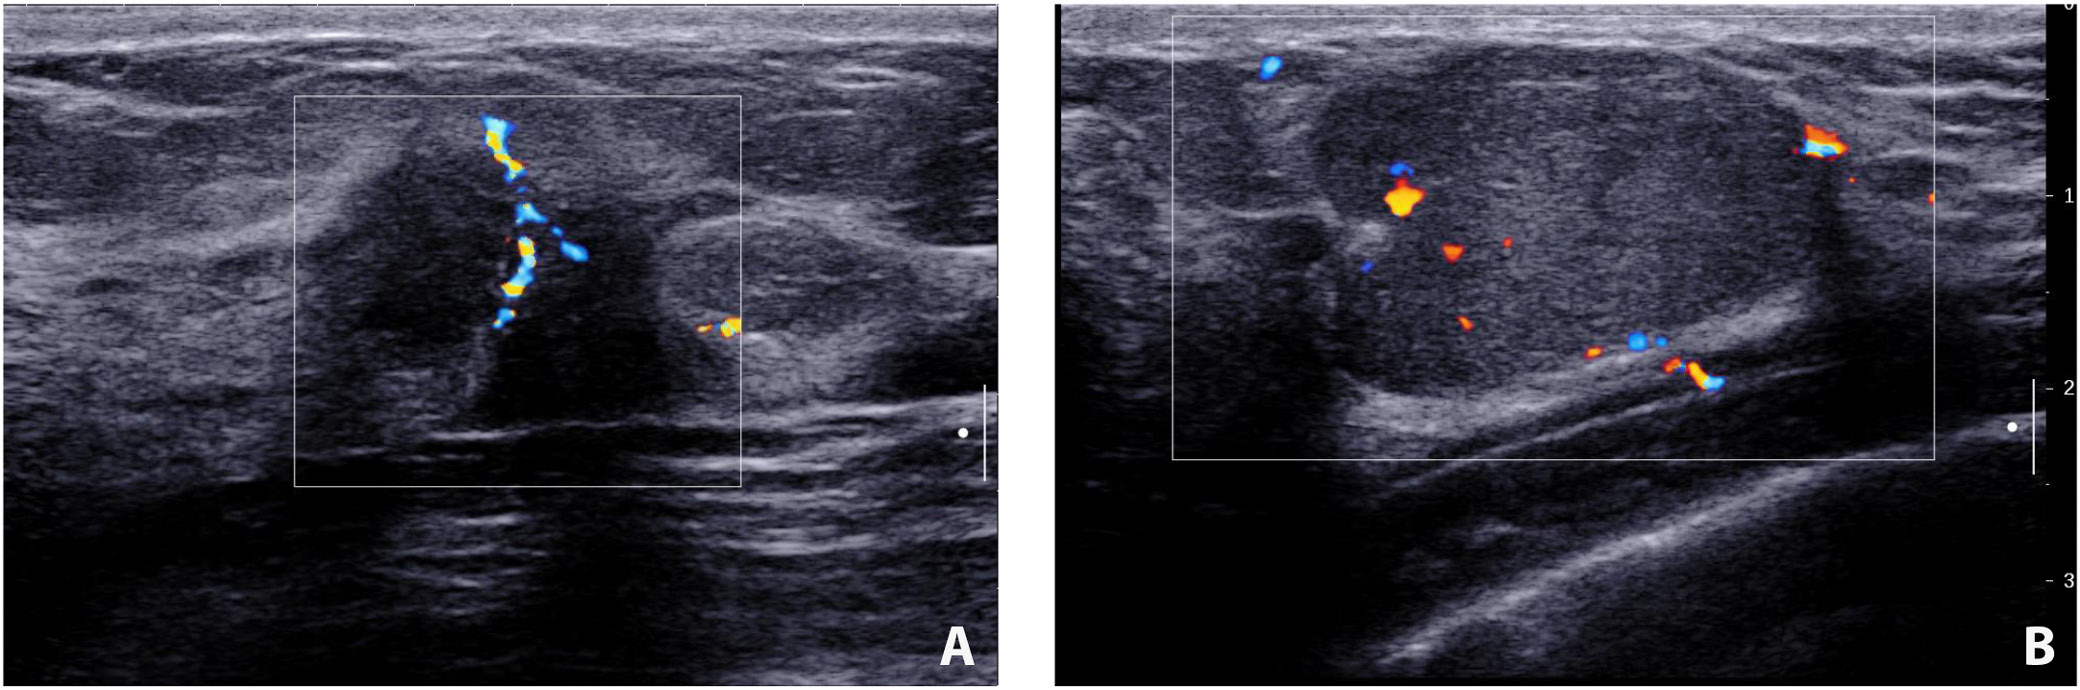
The incidence of discovering a mass in the malignant cohort was higher than that in the benign group (37.1% vs 14.1%; χ2 = 6.97, df = 1, p = 0.008). It is also more likely to detect heterogeneous echogenicity in malignant lesions (45.7% vs 15.6%; χ2 = 10.58, df = 1, p = 0.001). Benign lesions tended to have well-defined borders (χ2 = 19.92, df = 1, p < 0.001) and regular shapes (χ2 = 11.25, df = 1, p = 0.001). Calcifications were more frequently detected in patients with malignant diseases (χ2 = 6.24, df = 1, p = 0.013). There was a higher proportion of malignant lesions showing posterior attenuation (42.9% vs 21.9%; χ2 = 4.81, df = 1, p = 0.028). Benign lesions were less likely to be associated with abnormal axillary node findings (76.6% vs 34.3%; χ2 = 17.01, df = 1, p < 0.001) (Table 3). The typical ultrasound images from the malignant and benign groups are shown in Figure 2.
Magnetic resonance imaging evaluation of breast lesions
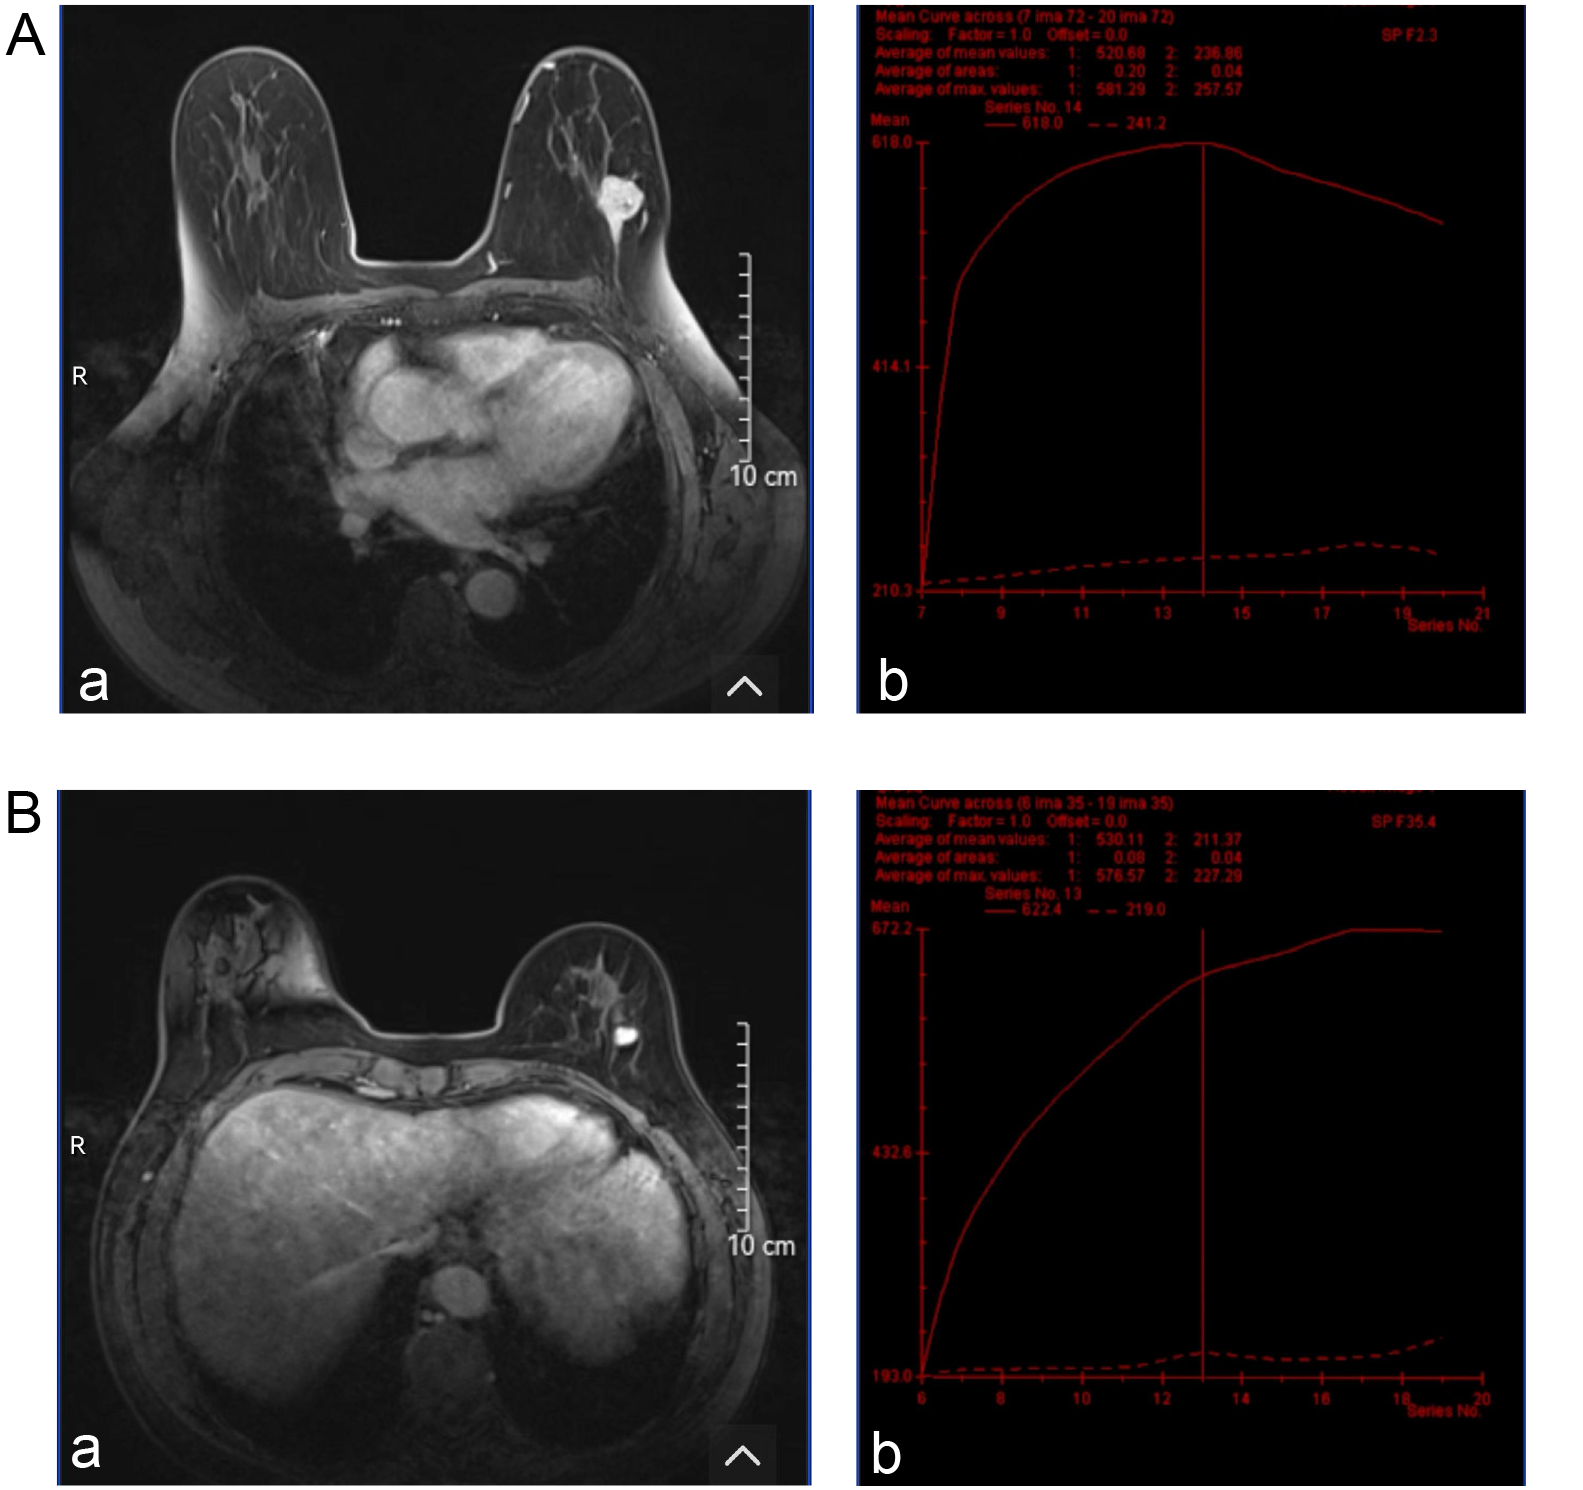
The shape and border differences of lesions evaluated with MRI were similar to the ultrasound features. More irregular shapes were found in malignant group compared to patients with the benign group (48.6% vs 23.4%; χ2 = 6.53, df = 1, p = 0.011) and more lesions with poor-defined borders were identified (51.4% vs 26.6%; χ2 = 6.12, df = 1, p = 0.013). The benign group demonstrated more homogeneous enhancement, whereas the malignant group showed greater heterogeneity (χ2 = 14.74, df = 1, p < 0.001). The average apparent diffusion coefficient (ADC) was 1.18 (0.95, 1.34) in the malignant group, which was higher than 0.80 (0.65, 0.91) in the benign group (z = 6.14, p < 0.001). Type III time-intensity curves (TICs) were more frequently observed in the malignant group compared to the benign group (51.4% vs 25%). Conversely, type I and type II TICs were more commonly seen in the benign group (42.2% vs 17.1% and 32.8% vs 31.4%, respectively). The differences were statistically significant (χ2 = 8.87, df = 2, p = 0.012) (Table 4). The typical MRI images and TIC from the malignant and benign groups are shown in Figure 3.
Diagnostic value evaluation
Pathologic diagnosis was used as the gold standard. When evaluating the lesions using individual modality, SWE detected 22 true positive cases and 42 true negative cases. Similarly, ultrasound was also able to detect 22 true positive cases and 40 true negative cases. As for MRI, it had more false negative cases and fewer true negative cases (Table 5). When all 3 modalities were combined, the diagnostic approach most closely matched the pathological results, identifying 33 true positive cases and 57 true negative cases. It also yielded the lowest false positive and false negative cases (Table 5).
Magnetic resonance imaging demonstrated the highest sensitivity for detecting malignancies (65.7%), while SWE had the highest specificity (65.6%) and the highest positive predictive value (PPV; 50.0%). Magnetic resonance imaging also showed a strong negative predictive value (NPV; 76.5%). The diagnostic accuracy of SWE, ultrasound and MRI was comparable, with SWE having the highest accuracy (64.6%). When combining all 3 modalities, the diagnostic performance improved substantially, with sensitivity increasing to 94.3% and specificity reaching 89.1%. The combination also yielded the highest PPV (82.5%) and NPV (96.6%), resulting in an overall accuracy of 90.9% (Table 6).
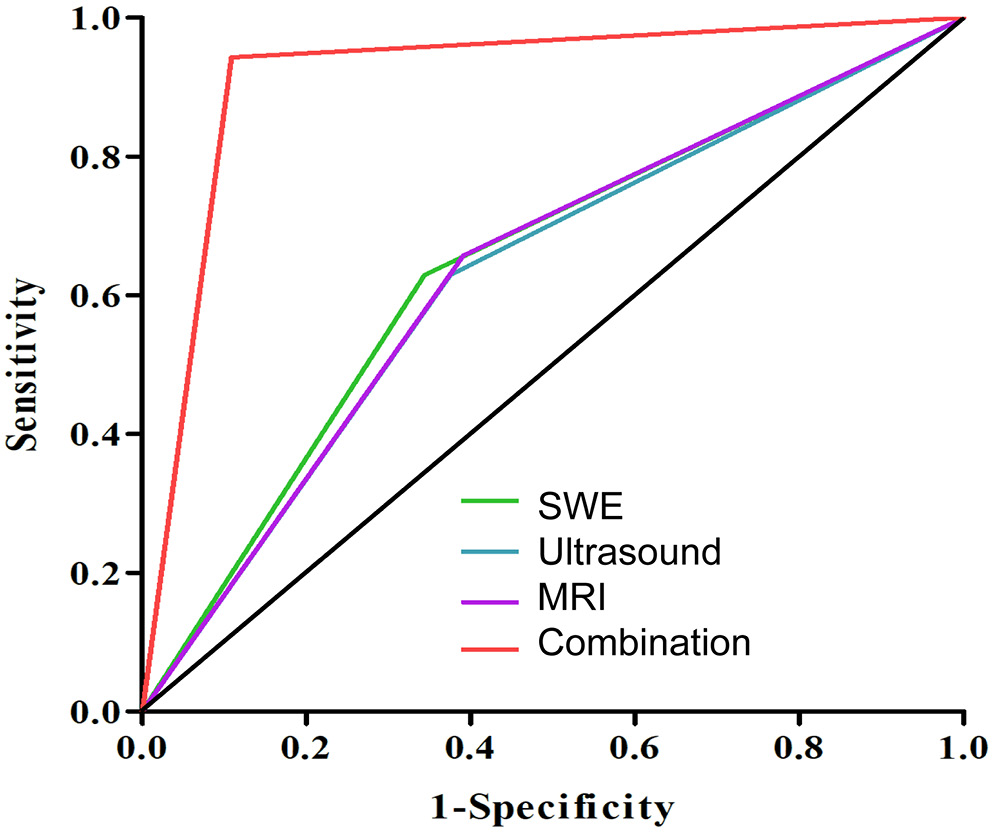
Figure 4 demonstrates the ROC of each modality as well as the combination of 3 techniques. The AUC values were as follows: SWE (0.642), ultrasound (0.627), MRI (0.633), and the combination of all 3 modalities (0.917). Pairwise comparisons using DeLong’s test showed that the AUC for the combined modalities was significantly higher than those for individual modality (padjusted < 0.001). However, no significant differences were observed between SWE, ultrasound and MRI (padjusted > 0.05 for all comparisons) (Table 7).
Discussion
Early diagnosis of breast cancer is critical for determining appropriate management strategies and improving patient outcomes; however, current screening and diagnostic modalities still require further refinement. Although SWE can enhance diagnostic efficacy when used alongside ultrasound,17, 19 it has not yet been incorporated into the BI-RADS system. Interestingly, the combined use of all 3 commonly employed modalities for diagnostic assistance has only rarely been explored. Our study identified that using SWE alone did not yield significant diagnostic benefit, but combining it with ultrasound and MRI showed the sensitivity of 94.3% and the specificity 89.1%, which was significantly higher than single modality evaluation. Our results suggest the potential and value of combining 3 different imaging modalities to enhance diagnostic accuracy, warranting further investigation.
Our results from the ultrasound evaluations underscore the salient differences between benign and malignant breast lesions. Previous literature highlights similar distinctions. The higher frequency of mass presentation in malignant lesions compared to benign ones (37.1% vs 14.1%) aligns with findings by Berg et al.,20 who emphasized that malignant masses are more prominently visualized on ultrasound. This observation of a higher proportion of cases with heterogeneity, calcifications and posterior attenuation in malignant lesions also matches the previous findings.21, 22, 23 Lastly, the markedly higher association of malignant lesions with abnormal axillary lymph node findings compared to benign lesions (65.7% vs 23.4%) reinforces the diagnostic importance of nodal assessment in breast imaging, as highlighted by Lee et al.24 In our study, we found the sensitivity, specificity, PPV, NPV, and AUC of ultrasonography to be 62.9%, 62.5%, 47.8%, 75.5%, and 0.627 respectively. The average diagnostic efficacy was lower than reported in studies,11, 25, 26 which could be due to geographic location and small samples in this study.
Magnetic resonance imaging evaluations of breast lesions presented in our study align with some of our ultrasound results, emphasizing the differences between benign and malignant lesions. Malignant lesions consistently exhibited irregular shapes (48.6% vs 23.4%, p = 0.011), poorly defined borders (51.4% vs 26.6%, p = 0.013) and heterogeneous enhancement patterns, consistent with findings in the literature.27, 28, 29 Notably, the higher average ADC values in malignant lesions (1.18 vs 0.80, p < 0.001) reaffirm their diagnostic significance.30 The distribution of TIC types further differentiated the lesions, with type III being predominant in malignancies, aligning with prior studies.31, 32 Meanwhile, MRI, recognized for its superior soft tissue contrast, demonstrated a sensitivity of 65.7%, specificity of 60.9% and an AUC of 0.633 in our study – values that are lower than those reported in previous literature.33, 34 This discrepancy may be attributed to our relatively small sample size and the inclusion of a substantial number of benign cases, suggesting that despite the lower performance in this study, MRI retains significant diagnostic value in detecting malignant breast lesions.
The SWE evaluation in our cohorts demonstrated that the elastic parameters (E-max, E-mean, E-sd, and E-ratio) in the malignant lesions were all significantly higher than those in benign diseases. Our results are consistent with the findings by Schaefer et al. that significantly higher elasticity in malignant lesions was observed.11 Though the exact mechanism of the “stiffness” of malignant lesions is unknown, several possibilities have been proposed. Wang’s team evaluated the extracellular matrix (ECM) components in benign and malignant breast lesions and found a higher concentration of collagen and elastic fibers in the ECM of cancerous tissues. These findings suggest that alterations in ECM composition may contribute to the increased stiffness observed on ultrasound elastography.35 Xue et al. conducted a more in-depth molecular investigation and found that hypoxia-inducible factor 1-alpha (HIF-1α), in conjunction with Kindlin-2, plays a role in promoting collagen formation in breast cancer tissues.36, 37 Other possible mechanism might involve more intense immune response around cancer cells or rapid growth of cancer cells, which all remains to be proven by more research.
Although the diagnostic potential of SWE is well recognized, its integration into clinical guidelines has been delayed due to several limitations. Key barriers to implementation include operator dependency, variability in cutoff thresholds, limited equipment availability, and the high cost of elastography devices. These factors continue to hinder the adoption of SWE into standardized diagnostic protocols.5, 18 Addressing these barriers, such as through the standardization of diagnostic thresholds and increased availability of training programs for healthcare professionals, may help facilitate its adoption in clinical practice. Nevertheless, our study demonstrated that using SWE alone yielded a sensitivity of 62.9%, specificity of 62.5%, PPV of 50%, NPV of 76.4%, and an AUC of 0.642. These findings align with those reported by Evans et al.,38 who observed that while SWE and greyscale BI-RADS had comparable diagnostic performance individually, their combination significantly improved sensitivity – reaching 100% for malignancy detection. Shi et al. also evaluated the combined use of SWE and greyscale ultrasound in 251 patients and reported similarly improved diagnostic performance, with a sensitivity of 96.7% and an accuracy of 93.8%.19 Shear-wave elastography has rarely been combined with MRI, as both are typically employed as independent imaging modalities for lesion assessment. The study by Plecha et al. demonstrated that using SWE-based second-look ultrasound following MRI can improve the detection rate of breast cancers.39 In our study, we integrated all 3 imaging modalities – ultrasound, SWE and MRI – for the initial assessment and found that this comprehensive approach significantly enhanced diagnostic performance, achieving a sensitivity of 94.3%, specificity of 89.1%, PPV of 82.5%, NPV of 96.6%, and an AUC of 0.917. There were limited studies available for direct comparison; however, our results demonstrated a relatively favorable diagnostic performance when SWE was added to ultrasound alone.17, 19, 40 Although the diagnostic accuracy of SWE in our study appeared lower than that reported in previous studies,17 this discrepancy may be attributed to our relatively small sample size and potential inconsistencies in the application of the SWE technique. Additionally, our combination results highlighted the emerging need to investigate and evaluate the multimodal approach for early breast cancer diagnosis.
Besides the diagnostic value of SWE, its capability to be integrated in breast cancer prognosis prediction has also been investigated. Higher E-ratio has been reported to be associated with negative hormonal receptor expression and positive p53 and Ki-67.41 Chang et al. studied 337 patients with invasive breast cancer and found that elevated elastic parameters were significantly associated with more aggressive tumor subtypes.42 Another research group reported similar findings and additionally observed that high tissue elasticity was associated with nodal metastases.43 Furthermore, a growing body of evidence supports the use of SWE in predicting responses to neoadjuvant chemotherapy.25, 44, 45 While these aspects were beyond the scope of our study, the encouraging results underscore the prognostic potential of SWE and its possible role in informing future treatment strategies for patients with breast cancer.
Limitations
Our study has several limitations. First, this is a single-center retrospective study, and our sample size is relatively small. Second, the inter-observer reliability of SWE is not consistent;46 thus, the interpretation and techniques performed may not be completely standard. Third, since mammography is not frequently used as an initial assessment modality in China, we did not include it in our study, which might limit the generality of our findings to countries that place more emphasis on screening mammography. Moreover, although the Bonferroni correction was applied to some hypotheses to control for type I error, it was not consistently applied across all comparisons, thereby increasing the risk of false positives – particularly in exploratory analyses. This limitation should be considered when interpreting the results. Future research should implement more rigorous adjustments for multiple comparisons to reduce the risk of type I error.
Conclusions
Shear-wave elastography exhibits similar diagnostic performance as ultrasound and MRI when used as single modality. However, when combining all 3 together, it can yield significantly higher sensitivity, specificity, PPV, NPV, and accuracy. Future studies should focus on how to integrate SWE into BI-RADS system for more accurate detection for malignancies.
Data availability
The datasets generated and/or analyzed during the current study are available from the corresponding author on reasonable request.
Consent for publication
Not applicable.
Use of AI and AI-assisted technologies
Not applicable.