Abstract
Background. Hyperlipidemia is a major risk factor for cardiovascular diseases and is associated with complications such as atherosclerosis and tendon injury. Though atorvastatin reduces cholesterol, genetic variants (CYP2D6-4, SULT1A1, CYP2C192) affect its response. These genetic variations influence atorvastatin metabolism, thereby affecting its therapeutic effectiveness.
Objectives. To advance personalized therapeutic drug monitoring and improve lipid profile management, this study aims to develop a robust and LC-MS/MS method for quantifying atorvastatin levels in human plasma. Additionally, to investigate the influence of genetic polymorphisms – particularly CYP2D6-4–on plasma concentrations of atorvastatin in patients with hyperlipidemia.
Materials and methods. Ethical approval for the study was obtained from the appropriate institutional review boards, and written informed consent was obtained from all participants. Atorvastatin was measured using LC-MS/MS. PCR-based methods were used for genotyping. Statistical analyses were performed to evaluate relationships between plasma atorvastatin levels and genetic variants.
Results. The LC-MS/MS method demonstrated excellent linearity, accuracy, precision, and stability, for the quantification of atorvastatin in human plasma. Higher atorvastatin concentrations were tied to CYP2D6-4. Furthermore, the study validated the analytical method for consistent and reliable measurement of atorvastatin levels in clinical samples.
Conclusions. This study successfully developed and validated a straightforward and reliable LC-MS/MS method for quantifying atorvastatin levels in human plasma. Significant CYP2D64 – atorvastatin links highlight the value of pharmacogenetic dosing. Integrating pharmacogenetics – especially in the Jordanian population – may enhance the safety, efficacy, and individualization of atorvastatin therapy.
Key words: genotype, polymorphism, atorvastatin, hyperlipidemia, statins
Background
Hyperlipidemia is a condition where blood lipid concentrations exceed normal limits, leading to severe complications like vascular stenosis, atherosclerosis, and heart diseases.1 It is a significant risk factor for cardiovascular diseases and deaths worldwide, with cardiovascular diseases responsible for 20.5 million deaths in 2021, approx. 80% occurring in low- and middle-income countries.2
Hyperlipidemia, a condition causing high mortality and morbidity rates, is triggered by elevated lipid levels in the vascular endothelium. This leads to inflammation, lipid aggregation, foam cell formation, cell death, mitochondrial dysfunction, and fibrotic plaques.3 Plaque lipids cause cardiovascular diseases, tendon failure, and tendon failure, particularly in the patellar tendon. Over time, hyperlipidemia increases macrophages in tendon tissues, replacing collagen fiber damage with lipids, resulting in less efficient tendons.4
Atorvastatin is a statin used for lipid control. It lowers blood cholesterol and triglyceride levels and reduces the risk of cardiac diseases in patients with normal cholesterol levels.5
Atorvastatin is an orally administered medication with a low bioavailability of 14% due to its high first-pass metabolism. It binds extensively to plasma proteins and is metabolized to its active metabolites via CYP450 3A4. Its plasma elimination half-life is around 14 h.6
Several necessary enzymes are involved in the metabolism of atorvastatin, including CYP2D6-4, SULT1A1, and CYP2C19-2. Many medications, including statins, are metabolized oxidatively by CYP2D6-4. Individual differences in medication toxicity and efficacy can result from variations in CYP2D6 gene variants, which can profoundly impact drug metabolism rates. In the case of atorvastatin, the CYP2D6-4 polymorphism is associated with higher plasma concentrations, suggesting that individuals with this genetic variant may require lower doses of the drug for the same therapeutic effect. Drugs and endogenous compounds are subject to sulfonation and elimination, which can affect their bioavailability and activity. SULT1A1 mediates this process. Variations in SULT1A1 polymorphisms may result in distinct drug responses. Another enzyme involved in drug metabolism is CYP2C19-2. Variations in this enzyme’s polymorphism can change enzyme activity, impacting drug concentration and treatment results.
Due to the distinct genetic makeup of this population, which may display different frequencies of CYP2D6-4, SULT1A1, and CYP2C19-2 polymorphisms, this study focuses on Jordanian patients. Comprehending these genetic variances is essential to creating customized medicine strategies for the Jordanian population. This study’s findings could pave the way for a more personalized approach to hyperlipidemia treatment, where medication dosages and types are tailored to an individual’s genetic profile. Moreover, cardiovascular illnesses constitute a significant cause of morbidity and death in Jordan, so it is critical to optimize hyperlipidemia treatment approaches in this population.
Objectives
The study aims to develop a simple LC-MS/MS method for determining atorvastatin concentration in human plasma and investigating genetic polymorphisms that affect the response to atorvastatin. The objectives include correlating plasma atorvastatin levels with liver enzymes, examining the relationship between atorvastatin concentration and clinical lipid profile parameters, and assessing the impact of daily dose intake on plasma concentration. Additionally, the study explores drug–drug interactions influencing atorvastatin levels, as well as the influence of demographic factors and patient genotypes on atorvastatin concentration. Finally, the study aims to identify the highest and lowest atorvastatin concentration values and their associations.
Materials and methods
The study employed a robust analytical cross-sectional pragmatic multidisciplinary approach to achieve its objectives, integrating laboratory preparation for genetic analysis, precise quantification of atorvastatin concentrations, comprehensive clinical data collection from patients, and rigorous statistical analysis to synthesize the findings.
Settings and ethical approval and individual consent
Between March 2022 and August 2024, samples were collected, analyzed, and systematically managed in Jordan. The present study was conducted in accordance with the Declaration of Helsinki and complied with the principles of Good Clinical Practice (GCP) and Good Laboratory Practice (GLP). Ethical approvals for this study were obtained from the Institutional Review Board (IRB) of Prince Hamza Hospital, the Jordanian Ministry of Health, and Hashemite University in Zarqa, Jordan (approval reference numbers 8/3/2021/2022 and MH-14/3/2022, respectively). At Prince Hamza Hospital, separate informed consent forms were provided to each participant. All procedures and interventions were carried out in accordance with the guidelines of the Jordanian Ministry of Health. Data were anonymized and securely stored in compliance with applicable data protection regulations, and patient confidentiality was strictly maintained.
Participants recruitment
The study included patients aged 20–80 years diagnosed with hyperlipidemia and regularly using atorvastatin (ATC code: C10AA05), with complete electronic medical records detailing anthropometric measurements, atorvastatin dosage, and lipid profiles. Exclusion criteria comprised patients using other statin agents, those with incomplete medical records, individuals with secondary hyperlipidemia (e.g., uncontrolled hypothyroidism or nephrotic syndrome), severe comorbidities (e.g., advanced liver disease or malignancies), and non-consenting patients. Only individuals who met the inclusion criteria and provided written informed consent were enrolled in the study.
Variables and measures for LC-MS/MS analysis
Method validation
The European Medicines Agency (EMA) 2012 bioanalytical method validation guidelines7 stipulated stringent validation procedures for this study’s LC-MS/MS analysis method. To avoid bias and guarantee the analytical method’s dependability and resilience, validation included thorough evaluations of linearity, accuracy, precision, and stability.
Individuals’ plasma sample preparation for analysis
The plasma samples from the individuals were treated the same way as the validation samples before LC-MS/MS analysis. Strict adherence to established protocols was observed during these preparations to minimize analytical variability and preserve sample integrity. The analytical results were more dependable and consistent because standardized sample handling techniques ensured uniformity across all sample preparations.
Variables and measures for genotyping
DNA extraction method
Genomic DNA was extracted from biological samples using the Blood DNA Preparation Column Kit (Jena Bioscience, Jena, Germany). A few minor modifications were made to the manufacturer’s suggested protocols to maximize the efficiency of DNA extraction, guaranteeing strong and dependable isolation of high-quality DNA appropriate for further genotyping analyses.
Amplification using polymerase chain reaction
Polymerase chain reaction was used to ramp up the desired genes using the Labnet® PCR System TC6000-G-230V (PCR) (Labnet, international, Edison, USA).o guarantee targeted and effective amplification of the intended genetic loci, PCR reactions were carefully prepared, and amplification conditions were optimized. To verify the accuracy and precision of the amplification procedure, PCR amplification was applied to every DNA sample in conjunction with suitable controls. A mixture with a total volume of 20 μL was created for every DNA sample except the negative samples.
Polymerase chain reaction-restriction fragment length polymorphism
The previously amplified DNA fragments were digested using polymerase chain reaction-restriction fragment length polymorphism (PCR-RFLP). The PCR reaction products were further incubated in the appropriate reaction buffer supplied by the manufacturer using a 25 μL reaction mixture that contained 0.5 μL units of CutSmart HaeII for the SULTA1 gene and 0.5 μL units of BstN1 for all the CYPs genes. To facilitate enzyme digestion, the mixture for SULT1A1 was incubated at 37°C for 20 min. After that, the heat was inactivated for 20 min at 80°C. The CYPs were incubated at 60°C for 15 min.
Statistical analyses
The sample size calculation was primarily based on the prevalence of CYP2C19 genotype in the Jordanian population, which has been documented at 0.3. Based on this prevalence rate, 2 sample size scenarios were calculated: 1) A minimum of 50 patients would be required to detect a 0.25 difference in atorvastatin concentrations; 2) To detect a smaller difference of 0.2, a sample size of 74 patients would be necessary. Both calculations were anchored to the established CYP2C19 prevalence of 0.3.
Accuracy and completeness were guaranteed by the electronic collection of patient data and associated variables using Microsoft Excel. IBM SPSS for Windows v. 25 was used to code and import the data for statistical analysis (SPSS Inc., Chicago, USA). To reduce errors, bias, and guarantee data integrity, strict quality control procedures were implemented at every stage of the data collection.
The statistical analysis encompassed multiple complementary approaches to ensure robust data interpretation. Descriptive statistics were applied, with categorical variables reported as frequencies and percentages, and continuous variables presented as medians with ranges due to non-normal distribution. Two non-parametric tests were used in this study: The Kruskal–Wallis test and the Mann–Whitney U test, selected based on the results of the Shapiro–Wilk test, which indicated a violation of the normality assumption for atorvastatin concentrations. The Kruskal–Wallis test was used to compare atorvastatin concentrations across 3 independent dose groups (10 mg/day, 20 mg/day and 40 mg/day), followed by post hoc pairwise comparisons using Dunn’s procedure with Bonferroni correction to identify specific group differences. To compare atorvastatin concentrations between patients with and without a specific genotype, the Mann–Whitney U test was applied, stratified by daily dose to control for dosing effects. The interaction effects between genotype and dose were not examined, as this was not an objective of the study. Given that Allel/genotype is a naturally occurring, non-manipulated variable, our analysis focused on evaluating atorvastatin concentrations separately by genotype and dose level, rather than exploring potential interactions between these independent variables. A p < 0.05 was considered statistically significant for all tests.
Results
Demographic data
Data were collected from a total of 90 patients. The participants’ characteristics are summarized in Table 1. The cohort included 41 women (45.6%) and 49 men (54.4%), with an age range of 42 to 81 years. The majority of participants were classified as overweight or having obesity class I (66.6%). Most individuals were non-smokers, and coffee consumption was more frequently reported than tea consumption.
Patient polypharmacy profile
On average, patients were taking 6 medications, with some reporting the use of up to 14. Details on polypharmacy and supplement intake are presented in the accompanying dataset. The most commonly used medications were metformin (64.4%) and aspirin (57.8%), while vitamin D (cholecalciferol, 50,000 IU) was the most frequently reported supplement, used by 37.8% of participants.
Genotyping
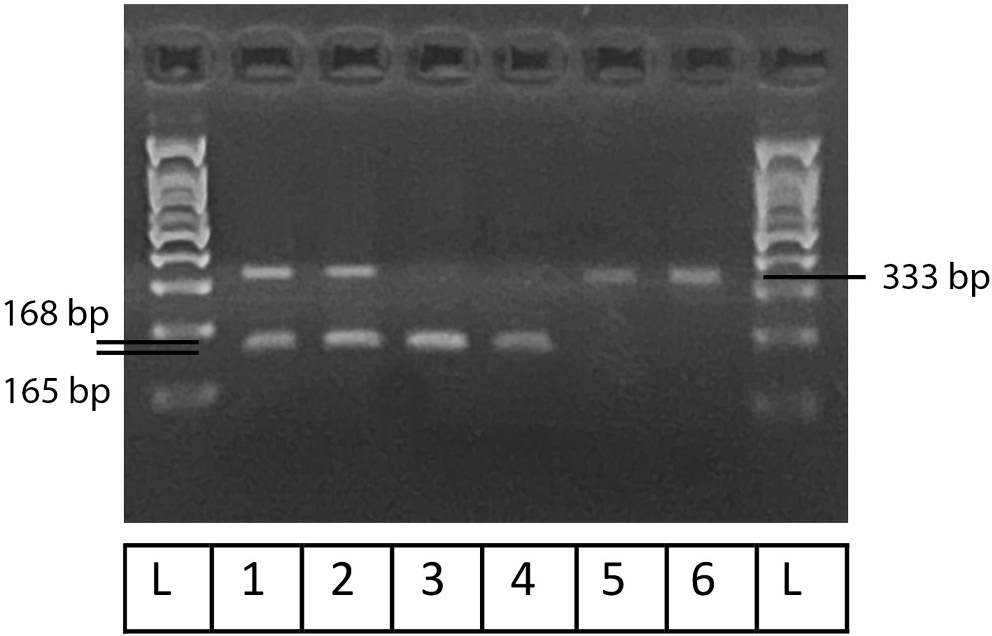
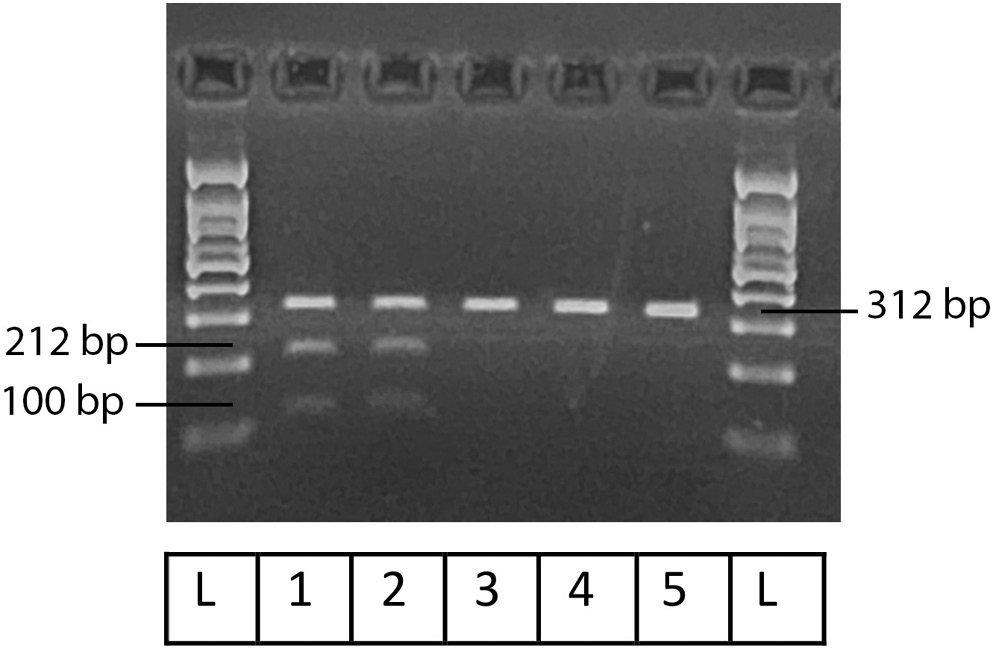
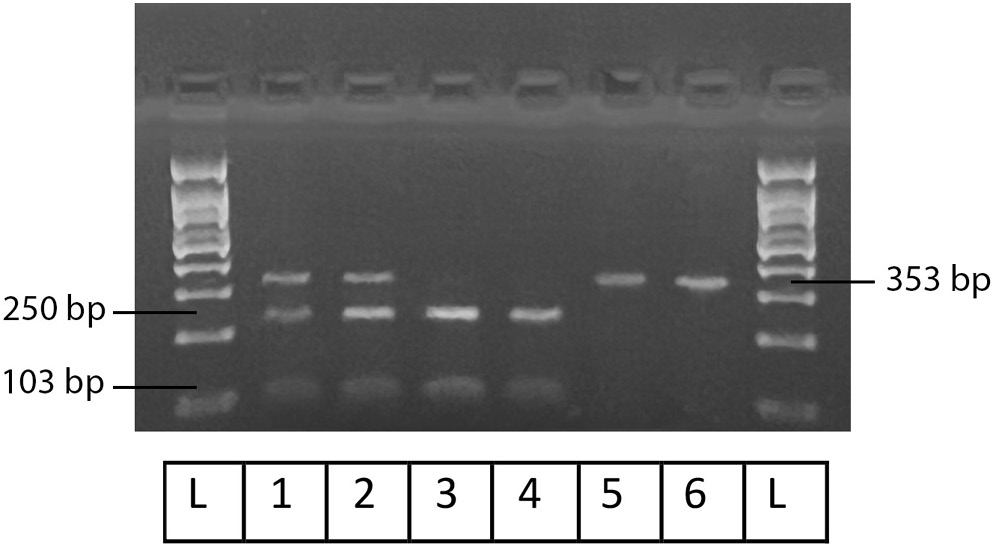
Figure 1, Figure 2, Figure 3 illustrate the results obtained using Gel-Imaging analysis with a 3% (w/v) agarose gel stained with ethidium bromide, alongside a 100 bp DNA ladder for fragment size reference. As summarized in Table 2, more than half of the recruited patients were homozygous mutants for SULT1A1 (55.6%). In contrast, the majority of patients were homozygous wild-type for CYP2C19-2 (76.6%) and CYP2D6-4 (73.3%).
Dose-dependent variations in atorvastatin concentration
Patients were divided into 3 dosage groups: 10 mg (12.2%), 20 mg (67.8%), and 40 mg (20%). The Kruskal–Wallis test revealed significant differences in atorvastatin concentrations across these groups (p = 0.003): 10 mg (n = 11, median = 0.1 ng/mL, range: 0.028–1.35), 20 mg (n = 61, median = 3.6 ng/mL, range: 0.54–6.0), and 40 mg (n = 18, median = 2.7 ng/mL, range: 0.38–5.29). Pairwise comparisons using Dunn’s procedure with Bonferroni correction showed a significant difference between the 10 mg and 20 mg groups (p = 0.002), and a borderline significant difference between the 10 mg and 40 mg groups (p = 0.051). No significant difference was found between the 20 mg and 40 mg groups (Table 3).
In addition to the observed dose-dependent differences, women receiving 10 mg daily had significantly higher plasma atorvastatin concentrations than men. This gender-based variation may be attributed to differences in pharmacokinetics (PK), enzyme activity, or hormonal factors. No significant associations were observed between atorvastatin plasma concentrations and age, body mass index (BMI), smoking status, or caffeine consumption (coffee or tea).
Atorvastatin drug-drug interactions and polypharmacy
No significant correlations were found between the number of medications or supplements taken and plasma atorvastatin concentrations, nor between any specific medication and atorvastatin levels (see shared data).
Clinical parameters related to lipid profile
The analysis of atorvastatin’s impact on lipid profiles revealed compelling associations. A statistically significant, robust negative correlation was found between atorvastatin concentration and low-density lipoprotein (LDL) levels, with a similar correlation for total cholesterol (rs = −0.45, p < 0.001, and rs = −0.41, p < 0.001, respectively). A weaker but still statistically significant correlation was observed with triglyceride levels (rs = −0.28, p = 0.016).
Regarding liver enzymes, most levels, including alanine transaminase (ALT) and aspartate transaminase (AST), were within the normal range, and there was no discernible correlation between their levels and atorvastatin concentration in plasma. Conversely, creatinine serum displayed a moderate positive correlation with creatinine levels (rs = 0.28, p = 0.01), indicating a potential influence on renal function. Lastly, in the assessment of the uric acid serum, no correlation was detected between atorvastatin plasma concentration and uric acid serum levels, suggesting a distinct metabolic interaction. These findings underscore the multifaceted effects of atorvastatin on various physiological parameters, necessitating comprehensive monitoring in clinical contexts.
Atorvastatin concentrations are due to other variables, including daily dose-dependent
In addition to daily dose intake showing a statistically significant association with atorvastatin plasma concentration, women who received a daily dose of 10 mg showed a significantly higher level of atorvastatin plasma concentration than men. Several factors could contribute to this gender difference, including pharmacokinetic differences, enzyme activity, and hormone differences.
Age, BMI, smoking, coffee, and tea variables exhibited no significant association with the plasma concentration.
Among patients receiving 40 mg daily, those with the CYP2D6-4 wild-type homozygous genotype showed significantly higher atorvastatin levels
This group exhibited significantly higher plasma levels compared to others at the same dose (Table 4). These findings suggest that the CYP2D6-4 genotype influences atorvastatin metabolism, with wild-type homozygous individuals potentially requiring lower doses to achieve therapeutic effects. This highlights the role of pharmacogenetics in guiding individualized statin therapy to enhance efficacy and minimize adverse outcomes.
Highest and lowest values
Notably, the top 5 patients with the highest atorvastatin plasma concentrations – all receiving either 40 mg or 20 mg daily – shared the CYP2D6-4 wild-type homozygous genotype. This further supports the association between this genotype and elevated atorvastatin levels.
Discussion
This study investigated the connection between atorvastatin plasma levels in hyperlipidemic patients and drug-metabolizing enzymes, particularly SULT1A1, CYP2D6-4, and CYP2C19-2. Our investigation showed a statistically significant correlation between the plasma levels of atorvastatin and the homozygous individuals in the CYP2D6-4 wild type.
According to a 2012 randomized trial, rosuvastatin raises plasma PCSK9 levels by 35% and 28% in men and women after a year of use compared to a placebo. Nonetheless, PCSK9 levels were not predictive of the LDL-C response to statin treatment, as an inverse relationship was observed – participants with lower LDL-C levels tended to have higher PCSK9 concentrations.8
A 2012 study examined the relationship between SNP rs1121617 and metformin glycemic response in 5 cohorts. The effectiveness of metformin and genotype were found to be related in patients with decompression sickness (DCS). According to meta-analyses of prior cohorts and studies, the metformin drug efficacy in type 2 diabetic patients in the UK and the Netherlands is strongly correlated with the rs11212617 genotype.9
A 2012 study discovered that the CYP2C9 genotype significantly reduces triglycerides and LDL-C in hypercholesterolemic patients taking fluvastatin. However, the rarity of certain CYP genotypes makes it challenging to demonstrate a positive genotype-fluvastatin effect correlation, which is why the study’s conclusions are inconclusive.10
Interindividual variations in LDL-C response to statins are attributed to genetics. A 2016 study assessed 59 LDL-C SNPs, finding lead SNPs for APOE, SORT1, and NPC1L1 linked to lowered responses and a genetic predisposition for higher LDL-C levels. This suggests that genetic predisposition for elevated LDL-C levels may lower statin therapy’s effectiveness.11
A 2020 study found that patients with CYP2D6*3 and ABCA1 mutations are less likely to meet therapeutic lipid goals. Findings also suggest that genotyping of ABCA1, CYP2D6, and CETP, pending further validation, could support the selection and dosing of statins in the context of personalized treatment strategies.12
In a 2020 study involving 269 Chinese patients with hypercholesterolemia and diabetes mellitus, the ABCG2 421C SNP was found to be the most significant SNP. The study also examined the effect of transport-related SNPs on rosuvastatin PK.13
A study published in 2021 investigated the impact of genetic polymorphisms on the therapeutic response to rosuvastatin, atorvastatin, and simvastatin in hyperlipidemic patients. The study enrolled 180 individuals aged 40–75 years. Over a 4-month treatment period, all 3 statins were found to effectively reduce LDL-C and total cholesterol levels. However, patients with the 51CC genotype exhibited a reduced response to statin therapy. In contrast, the MRD1 polymorphism did not show a significant effect on statin efficacy.14
Since 2021, Chinese researchers have investigated the relationship between statin efficacy and ApoE gene polymorphisms. In a clinical study, 220 hyperlipidemic patients receiving statin therapy were enrolled to assess how variations in the ApoE gene may influence treatment outcomes. Peripheral venous blood samples were obtained from all participants, and genotyping was performed to identify ApoE variants (ApoE2, ApoE3, and ApoE4) to assess their potential influence on statin treatment efficacy. The findings of the study demonstrated that ApoE4 differs from non-ApoE4 gene carriers. Comparing ApoE4 to non-ApoE4 gene carriers, ApoE4 demonstrated lower rates of TG and LDL reduction as well as lower rates of high-density lipoprotein (HDL) rise. The results of the study indicate that the ApoE4 polymorphism is not only linked to hyperlipidemia but also significantly influences the therapeutic response to statin treatment.15
A significant correlation was found between the CYP2D6-4 polymorphism and interindividual variability in plasma atorvastatin levels among hyperlipidemic patients, suggesting a potential role in influencing drug metabolism and therapeutic response. This finding emphasizes the value of tailored medicine in treating hyperlipidemia, making it clinically substantial. Genotyping-based personalized dosing can improve patient compliance, minimize side effects, and maximize therapeutic results. Patients with the homozygous CYP2D6-4 wild-type genotype, in particular, may benefit from therapy at lower dosages, lowering the possibility of adverse effects linked to higher atorvastatin concentrations. By incorporating genotyping into standard clinical practice, physicians can better manage lipid levels and reduce the risk of cardiovascular disease by customizing statin therapy to each patient’s genetic profile.
Limitations
Although the findings of this study are significant, certain limitations should be acknowledged. Although 90 patients is a sufficient sample size for preliminary analysis, it might not be enough to extrapolate the findings to the larger Jordanian population or other ethnic groups. Furthermore, only a few genetic polymorphisms (CYP2D6-4, SULT1A1, and CYP2C19-2) were examined in this study; however, other genetic factors may also affect the metabolism and response to atorvastatin. Furthermore, the study’s detailed investigation of lifestyle factors that may affect drug metabolism, nor its accounting for possible interactions with other medications, is beyond the scope of this study. Finally, the study’s cross-sectional design makes it difficult to determine causality.
Recommendations
Expanding the sample size and incorporating diverse populations into future research is imperative to ensure cross-validation of the findings across genetic backgrounds. Plasmid plasma concentrations and genetic polymorphisms may be related in a causal manner, according to a long-term research design. Comprehensive pharmacogenomics profiling, encompassing a wider variety of genetic variants, may also offer a more comprehensive understanding of the variables influencing statin metabolism and efficacy. Further refining individualized treatment strategies would involve examining the effects of other medications, lifestyle factors, and comorbidities on atorvastatin levels. Lastly, tests integrating genotyping into standard medical practice illustrate the usefulness and viability of tailored statin treatment, which may result in revised protocols for treating hyperlipidemia.
Conclusions
This study successfully developed a validated LC-MS/MS method for quantifying atorvastatin in plasma and demonstrated its application in therapeutic drug monitoring for hyperlipidemic patients. A key finding was the significant influence of the CYP2D6-4 wild-type homozygous genotype on atorvastatin plasma concentrations, indicating the potential for dose adjustment based on genetic profile. These results underscore the value of integrating pharmacogenetic testing into routine clinical practice to guide individualized statin therapy, particularly in genetically diverse populations like Jordanians.
Data availability
The datasets supporting the findings of the current study are available from the corresponding author on reasonable request. The data are not publicly available due to legal/ethical reasons. The study adheres to the ethical guidelines of Jordan Ministry of Health, as well as the Helsinki Declaration and Good Clinical Practice (GCP) standards, which emphasize the protection of patient data and confidentiality. Disclosure of sensitive medical data to the public would conflict with these standards and local health regulations.
Other raw data are available here: https://doi.org/10.5281/zenodo.15111777.
Consent for publication
Not applicable.
Use of AI and AI-assisted technologies
Not applicable.