Abstract
Background. Late diagnosis and chemotherapy resistance, particularly to 5-fluorouracil (5-FU), contribute to the low survival rate in cholangiocarcinoma (CCA) patients. Identifying relevant genes and pathways, as well as novel targeted molecules, is crucial to overcoming 5-FU resistance and improving treatment outcomes for CCA patients.
Objectives. This study aimed to determine the potential molecules associated with 5-FU resistance in CCA cells.
Materials and methods. Transcriptomic datasets from 4 stable 5-FU-resistant cell lines and their corresponding parental lines were retrieved from the Gene Expression Omnibus. A series of bioinformatics analyses were conducted to identify key genes upregulated in 5-FU-resistant cells compared to their parental counterparts. The expression levels of candidate genes identified through bioinformatics analysis were validated in CCA tissues and cell lines.
Results. Differential gene expression, protein–protein interaction, and Hub genes analysis revealed 8 genes that were significantly upregulated in 5-FU resistance cells compared to their parental cells. Six of the 8 genes, including TCP1, RPS6, RPS29, HSPA5, RPS15A, and NOTCH1, were upregulated in patient CCA tissues. Using real-time PCR, only the expression levels of NOTCH1 and TCP1 were significantly higher in the 5-FU insensitive CCA cell lines, KKU-213A and KKU-213B, than that of the 5-FU sensitive CCA cell line, KKU-055. A similar result was observed in stable 5-FU-resistant cell lines (KKU-213A-FR and KKU-213B-FR) compared to their parental cells.
Conclusions. The bioinformatic analysis and PCR results revealed that NOTCH1 and TCP1 might be associated with 5-FU resistance and serve as potential molecular targets to enhance 5-FU sensitivity in CCA cells.
Key words: 5-fluorouracil, resistance, cholangiocarcinoma, NOTCH1, TCP1
Background
Cholangiocarcinoma (CCA) is a malignancy arising from the biliary epithelium.1 Surgical resection remains the cornerstone of therapy for early-stage disease, offering the best chance for long-term survival. In contrast, patients with metastatic or unresectable CCA are typically managed with systemic chemotherapy, most often 5-fluorouracil (5-FU).2 Unfortunately, response rates to 5-FU in CCA are modest, and the emergence of 5-FU resistance is the principal cause of therapeutic failure, driving disease progression and mortality. Although the molecular mechanisms underpinning 5-FU resistance have been well characterized in other cancers3, 4 those specific to CCA remain poorly understood. A deeper elucidation of these pathways is therefore essential to develop more effective, resistance-overcoming treatment strategies for CCA. Recently, bioinformatics analyses leveraging public transcriptomic repositories, such as the Gene Expression Omnibus (GEO)5 and The Cancer Genome Atlas (TCGA)6, have become increasingly prevalent across biomedical research. These approaches have enabled the identification of novel therapeutic targets in gastric cancer,7 non–small cell lung cancer and esophageal carcinoma,8 as well as cholangiocarcinoma.9 Moreover, numerous studies have demonstrated that mining these datasets can reveal molecular drivers of anticancer drug resistance. Accordingly, applying bioinformatics methods to publicly available transcriptomic data represents a promising strategy for uncovering candidate mediators of 5-FU resistance in CCA.
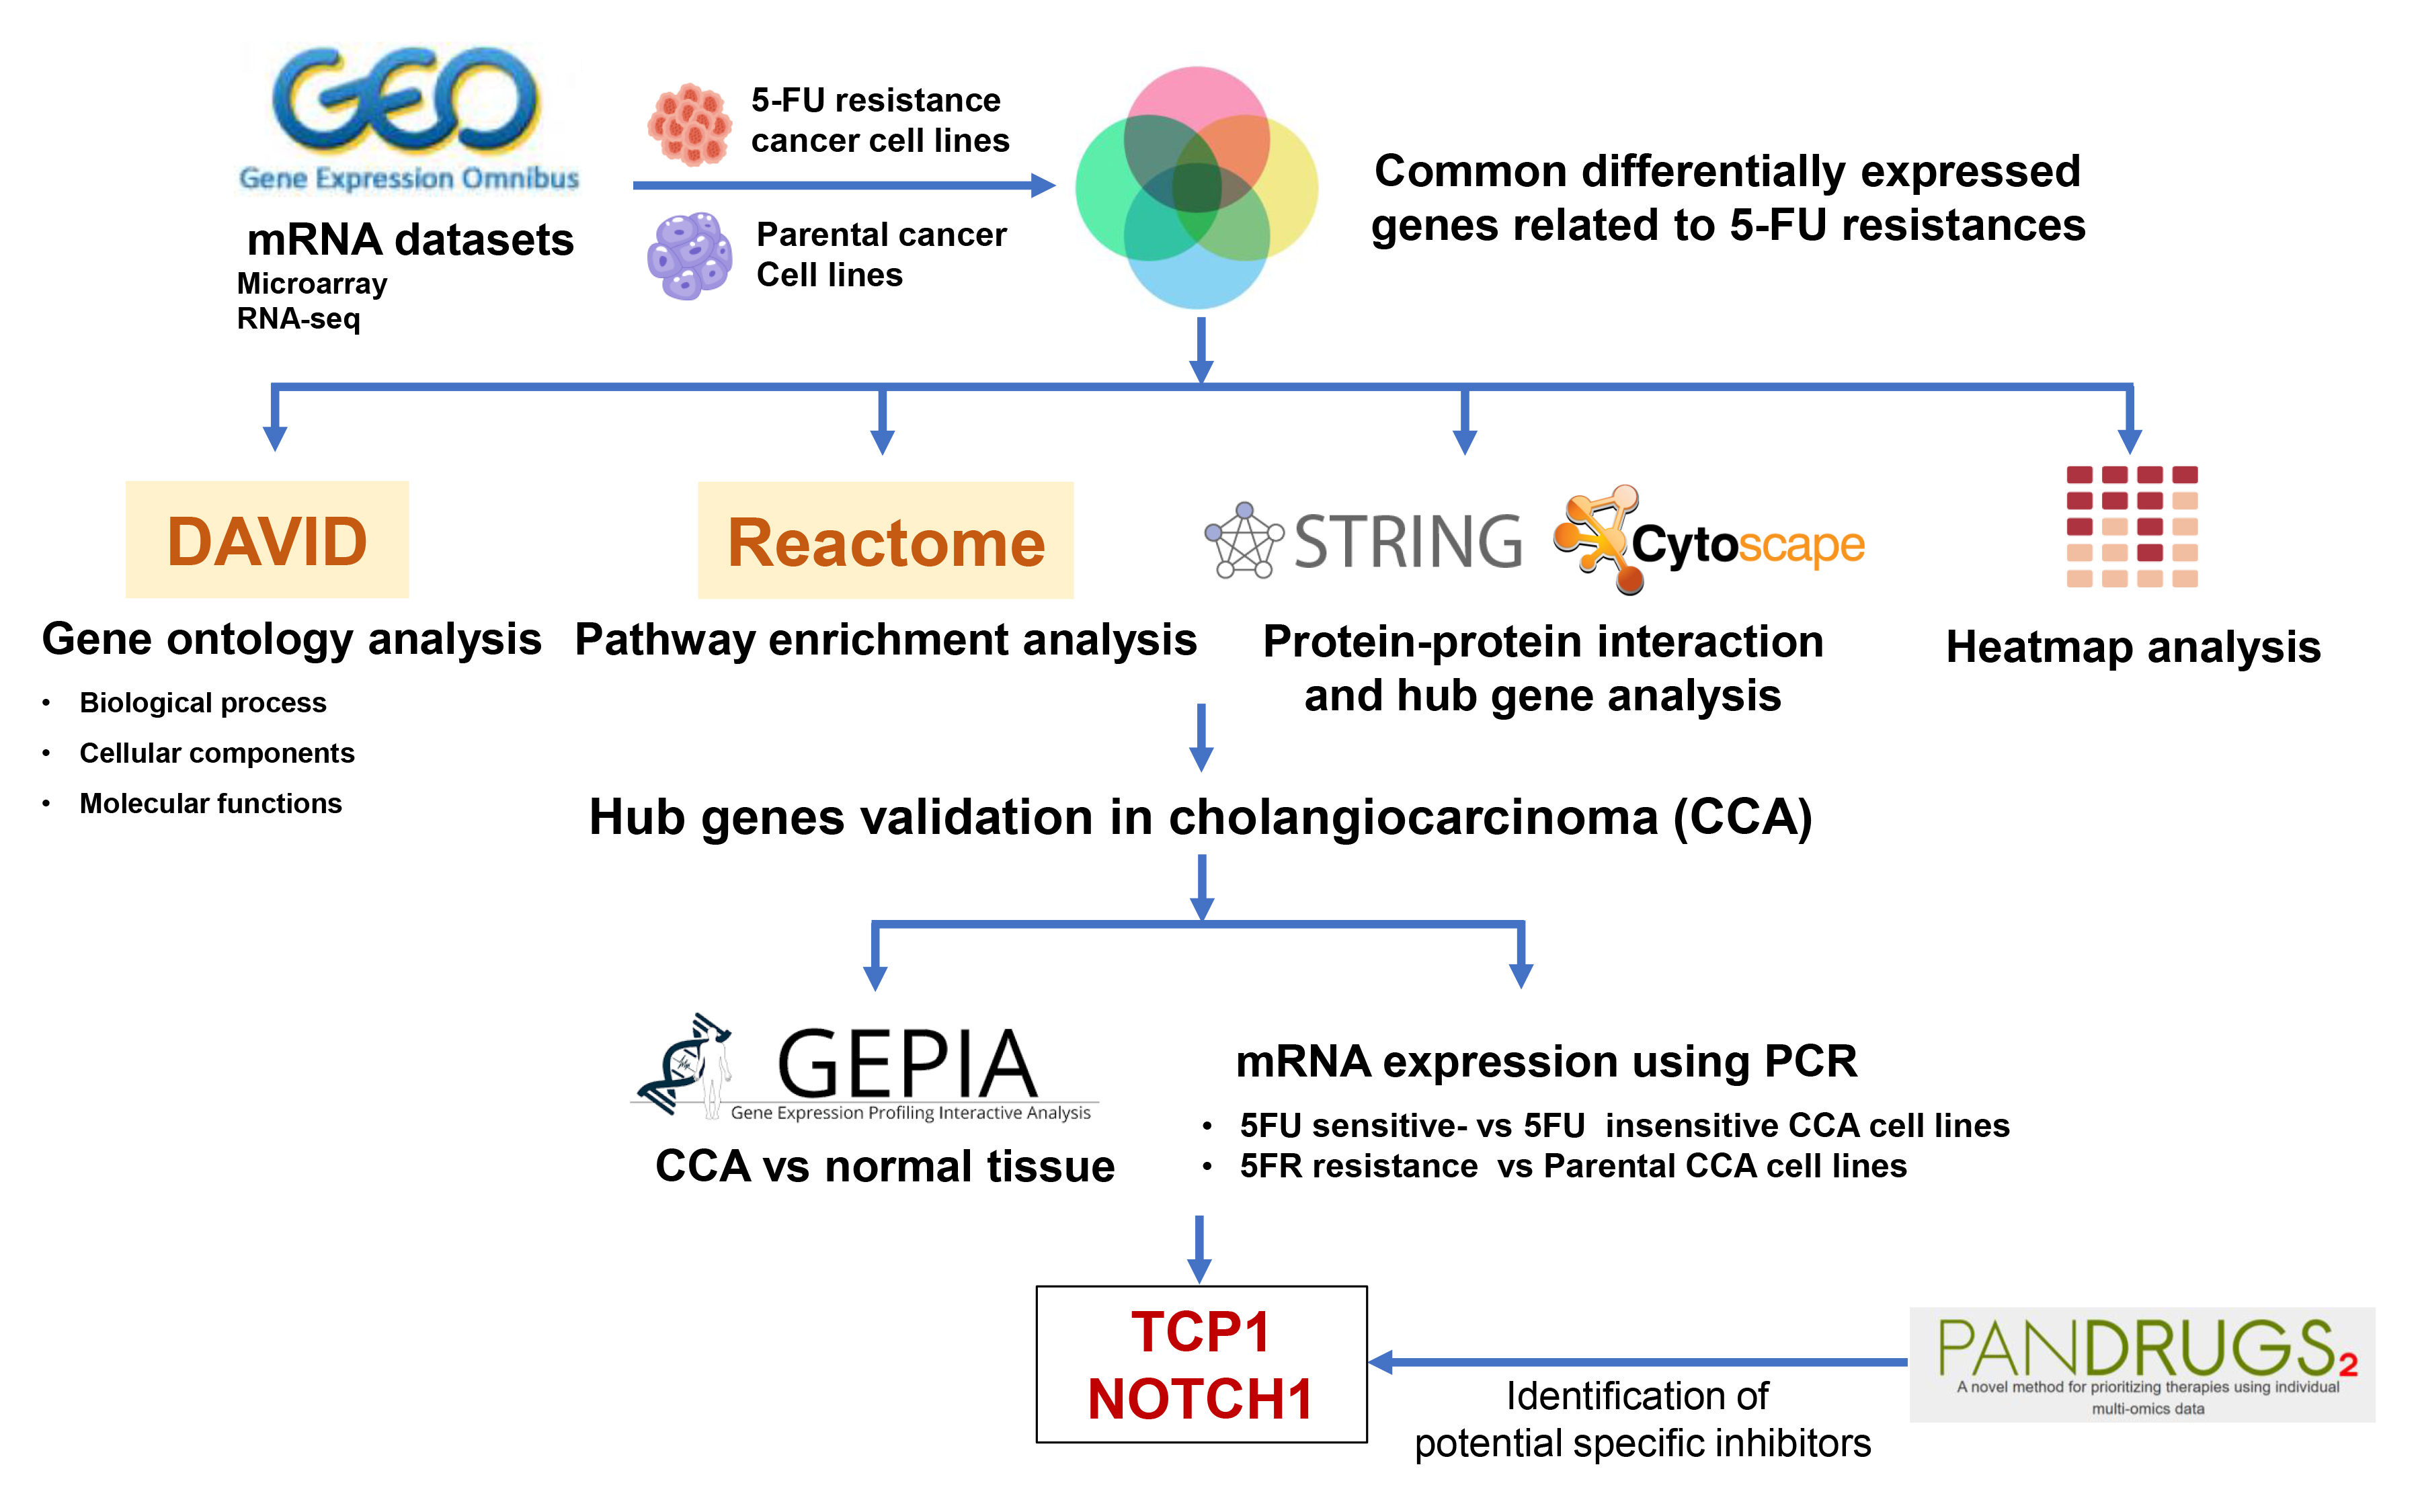
In this study, we combined bioinformatics and experimental approaches to uncover molecules linked to 5-FU resistance in CCA. First, we mined multiple GEO transcriptomic datasets to identify genes consistently associated with 5-FU resistance. Next, we constructed a protein–protein interaction network (PPI) of these candidate genes to highlight central “hub” factors. We then validated the expression of key resistance-associated genes in both CCA patient tissues and established cell lines using quantitative PCR. Finally, we employed PanDrugs to predict existing compounds that target these hub genes, laying the groundwork for potential therapeutic interventions.
Objectives
This study aimed to investigate potential target molecules associated with 5-FU resistance in CCA using bioinformatics, and PCR techniques.
Materials and methods
Cholangiocarcinoma cells
Three human CCA cell lines, KKU-055, KKU-213A, and KKU-213B, were obtained from the Japanese Collection of Research Bioresources Cell Bank.10 Cells were maintained in Dulbecco’s Modified Eagle’s Medium (DMEM; Gibco/BRL, Grand Island, NY, USA) supplemented with 10% fetal bovine serum and 100 U/mL penicillin–streptomycin at 37°C in a humidified atmosphere of 5% CO2. Two 5-FU-resistant sublines (KKU-213A-FR and KKU-213B-FR), kindly provided by Assoc. Prof. S. Obchoei,11 were cultured in complete DMEM containing the IC10 concentration of 5-FU.
Proliferation assay
To assess 5-FU sensitivity, 2,000 cells per well were seeded in 96-well plates and incubated under standard culture conditions. Cell viability was then quantified using the MTT assay: After treatment, MTT solution (0.5 mg/mL) was added to each well and plates were incubated for 4 h at 37°C. The resulting formazan crystals were solubilized by adding 100 µL of DMSO and mixing thoroughly. Absorbance was measured at 540 nm on a microplate reader (Tecan Austria GmbH, Salzburg, Austria) to determine relative cell viability.
Determination of differentially expressed genes
To identify molecules commonly associated with 5-FU resistance, we retrieved transcriptomic profiles of stable 5-FU-resistant cancer cell lines from the GEO database (accession numbers GSE196900, GSE23776, and GSE81005). We then examined the GSE7631 dataset – which comprises 92 non-tumor controls and 91 Thai CCA patient tissue samples, to evaluate the expression of candidate genes in clinical specimens.
Differentially expressed genes (DEGs) were identified from microarray datasets using GEO2R (https://www.ncbi.nlm.nih.gov/geo/geo2r) and from RNA-seq data via the Galaxy platform (https://usegalaxy.org).12 Genes meeting the criteria of an adjusted p-value < 0.05 and |log2 fold change| > 0.5 were considered significant. Data visualization, including volcano plots and Venn diagrams, was performed in RStudio (https://rstudio.com) and with the jvenn online tool (https://jvenn.toulouse.inrae.fr/app/index.html), respectively.
Gene Ontology and pathway enrichment analysis
Gene Ontology (GO) and pathway enrichment analyses of the identified DEGs were performed using the DAVID Functional Annotation tool.13 Differentially expressed genes were classified into GO categories, biological processes, cellular components, and molecular functions, as well as mapped to Reactome pathways.14 Enrichment results were visualized as a bubble plot in RStudio to illustrate the significance and gene counts for each term.
Protein–protein interaction and hub gene identifications
Protein–protein interaction (PPI) networks for the common DEGs were generated using STRING v. 11.5 (https://string-db.org/). Hub genes within these networks were identified and ranked in Cytoscape (https://cytoscape.org) via the cytoHubba plugin,15 with the top 30 genes selected based on connectivity degree. A heatmap illustrating the expression patterns of these hub genes across all datasets was then plotted using GraphPad Prism 9.2 (GraphPad Software, San Diego, USA).
Real-time polymerase chain reaction
Total RNA was isolated from CCA cell lines using TRIzol® Reagent (Invitrogen, Carlsbad, USA) according to the manufacturer’s protocol. RNA purity and concentration were assessed with a NanoDrop™ 2000 Spectrophotometer (Thermo Fisher Scientific, Waltham, USA). For reverse transcription, total RNA was converted to cDNA using the High-Capacity cDNA Reverse Transcription Kit (Applied Biosystems, Foster City, USA; cat. No. 4368814) following the supplier’s instructions.
Real-time quantitative PCR was conducted to assess the mRNA expression of candidate 5-FU resistance genes in CCA cell lines using a LightCycler® 480 system (Roche Diagnostics, Basel, Switzerland). Each 20 µL reaction contained 1× LightCycler® 480 SYBR Green I Master Mix (Roche Diagnostics), 0.5 µM of each primer, and 40 ng of cDNA template. Thermal cycling and fluorescence acquisition were performed according to the manufacturer’s recommended protocol.
PCR amplifications were performed on a LightCycler 480 system with the following cycling conditions: An initial denaturation at 95°C for 5 min; 40 cycles of 95°C for 20 s, gene-specific annealing at 65°C (TCP1), 58°C (RPS6, RPS15A, NOTCH1), 60°C (RPS29), or 63°C (HSPA5) for 10 s; and extension at 72°C for 20 s. For each reaction, cycle threshold (Ct) and melting temperature (Tm) values were recorded, and mean ±SD were calculated. Relative gene expression was quantified using the 2–ΔCt method. Primer sequences and expected amplicon sizes are detailed in Table 1.
Determination of targeted drug for 5-FU sensitizing using PanDrugs analysis
PanDrugs (www.pandrugs.org)16 was used to identify druggable targets for sensitizing 5-FU-resistant CCA cell lines. Hub genes from the PPI analysis were submitted to PanDrugs, and candidate compounds were selected based on 2 criteria: 1) availability of a clinically approved, specific inhibitor targeting the gene product, and 2) evidence of the drug’s efficacy in enhancing chemosensitivity.
Statistical analyses
Real-time PCR data are reported as the mean ±SD from 3 independent biological experiments, each performed in triplicate. Statistical analyses were conducted using IBM SPSS v. 24.0 (IBM Corp., Armonk, USA) and GraphPad Prism 9.2 (GraphPad Software Inc.). For microarray and RNA-seq datasets, p-values were calculated using the Limma and DESeq2 packages in R, respectively, and adjusted for multiple testing by the Benjamini–Hochberg method. Normality of data distributions was assessed by the Kolmogorov–Smirnov test, and homogeneity of variances was confirmed by Levene’s test (Supplementary Table 1). Differences between 5-FU-resistant and parental cell lines were considered statistically significant at p < 0.05.
Data meeting normality and homogeneity of variance criteria were compared by Student’s t-test, whereas non-normally distributed data or those with unequal variances were analyzed using the Mann–Whitney (M–W) U test. For nonparametric comparisons, box-and-whisker plots display the median and interquartile range (IQR); for parametric analyses, results are presented as mean with 95% confidence intervals (95% CIs). Three-group comparisons – examining the correlation between mRNA levels of 6 upregulated hub genes and 5-FU response rates in CCA cell lines – were performed by the Kruskal–Wallis (K–W) test followed by Dunn’s multiple comparisons. The Wilcoxon matched-pairs signed-rank test was used to compare 5-FU sensitivity between resistant and parental cells. A two-sided p-value < 0.05 was considered statistically significant.
Results
Identification of 417 DEGs common to 4 stable 5-FU-resistant cancer cell lines
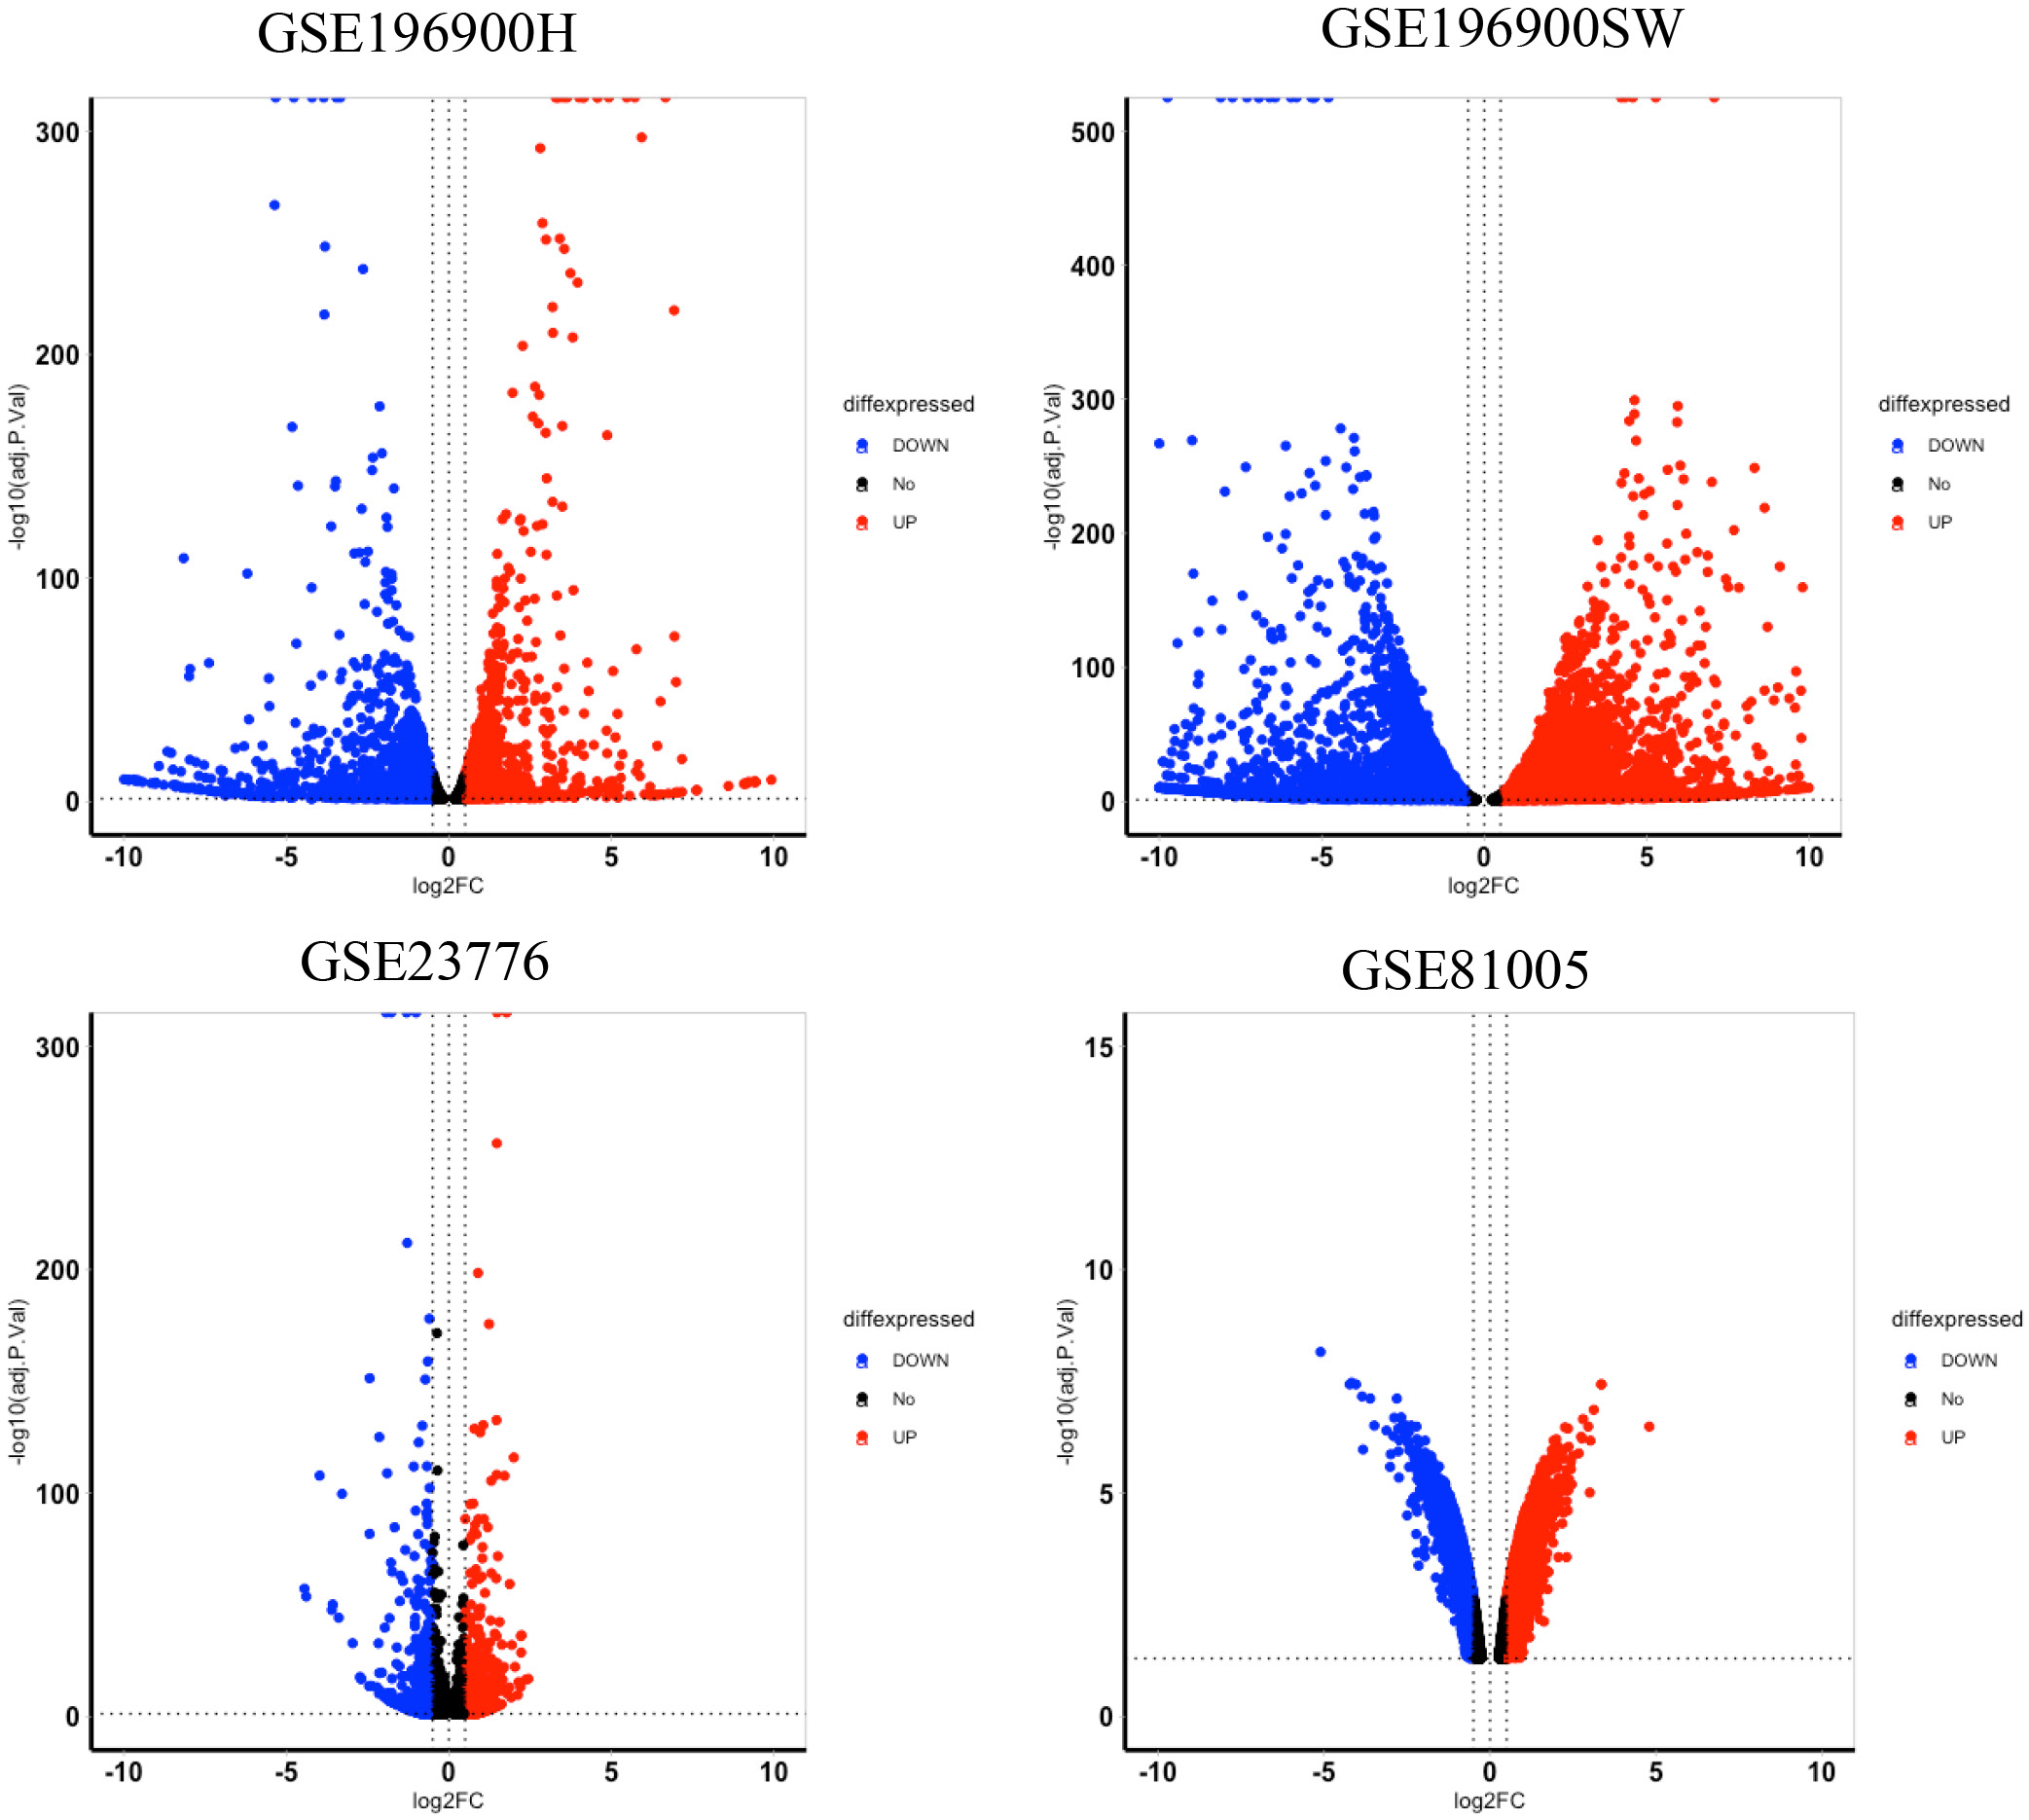
We searched the GEO database for transcriptome datasets of stable 5-FU-resistant cancer cell lines. Our search revealed 3 transcriptomics datasets from four 5-FU-resistant colorectal cancer cell lines and their corresponding parental cells, including GSE196900, GSE23776, and GSE81005. The DEGs analysis revealed a total of 6,965, 11,899, 2,537 and 7,255 DEGs were identified from GSE196900H (HCT116 5-FU-resistant/HCT116 parental), GSE196900SW (SW480 5-FU-resistant/SW480 parental cell lines), GSE23776 (MIP 5-FU-resistant/MIP parental cell lines), and GSE81005 (HCT8 5-FU-resistant/HCT8 parental cell lines), respectively.
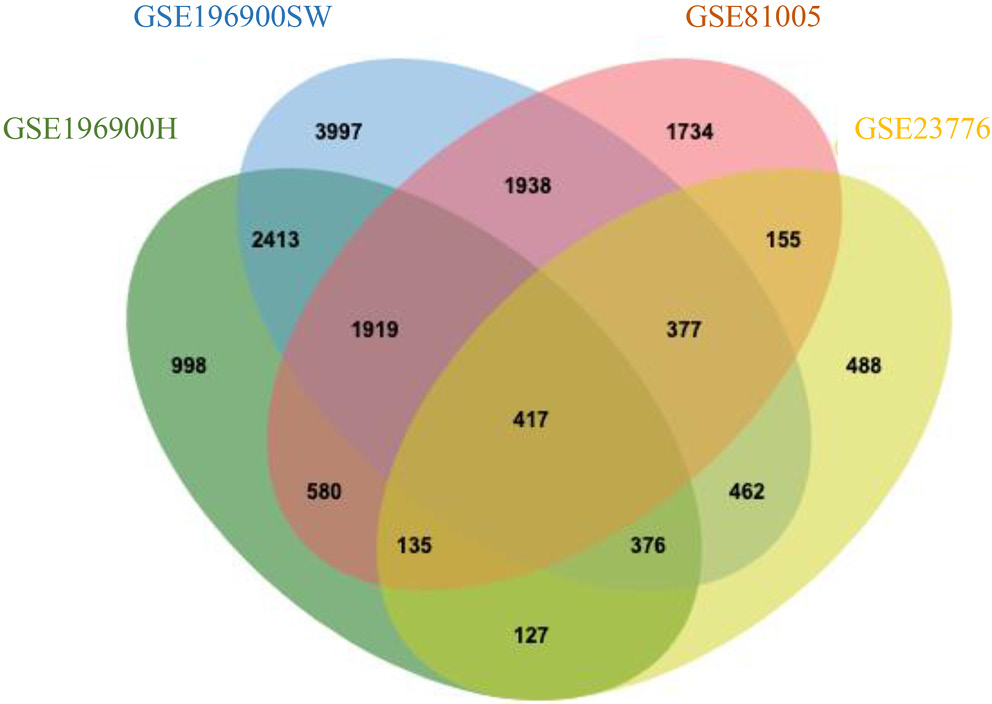
Volcano plots (Figure 1) depict the distribution of significantly up- and downregulated genes in each 5-FU-resistant colorectal cancer model. By intersecting the DEG lists from all 4 datasets with a Venn diagram, we identified 417 genes that were consistently dysregulated across these resistant cell lines (Figure 2). The complete breakdown of upregulated vs downregulated DEGs for each dataset is presented in Table 2.
Gene Ontology and pathway enrichment analysis showed several biological processes related to 5-FU resistance
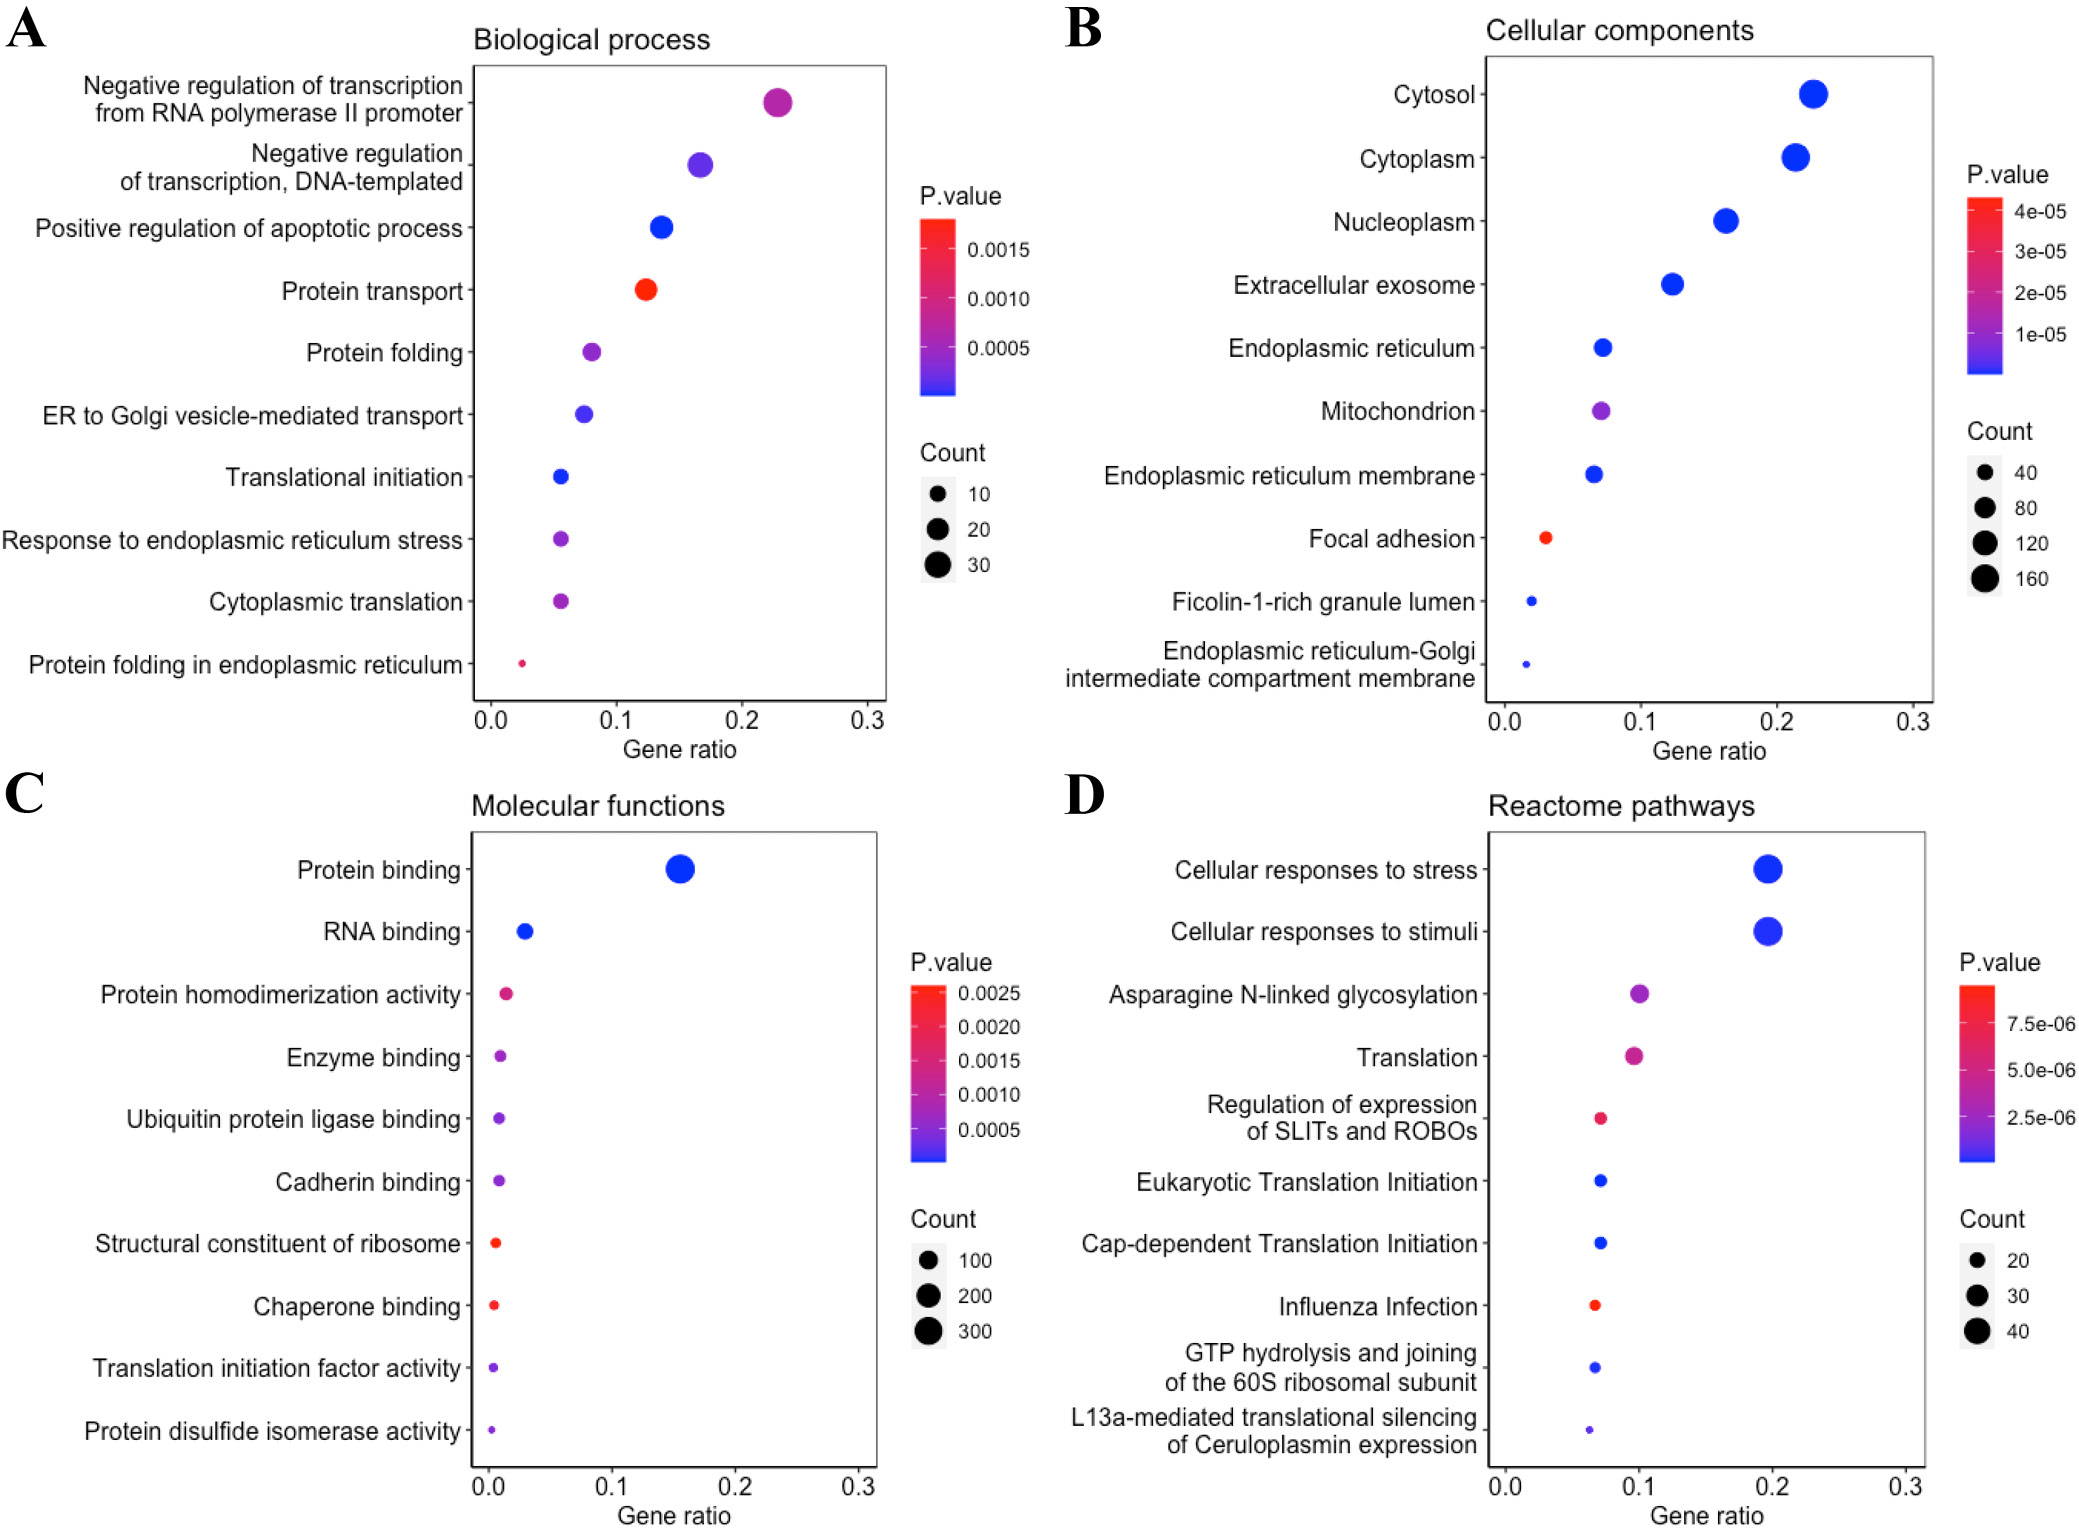
Gene Ontology analysis of the 417 DEGs common to all 4 5-FU-resistant cell lines revealed significant enrichment in biological processes such as negative regulation of transcription from the RNA polymerase II promoter (Figure 3A). At the cellular-component level, these genes localized predominantly to the cytosol and nucleoplasm (Figure 3B). Molecular-function analysis showed a strong bias toward protein and RNA binding activities (Figure 3C). Reactome pathway enrichment further indicated that these DEGs participate broadly in the cellular response to stress and external stimuli, glycosylation processes, and protein translation (Figure 3D).
Identification of the top 10 hub genes associated with 5-FU resistance using PPIs and hub gene analysis
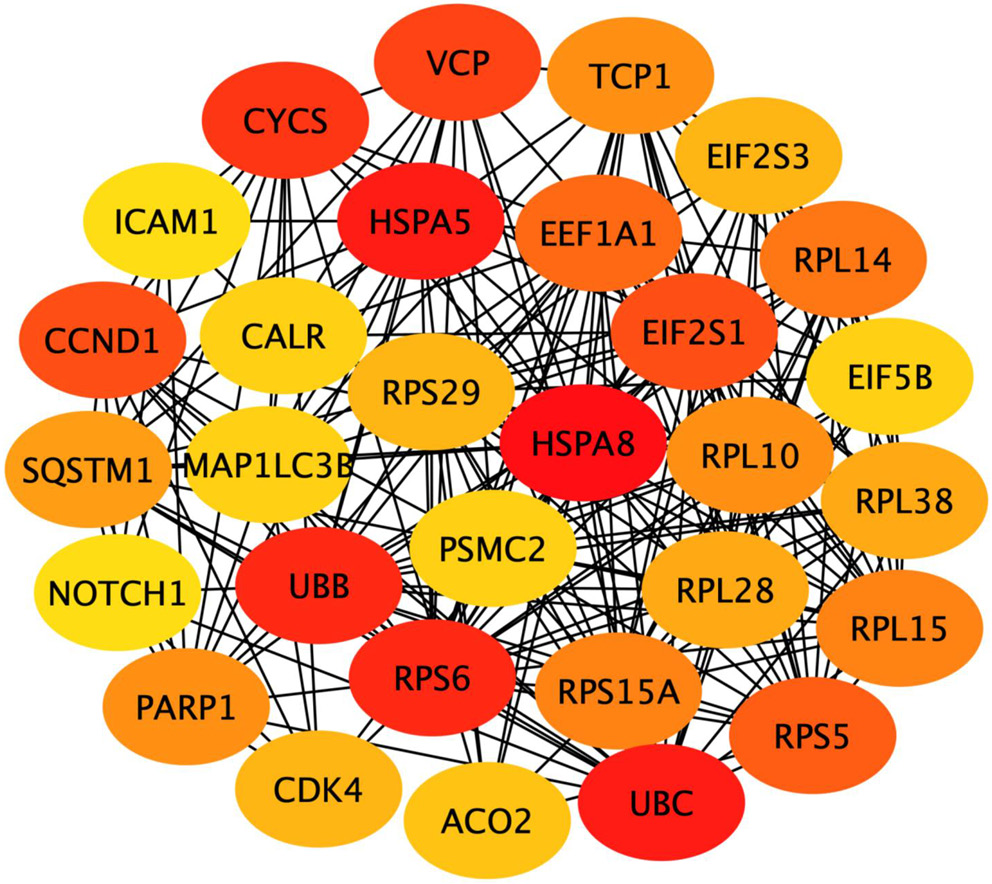
The PPIs of 417 common DEGs associated with 5-FU resistance were constructed using STRING. From the PPIs network, the hub genes were identified and ranked as the top 30 hub genes according to their connectivity (binding scores) with other genes (Table 3). The top 10 hub genes included HSPA8, UBC, HSPA5, UBB, RPS6, CYCS, VCP, EIF2S1, CCND1, RPS5. Node colors reflect the connectivity degree, with a pseudocolor scale ranging from red to yellow, representing gene rankings from 1 to 30 (Figure 4).
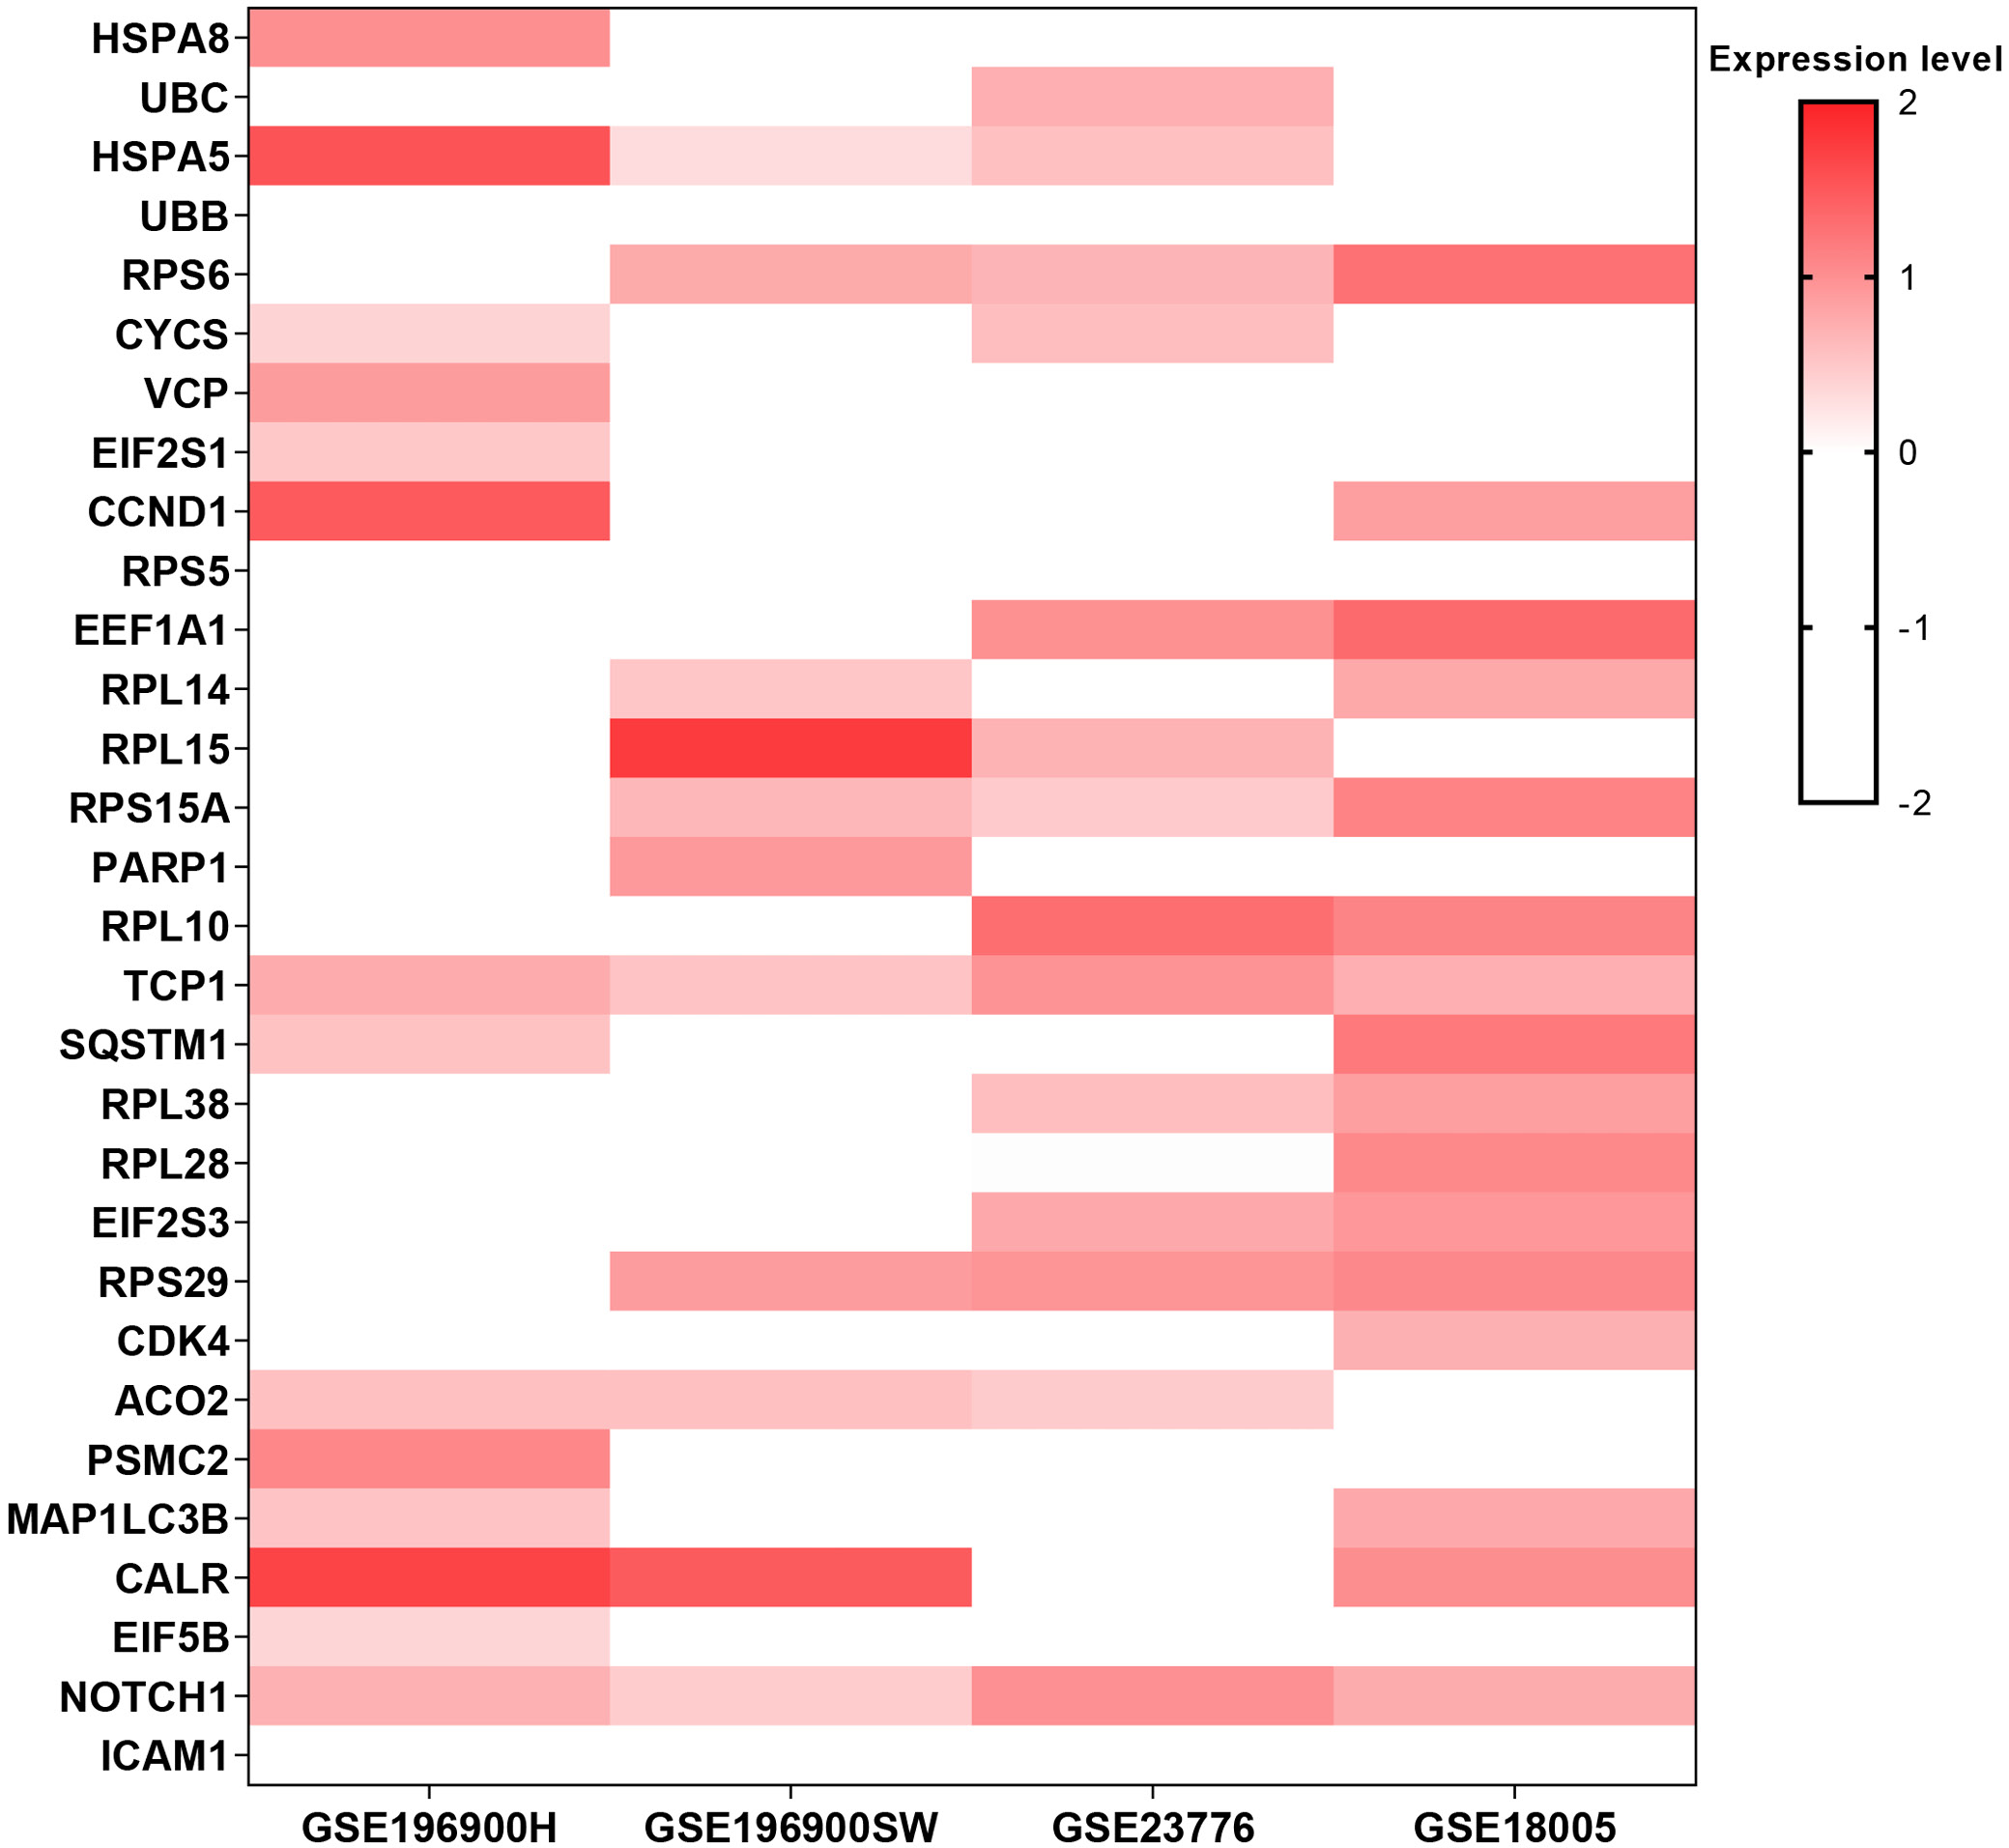
Heatmap analysis (Figure 5) of the top 30 hub genes identified 8 candidates that were upregulated in at least 3 of the 4 5-FU-resistant cell lines: TCP1, RPS6, RPS29, HSPA5, RPS15A, NOTCH1, CALR, and ACO2. These genes were therefore designated as the commonly upregulated hubs for further investigation.
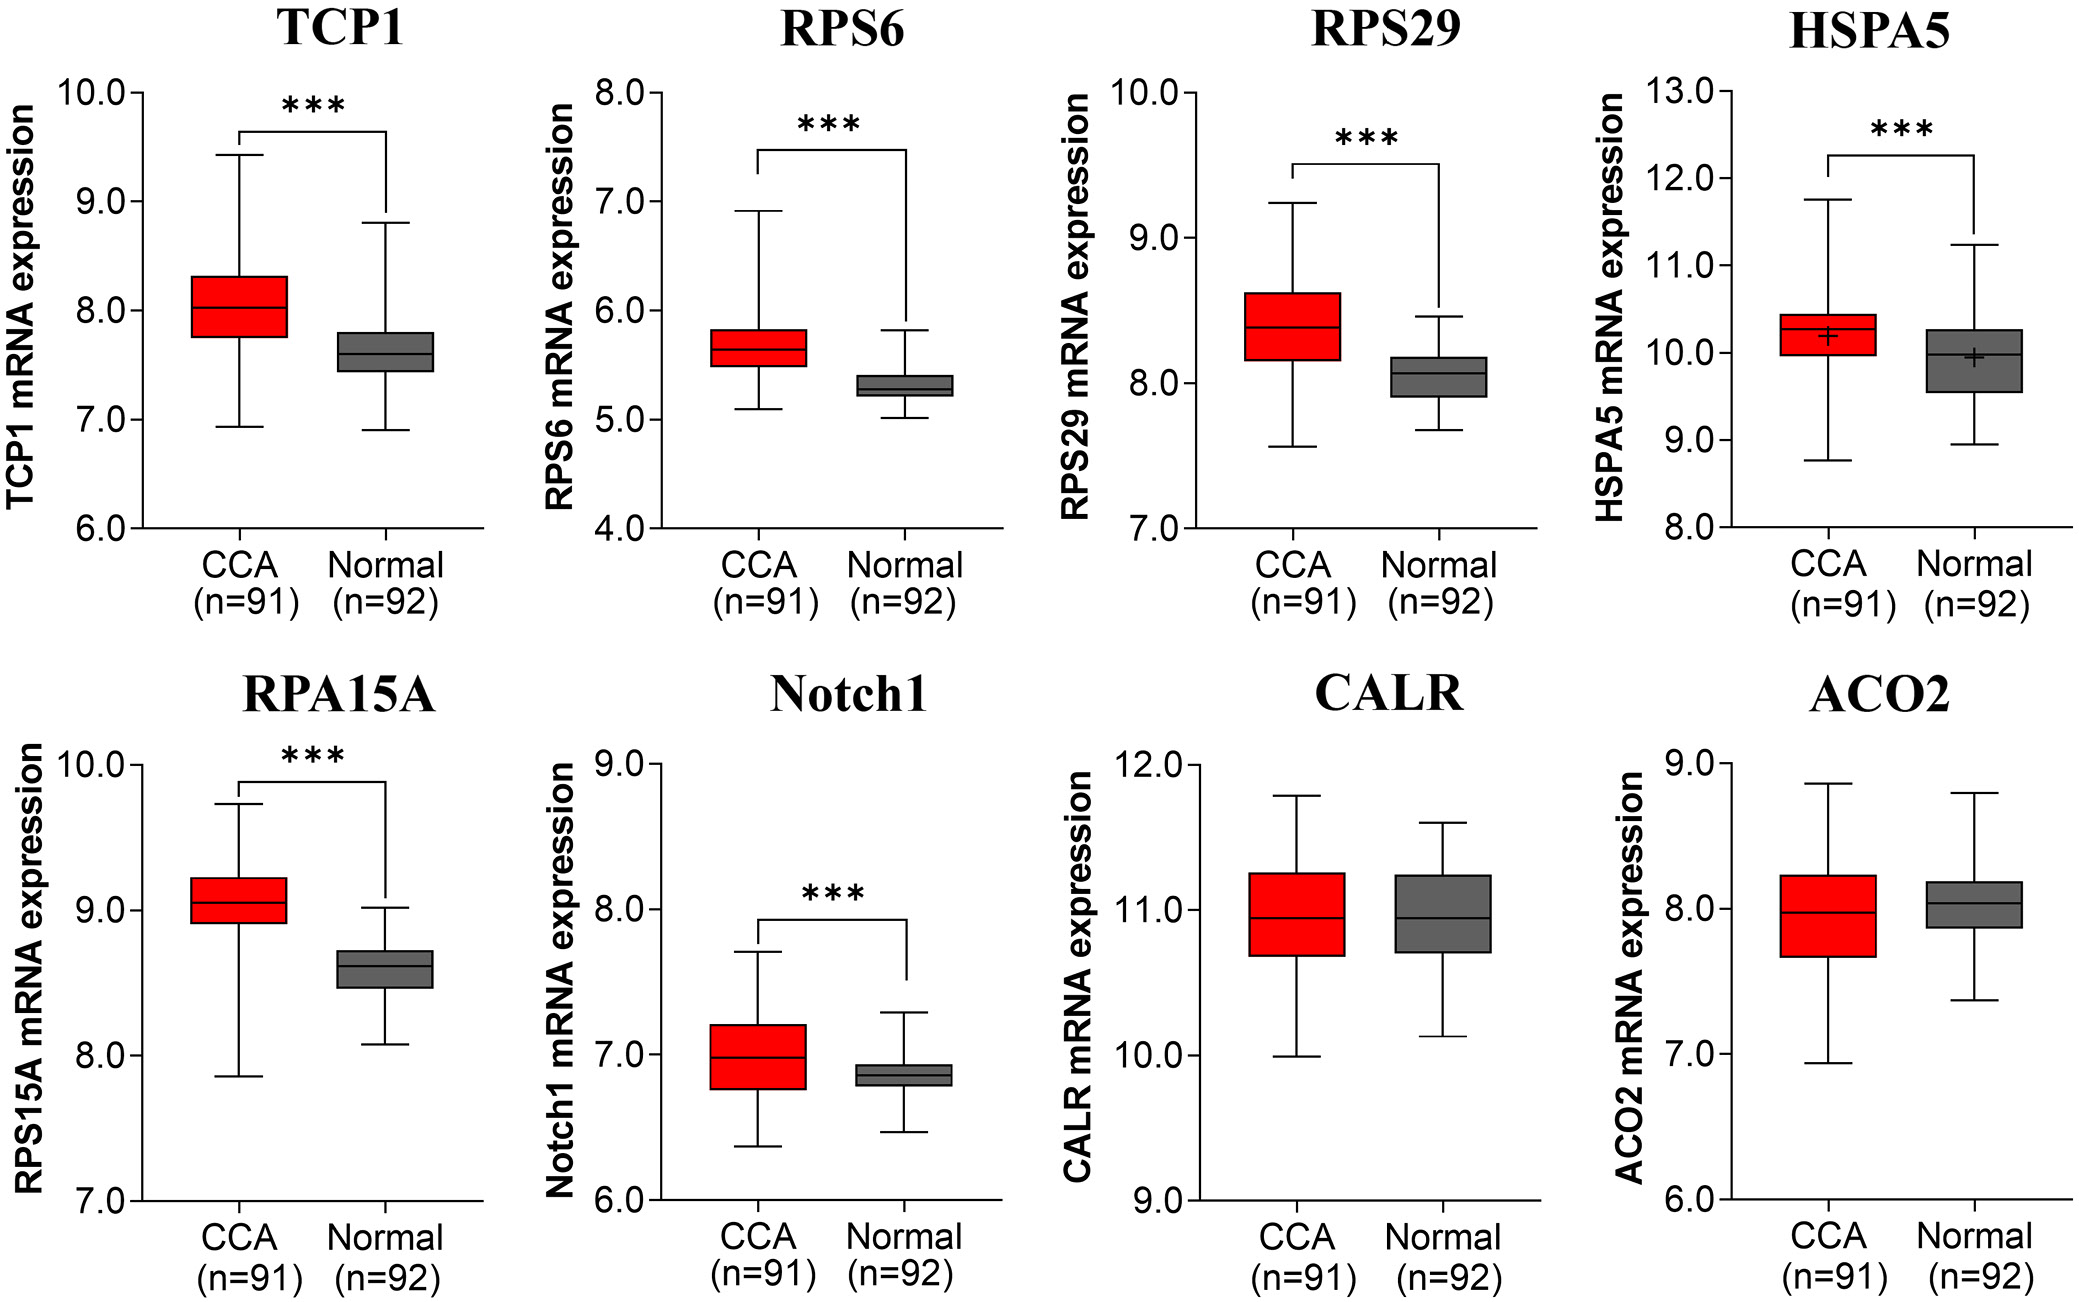
To validate the relevance of the 8 upregulated hub genes in cholangiocarcinoma, we examined their expression in Thai CCA patient tissues using GEO dataset GSE7631.17 Six genes – TCP1 (M–W U = –7.335, p < 0.001), RPS6 (U = –8.521, p < 0.001), RPS29 (U = –7.527, p < 0.001), RPS15A (U = –9.657, p < 0.001), NOTCH1 (U = –3.254, p = 0.001), and HSPA5 (t(181) = 3.505, p = 0.001) – were significantly overexpressed in tumor vs adjacent normal tissues (Figure 6). Detailed summary statistics (median ±IQR for nonparametric tests; mean ±95% CI for parametric tests) are provided in Supplementary Table 2.
Expression of 6 upregulated hub genes associated with 5-FU resistance varied with the 5-FU sensitivity in CCA cell lines
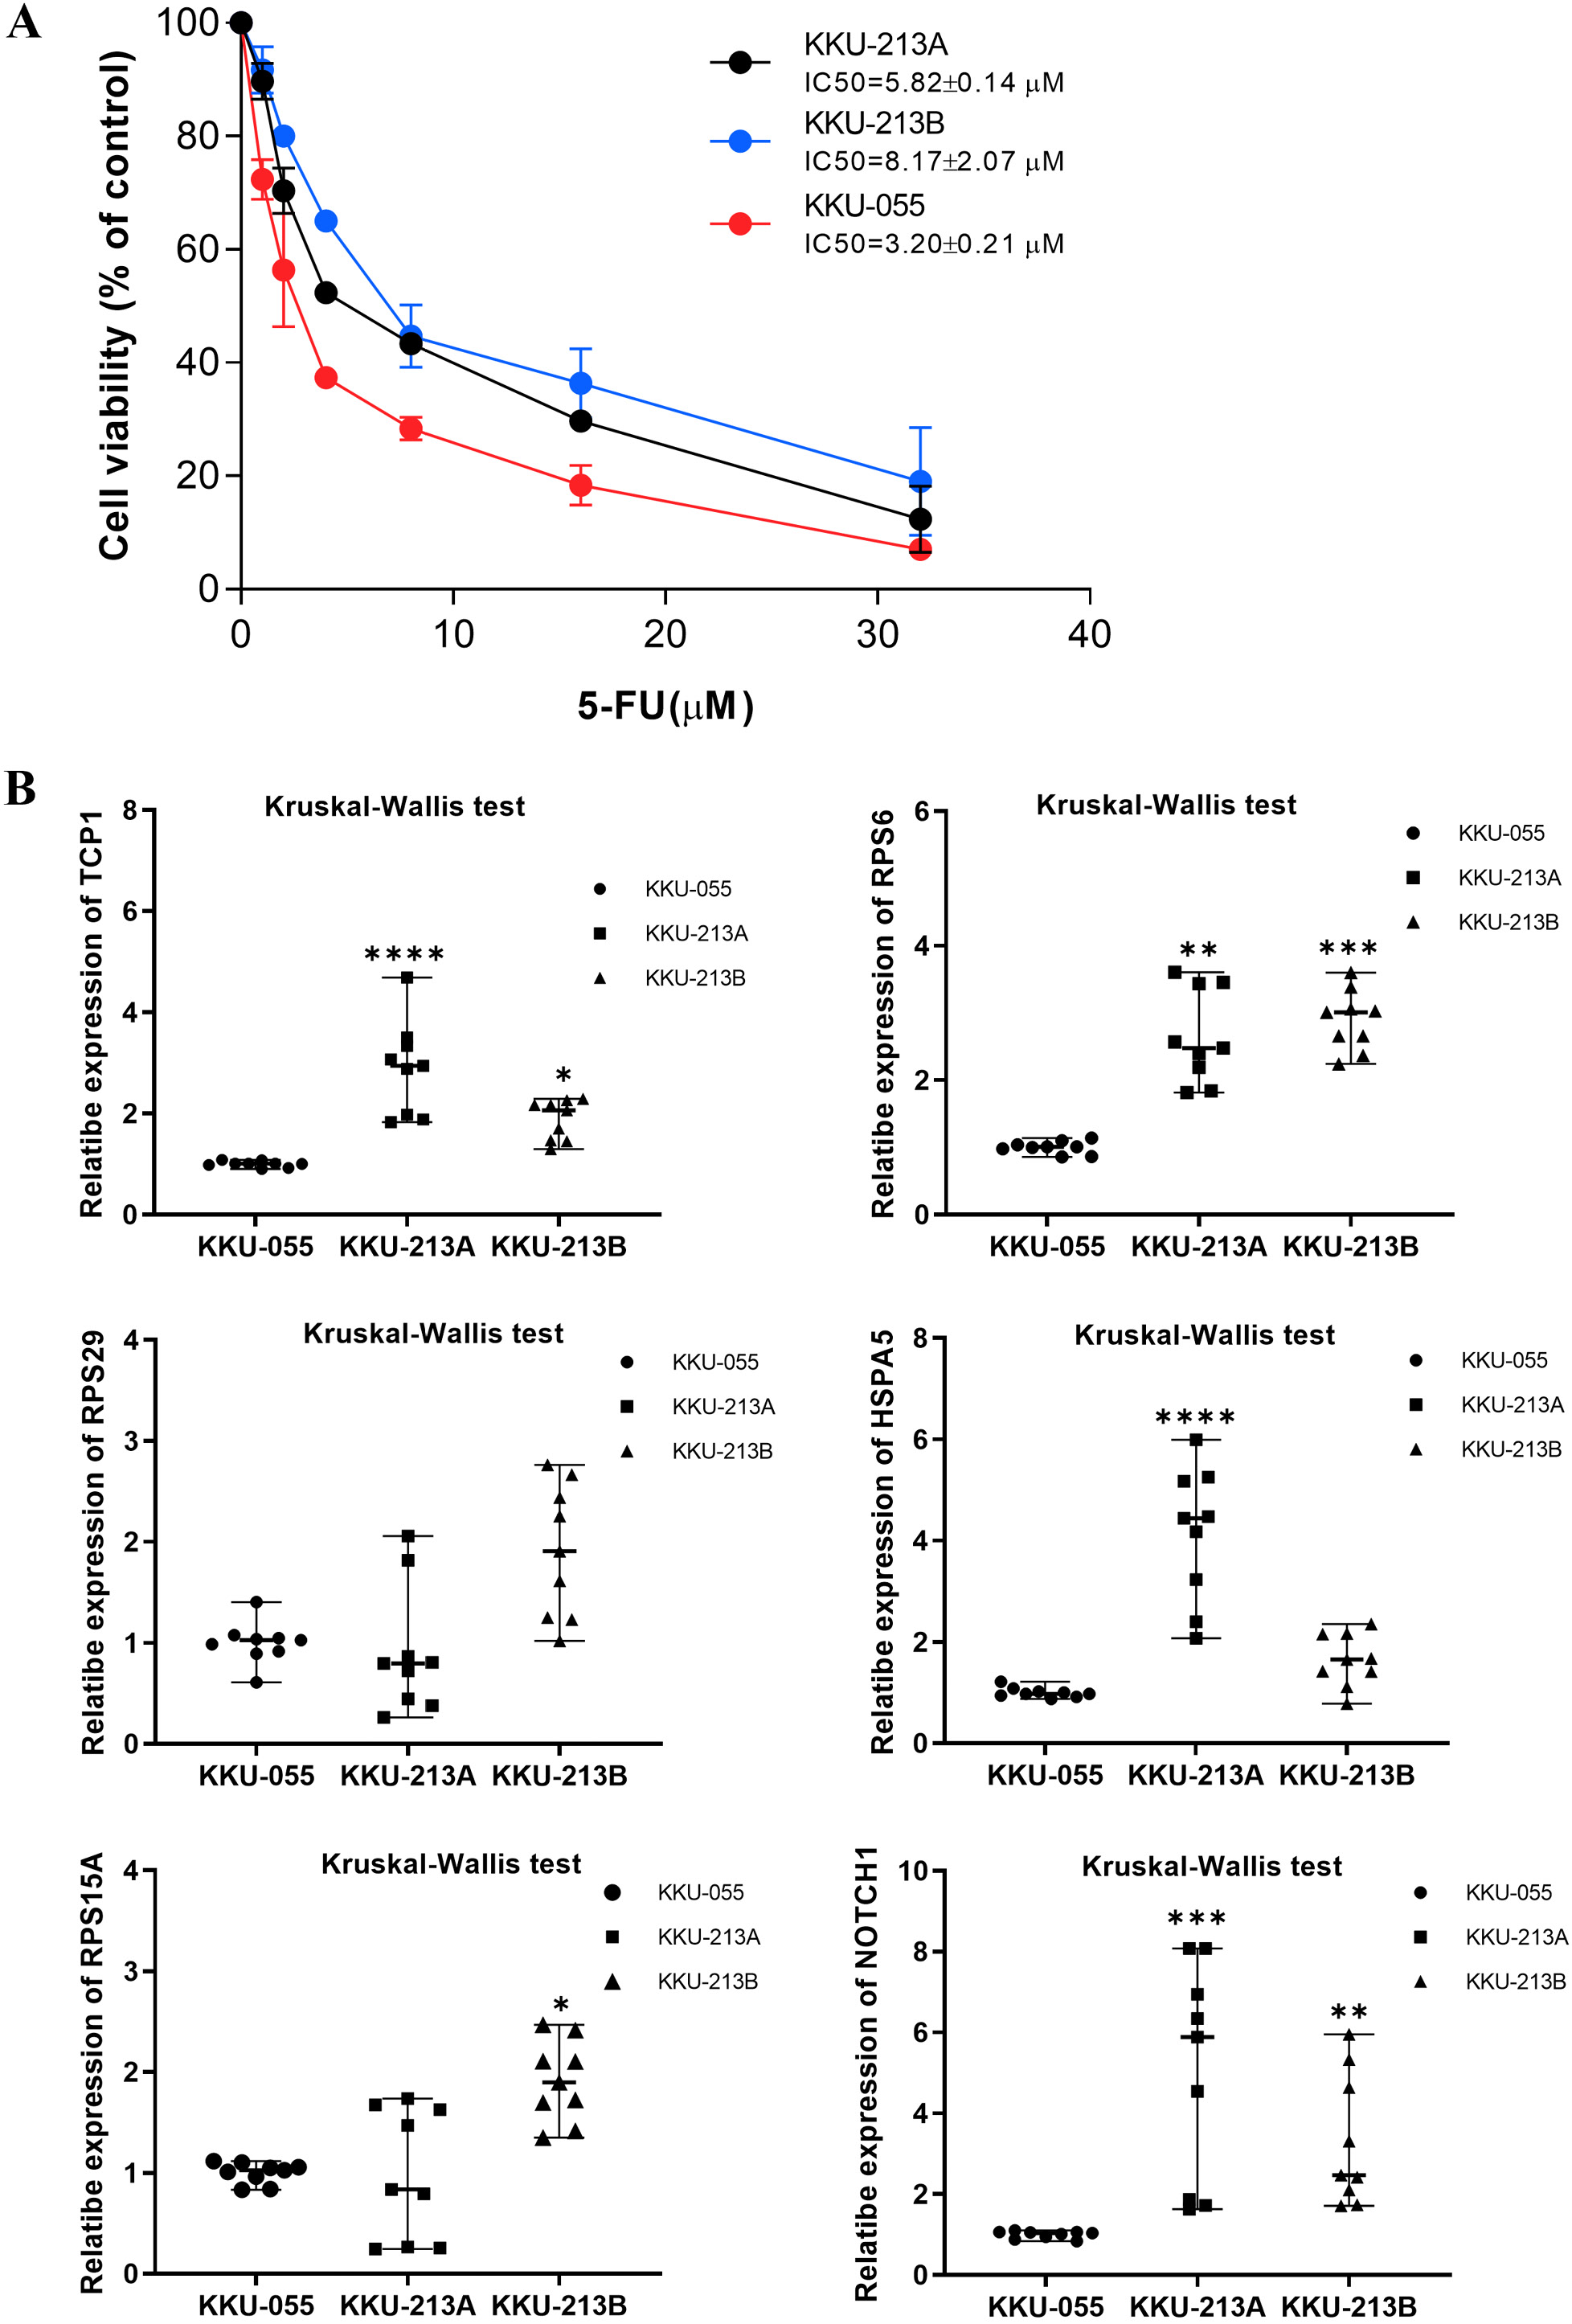
We next evaluated whether mRNA expression of the 6 upregulated hub genes correlated with 5-FU sensitivity in 3 CCA cell lines. KKU-055, KKU-213A, and KKU-213B were treated with increasing concentrations of 5-FU for 72 h, and cell viability was assessed by MTT assay. Dose–response curves demonstrated differential inhibition of proliferation: KKU-055 exhibited a low IC50 and was classified as 5-FU-sensitive, whereas KKU-213A and KKU-213B displayed significantly higher IC50 values and were deemed 5-FU-insensitive (Figure 7A).
Real-time PCR analysis of the 6 upregulated hub genes in CCA cell lines revealed that, of these candidates, TCP1 (Kruskal–Wallis H = 19.65, p < 0.001), RPS6 (H = 19.65, p < 0.001), and NOTCH1 (H = 17.92, p < 0.001) were significantly more abundant in the 5-FU-insensitive lines (KKU-213A and KKU-213B) than in the 5-FU-sensitive line (KKU-055) (Figure 7B). Median expression values with interquartile ranges for all 6 genes are provided in Supplementary Table 4.
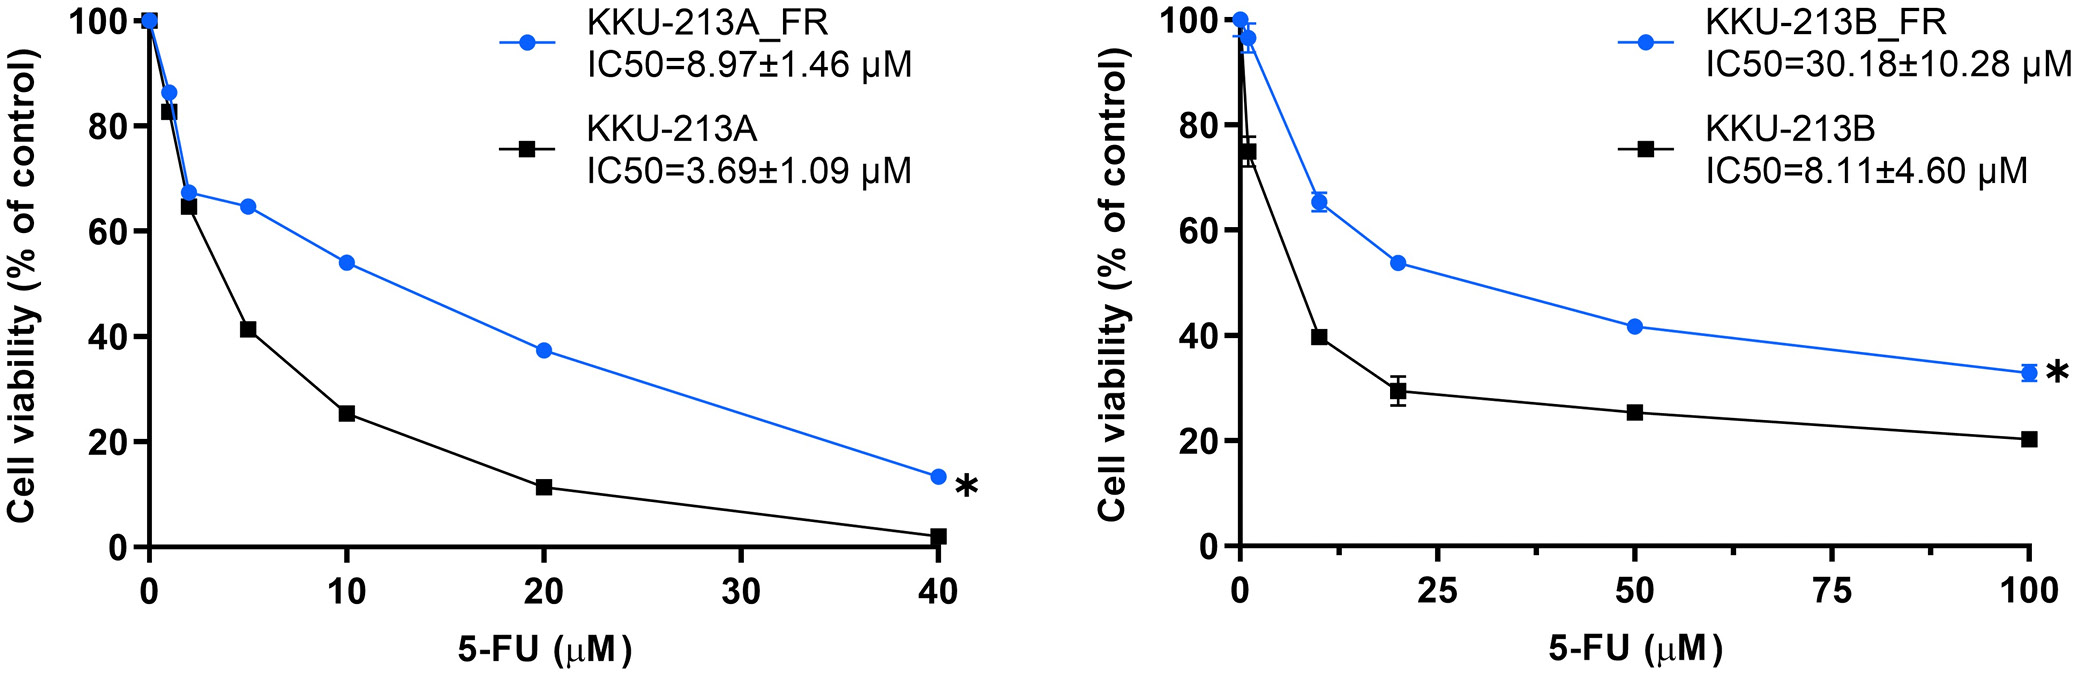
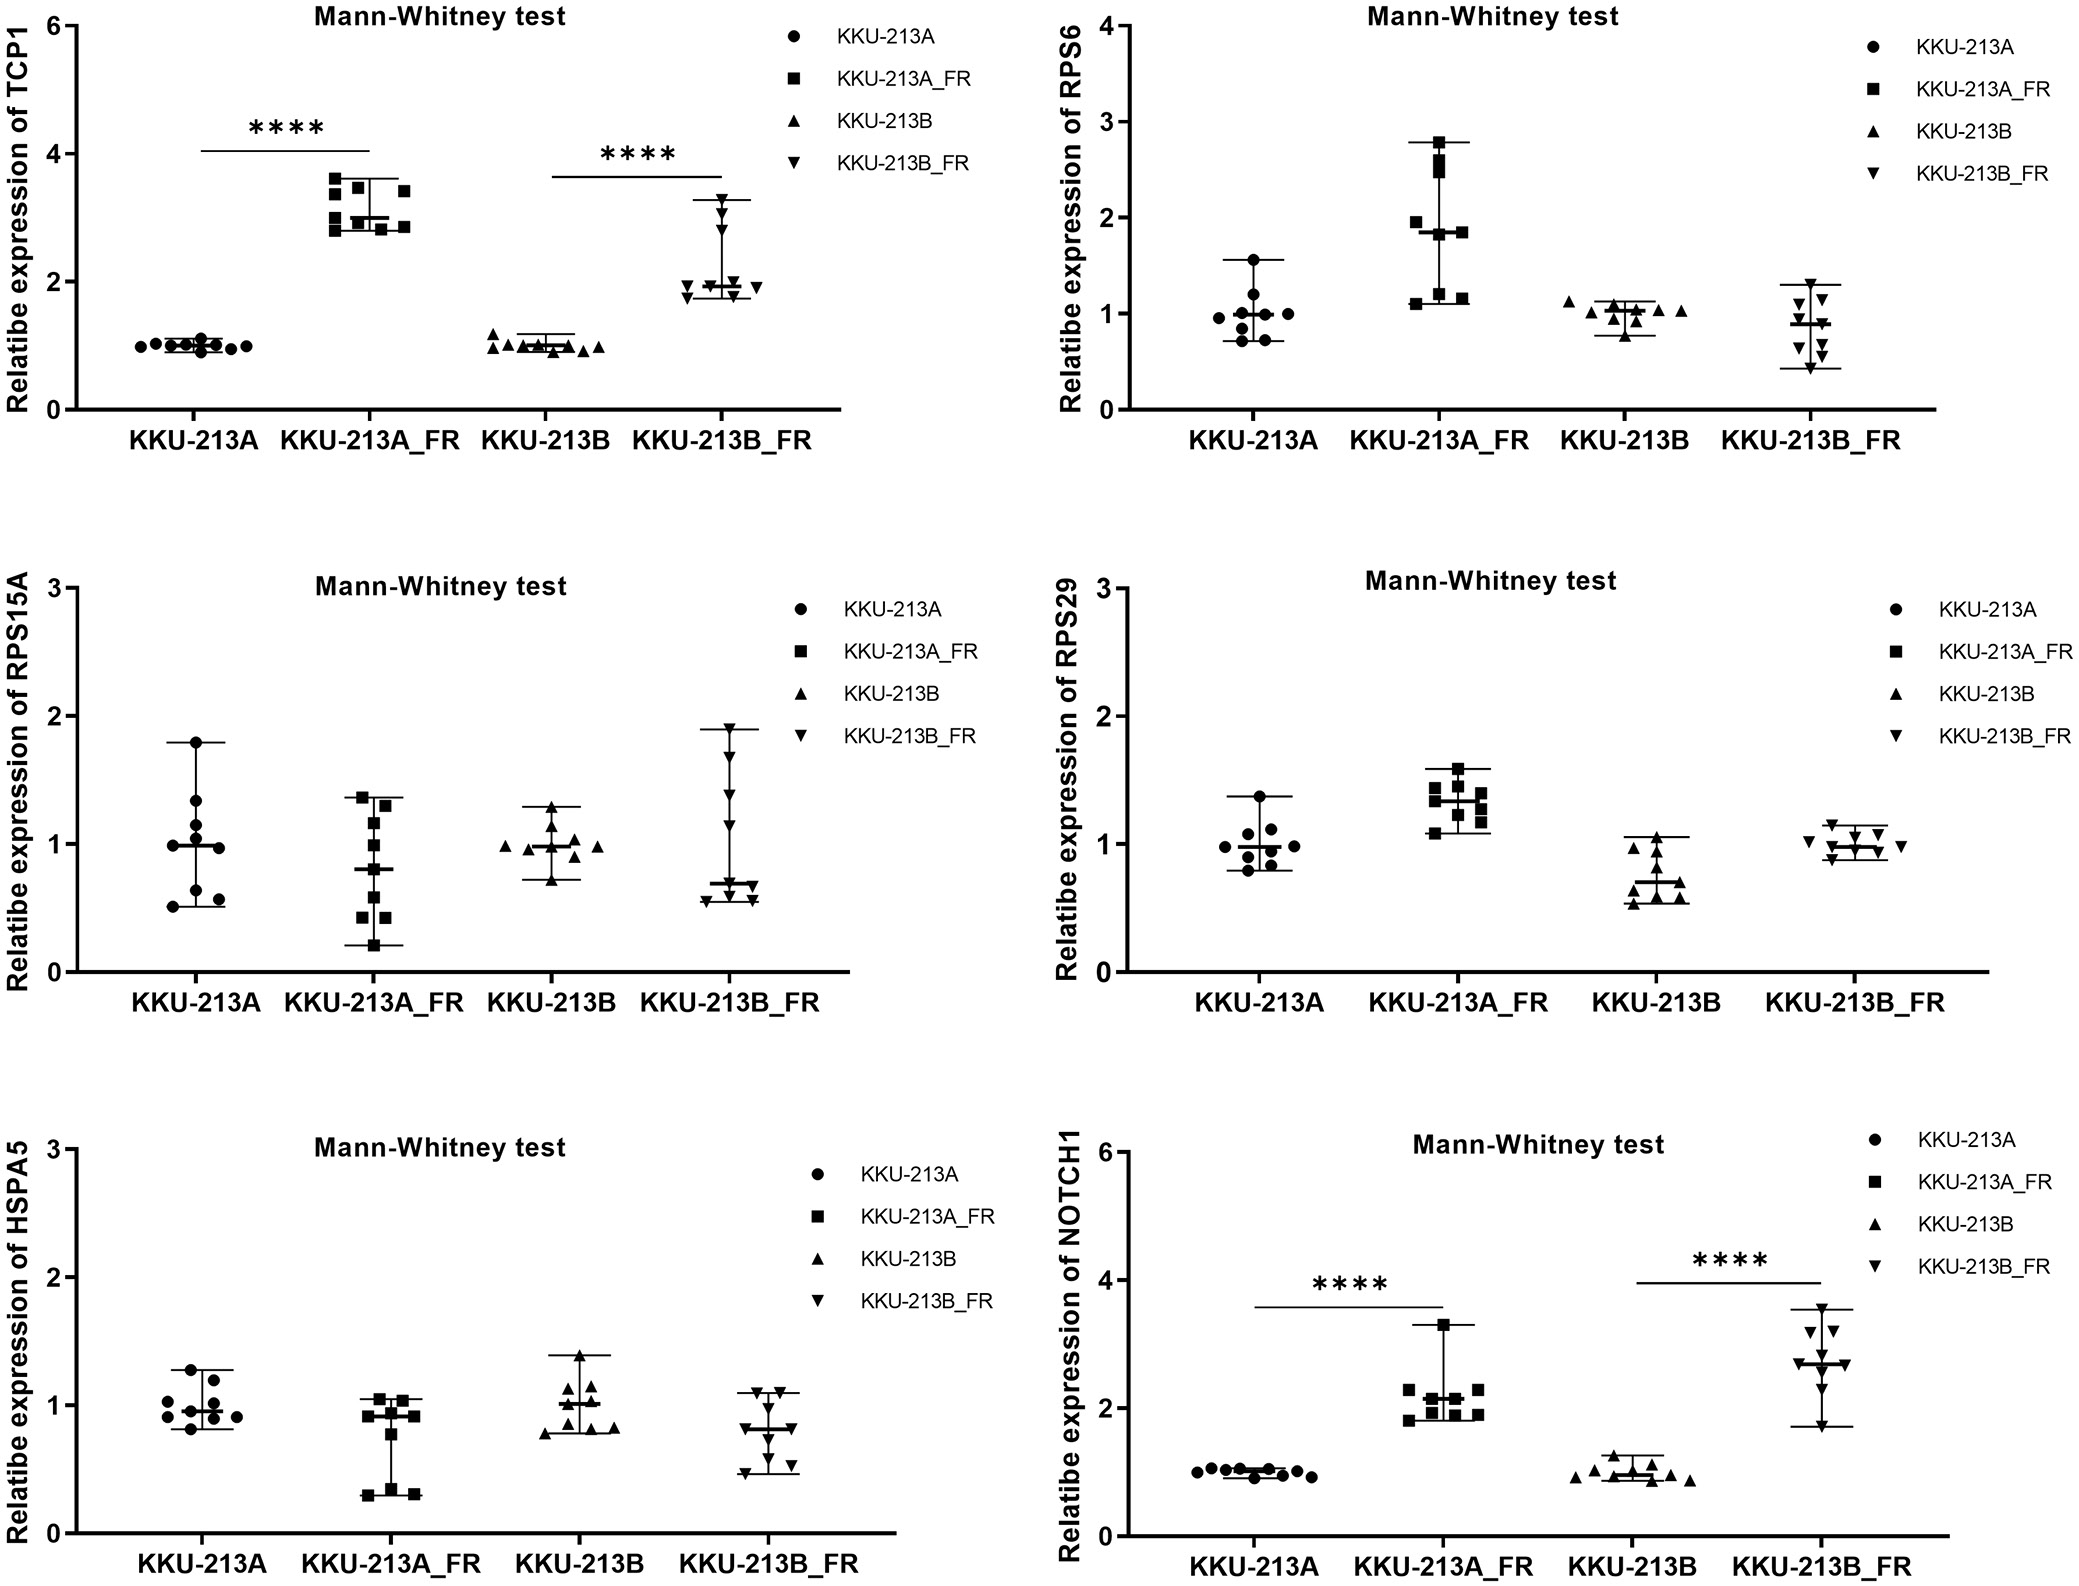
To further validate the link between mRNA expression of the 6 hub genes and 5-FU resistance, we compared parental CCA cell lines (KKU-213A, KKU-213B) with their 5-FU-resistant counterparts (KKU-213A-FR, KKU-213B-FR). As anticipated, the resistant sublines exhibited significantly reduced sensitivity to 5-FU vs their parental lines, as shown by Wilcoxon matched-pairs signed-rank tests (KKU-213A vs KKU-213A-FR: Z = –2.366, p = 0.018; KKU-213B vs KKU-213B-FR: Z = –2.201, p = 0.028) (Figure 8).
Consistent with our earlier findings, TCP1 and NOTCH1 mRNA levels were markedly higher in the 5-FU-resistant sublines than in their parental counterparts. Specifically, TCP1 expression was significantly elevated in KKU-213A-FR vs KKU-213A (M–W U: Z = –3.576, p < 0.001) and in KKU-213B-FR vs KKU-213B (Z = –3.582, p < 0.001). Similarly, NOTCH1 levels were substantially increased in KKU-213A-FR compared to KKU-213A (Z = –3.580, p < 0.001) and in KKU-213B-FR compared to KKU-213B (Z = –3.576, p < 0.001) (Figure 9). Median values with interquartile ranges (IQR) are detailed in Supplementary Table 5.
Potential therapeutics for TCP1 and NOTCH1 were identified using PanDrugs analysis; however, only NOTCH1 has clinically approved, direct inhibitors available (Table 4).
Discussion
Chemoresistance to 5-FU poses a major obstacle in cholangiocarcinoma therapy.18, 19 Targeting the molecular drivers of this resistance offers a promising strategy to restore drug sensitivity. In the present study, we integrated bioinformatics analyses with PCR validation to identify TCP1 and NOTCH1 as novel mediators of 5-FU resistance in CCA. Both genes were consistently upregulated in stable 5-FU-resistant sublines compared to their parental counterparts, confirming their potential as therapeutic targets.
Chaperonin containing T-complex polypeptide 1 subunit 1 (TCP1) is a key molecular chaperone that facilitates the proper folding of nascent and stress-denatured proteins. In our study, TCP1 was markedly upregulated in 5-FU-resistant CCA cell lines, implicating it as a driver of chemoresistance. This finding is in line with reports from other malignancies, where TCP1 stabilizes oncogenic client proteins and augments pro-survival signaling. For example, in ovarian cancer, TCP1 promotes tumor cell proliferation, invasion, and migration through activation of the PI3K/AKT/mTOR pathway.20
The expression of TCP1 has been linked to upregulation of oncogenes such as MYC, CCND1, and CDK2, promoting breast cancer progression.21 Although its role in 5-FU resistance remains unproven, TCP1 overexpression correlates with poor responses to chemotherapy across multiple malignancies. Elevated TCP1 levels confer resistance to doxorubicin and paclitaxel in breast and lung _cancer cell lines, while TCP1 knockdown reduces X-linked inhibitor-of-apoptosis protein (XIAP) and β-catenin expression and inhibits metastatic behavior both in vitro and in vivo.22
TCP1 has been shown to enhance adriamycin resistance in acute myeloid leukemia by promoting autophagy via AKT/mTOR pathway activation. In the context of 5-FU resistance, key mediators include XIAP, β-catenin, and the AKT/mTOR signaling axis. XIAP, a potent inhibitor of apoptosis, blocks caspase activation, and its overexpression correlates with increased resistance to both radiotherapy and chemotherapy.23 Activation of the Wnt/β-catenin pathway has been implicated in 5-FU resistance in oral squamous cell carcinoma and colorectal cancer24, 25 while hyperactivation of AKT/mTOR signaling is a hallmark of 5-FU-resistant colorectal tumors. By targeting TCP1, which sits upstream of these critical pro-survival networks, it may be possible to disrupt autophagy-mediated drug resistance mechanisms and improve therapeutic outcomes in CCA and other malignancies.
Notch signaling is an evolutionarily conserved pathway that governs development, cell-fate determination, and tissue homeostasis through ligand–receptor interactions between the 4 Notch receptors (NOTCH1–4) and their cognate ligands (Jagged1, Jagged2, and Delta-like ligands).26, 27 Aberrant Notch activation contributes to tumorigenesis and cancer progression by upregulating oncogenic transcription factors (e.g., MYC, NF-κB), dysregulating cell-cycle regulators (such as p21, p27, cyclin D1, and CCND3), and enhancing expression of antiapoptotic proteins (including BCL-2 and survivin).27
In intrahepatic cholangiocarcinoma (ICC), NOTCH1 is markedly overexpressed compared with normal biliary epithelium, and its suppression induces apoptosis in ICC cell lines, indicating that NOTCH1 promotes tumor cell survival by inhibiting apoptotic pathways28. Likewise, JAGGED1 expression is elevated in ICC tissues relative to adjacent non-neoplastic mucosa.29 More broadly, aberrant Notch signaling, especially via NOTCH1, drives chemoresistance across multiple malignancies. For example, in esophageal squamous cell carcinoma, NOTCH1-high KYSE70 cells display significantly greater resistance to 5-FU than NOTCH1-negative KYSE450 cells, and NOTCH1 knockdown restores 5-FU sensitivity in KYSE70 cells.30
Knockdown of NOTCH1 in CCA cell lines (RBE and HCCC-9810) significantly enhanced 5-FU sensitivity by downregulating the drug-efflux transporters ABCB1 and MRP1, which are key mediators of chemoresistance. Given NOTCH1’s role in promoting resistance to multiple chemotherapeutics, including 5-FU, its inhibition may represent a viable strategy to resensitize CCA cells and improve treatment outcomes. Several NOTCH1 inhibitors are currently undergoing clinical evaluation, such as the γ-secretase inhibitor nirogacestat,31 the anti-NOTCH1 monoclonal antibody brontictuzumab,32 and the oral inhibitor crenigacestat.33
In our study, NOTCH1 was markedly upregulated in 5-FU-resistant CCA cell lines compared with their parental counterparts, implicating NOTCH1 activation in the maintenance of chemoresistance. Importantly, co-treatment with 5-FU and pharmacologic NOTCH1 inhibitors, such as the γ-secretase inhibitor nirogacestat,31 the anti-NOTCH1 antibody brontictuzumab,32 or the small-molecule crenigacestat,33 has been shown to restore drug sensitivity in CCA models. These findings support the therapeutic potential of combining NOTCH1 blockade with 5-FU to overcome resistance and improve clinical outcomes.
The identification of TCP1 and NOTCH1 as key mediators of 5-FU resistance in CCA cells opens up new avenues for therapeutic intervention. Targeting TCP1 with small-molecule inhibitors or RNA-based therapies could disrupt its role in stabilizing oncogenic proteins and sensitizing cancer cells to 5-FU. Similarly, the use of NOTCH1 inhibitors, such as brontictuzumab or crenigacestat, which are currently in clinical trials for other cancers, may enhance the efficacy of 5-FU in CCA. Combination therapies that include 5-FU and inhibitors of TCP1 or NOTCH1 could be explored in preclinical models to evaluate their potential to overcome chemoresistance and improve treatment outcomes.
Limitations
Further research is required to validate these findings in the tissues of CCA patients with resistance to 5-FU treatment vs 5-FU sensitive patients.
Conclusions
This study is the 1st report to identify TCP1 and NOTCH1 as key molecules associated with 5-FU resistance in CCA. Our findings suggest that the overexpression of these genes contributes to chemoresistance through mechanisms such as protein folding, cellular stress response, and drug efflux regulation. Importantly, targeting TCP1 and NOTCH1 holds promise as a strategy to overcome 5-FU resistance and improve therapeutic outcomes in CCA patients. Future studies should validate these findings in clinical samples and explore the efficacy of combining NOTCH1 inhibitors with 5-FU in preclinical models. These efforts could pave the way for novel therapeutic interventions that enhance the effectiveness of chemotherapy and address the pressing challenge of chemoresistance in CCA.
Data availability statement
The transcriptomic datasets from stable 5-FU-resistant cancer cell lines and Thai CCA patient tissues were retrieved from the GEO database and are openly available in Figshare [https://dx.doi.org/10.6084/m9.figshare.27139791].