Abstract
Background. Hepatocellular carcinoma (HCC) shows significant differences in incidence and mortality between genders.
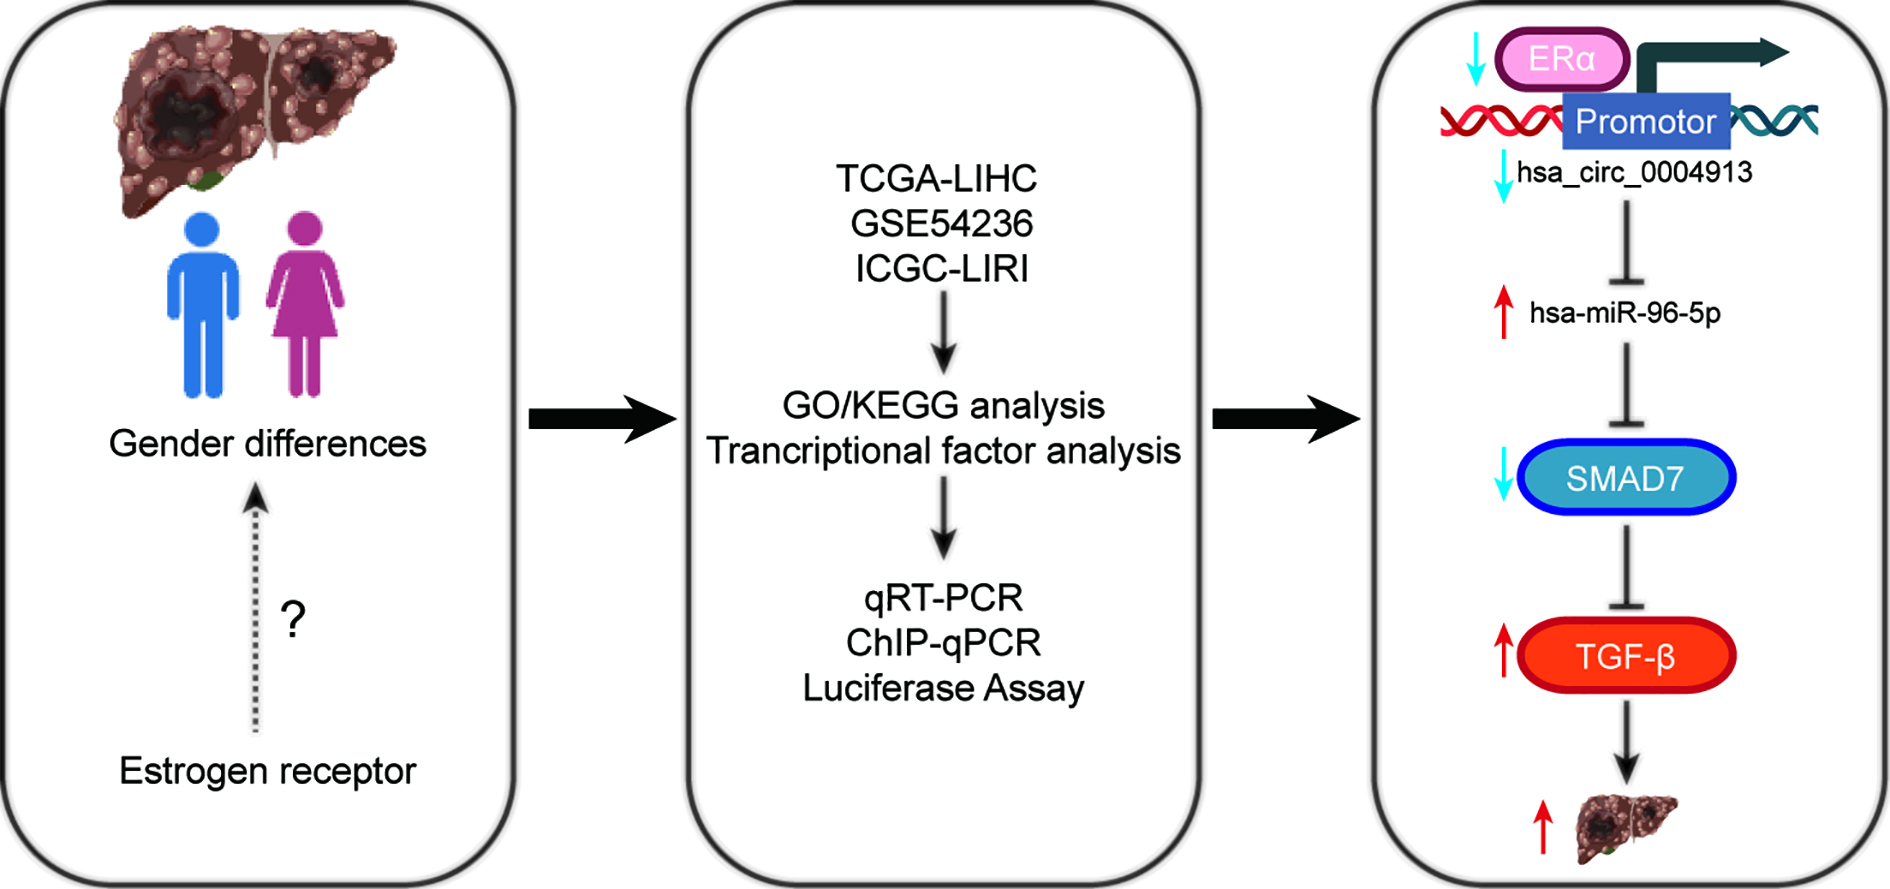
Objectives. This study investigates the mechanisms by which estrogen receptors (ER), specifically ERα, influence HCC outcomes.
Materials and methods. Bioinformatics approaches were used to study estrogen and its related pathways in relation to HCC. Estrogen receptor expression levels, along with downstream circular RNAs (circRNAs) and microRNAs (miRNAs), were measured in MHCC97H cells via quantitative reverse transcription polymerase chain reaction (RT-qPCR). Western blot was used to assess estrogen receptor 1 (ESR1) and SMAD family member 7 (SMAD7) protein expression. Cell proliferation, migration and cell cycle status of MHCC97H cells were measured using Cell Counting Kit-8 (CCK-8), Transwell assays and flow cytometry for cell cycle analysis.
Results. Bioinformatics analysis revealed that ERα acts as a transcription factor (TF) for 9 circRNAs with differential expression in HCC. We constructed the ERα/circRNA/miRNA/SMADs network based on the downstream targets of circRNAs, which were associated with the SMADs family. Survival studies revealed that ESR1 is correlated with favorable patient survival in liver cancer. In MHCC97H cells, qRT-PCR findings showed low expression of ESR1, hsa_circ_0004913 and SMAD7, but significant expression of hsa-miR-96-5p. Overexpression of ESR1 significantly increased the expression of hsa_circ_0004913 and SMAD7 while suppressing hsa-miR-96-5p. Western blot analysis confirmed these findings. Furthermore, ESR1 overexpression reduced MHCC97H cell proliferation and migration while inhibiting growth through G1 phase arrest. ESR1 acts as a TF that binds to the promoter of hsa_circ_0004913, as demonstrated using chromatin Immunoprecipitation followed by chromatin immunoprecipitation-quantitative real-time PCR (ChIP-qPCR). A dual-luciferase reporter experiment confirmed that hsa_circ_0004913 targets and regulates hsa-miR-96-5p.
Conclusions. ERα can function as aTF, modulating the expression of various circRNAs with differential expression in HCC. Through this regulation, it modulates the circRNA/miRNA/SMADs network, thereby inhibiting the progression of HCC.
Key words: hepatocellular carcinoma, ceRNA network, transcription factor, estrogen receptor alpha, circular RNAs
Background
Liver cancer was the 6th most common cancer worldwide in 2022 and the 3rd leading cause of cancer-related deaths, with hepatocellular carcinoma (HCC) accounting for 75–85% of cases.1 The prognosis of HCC is closely associated with the stage of the disease. While advancements in targeted immunotherapy have improved survival rates in recent years, 2023 cancer statistics indicate that the 5-year survival rate for HCC remains low. Specifically, it is approx. 36% for early-stage cases and only 13% for advanced metastatic cases.2 Furthermore, HCC ranks as the 2nd leading cause of cancer mortality among men. In most regions globally, the incidence and mortality rates of HCC are 2–3 times higher in men than in women.1 Research has shown that the duration of estrogen exposure and the age at which HCC first appears are positively correlated, with a notable increase in HCC incidence observed among postmenopausal women.3 Research by O’Brien et al. revealed a significant rise in HCC prevalence in female mice following ovariectomy. Additionally, female mice with knockout ESR1 genes, which encode the estrogen receptor alpha (ERα), exhibited a 9-fold increase in HCC incidence. In contrast, the absence of the ESR2 gene, encoding the estrogen receptor beta (ERβ), did not influence HCC development.4 These findings suggest that the estrogen signaling pathway, mediated by ERα, could be a crucial target for HCC therapy. However, the exact mechanisms remain unclear, highlighting the need for further investigation into the role and regulatory pathways of the estrogen signaling system in HCC.
The circular RNAs (circRNAs) are evolutionarily conserved non-coding RNAs that form circular structures without 3’ or 5’ ends.5 The unique closed-loop conformation of circRNAs imparts a higher degree of stability compared to most linear RNAs, and these molecules demonstrate significantly differential expression between malignant tissues and their adjacent non-malignant counterparts.1 Unbalanced circRNA expression has been found as a possible biomarker for HCC diagnosis and treatment targeting.6, 7 Recent studies have shown that circRNAs can act as “gene sponges” for miRNAs, indirectly influencing the expression of miRNA target genes through competitive binding interactions.8 MiRNAs are key regulators of gene expression at the post-transcriptional level, exerting their effects by base pairing with target sequences in the 3’UTR of messenger RNAs. They play an integral role in the pathogenesis of liver cancer.9, 10 Nevertheless, although these studies have elucidated the downstream regulatory mechanisms of circRNAs, the upstream regulatory mechanisms and the factors regulating circRNAs expression remain unclear. Wang et al. demonstrated that circCCDC66 was significantly elevated in non-small cell lung cancer, with STAT3 directly interacting with the circCCDC66 promoter to enhance its transcriptional activity.11 Our preliminary bioinformatics analysis suggests that ERα may serve as a transcription factor (TF) for several circRNAs that are differentially expressed in HCC tissues.
Objectives
Based on the above findings, we hypothesized that ERα, acting as a, regulates the production of circRNAs associated with HCC, thereby influencing its progression. The SMAD family plays an important role in the transition from liver fibrosis to HCC and has emerged as a prominent area of emphasis in liver cancer research.12
We employed bioinformatics methodologies to construct the ERα/circRNA/miRNA/SMADs network. A substantial body of evidence suggests that several coding and non-coding RNAs within this network, including hsa_circ_0004913, hsa-miR-96-5p and SMAD proteins, are involved in the development of HCC.12, 13, 14, 15, 16
SMAD7 acts as a suppressive element in HCC. A Kaplan–Meier analysis of HCC patients indicated that higher expression levels of SMAD7 were associated with longer survival durations.17 Moreover, previous research has shown that hsa-miR-96-5p may inhibit SMAD7 expression through target regulation.18, 19 Consequently, the present study focuses on the ERα/hsa_circ_0004913/hsa-miR-96-5p/SMAD7 axis, aiming to elucidate the mechanisms by which ERα, as a TF for circular RNAs (circRNAs), regulates the ERα/circRNA/miRNA/SMADs network to inhibit HCC progression.
Materials and methods
Ethics approval and consent to participate
Our study is based on publicly available data from open-source databases. The Tongde Hospital of Zhejiang Province (Hangzhou, China) does not require ethics committee review for research utilizing publicly available data. As a result, our study does not raise any ethical concerns or conflicts of interest.
Bioinformatics analysis
The Hepatocellular Carcinoma Database (HCCDB; http://lifeome.net/database/hccdb/home.html) was used to investigate the expression of ESR1 in liver tumors and neighboring normal tissues, as well as in normal liver tissues. The Cancer Genome Atlas (TCGA; https://portal.gdc.cancer.gov) database was utilized to compare the difference in overall survival (OS) between HCC patients in various expression groups. The circRNA expression data for HCC were retrieved from the Gene Expression Omnibus (GEO) database (https://www.ncbi.nlm.nih.gov/geo) using the keywords “circRNA” and “hepatocellular carcinoma”. Furthermore, the circRNA names were standardized according to the circBase database (http://www.circbase.org). All GEO data sets were analyzed using R v. 4.2.2 (R Foundation for Statistical Computing, Vienna, Austria) and the limma package. Only circRNAs with a log2 > 2 and p < 0.05 were selected. The circRNA promoter sequence was retrieved from the University of California Santa Cruz (UCSC) database (http://genome.ucsc.edu). To anticipate possible TFs, we utilized the JASPAR database (http://jaspar.genereg.net). The target miRNAs of the circRNA were predicted using the online tool circBank (https://www.circbank.cn/#/home). The target miRNAs of the circRNA were predicted using the online tool CircNetVis (https://www.meb.ki.se/shiny/truvu/CircNetVis/), retaining only the intersection of the prediction results from the Miranda and TargetScan databases for further analysis. Only those predicted by at least 2 of the databases to have potential regulatory effects were included in the study.
Cell culture and transfection
The Chinese Academy of Sciences Cell Bank (Shanghai, China) provided the human HCC cells (MHCC97H). The cells were grown at 37°C in a humidified atmosphere with 5% CO2 and were maintained in Dulbecco’s modified Eagle’s medium (DMEM) supplemented with 10% fetal bovine serum (FBS). ESR1-pcDNA3.1 plasmids and the corresponding control vectors were generated by Genecreate (Wuhan, China). MHCC97H cells were transfected using the Lipofectamine 2000 reagent (Invitrogen, Waltham, USA).
Total RNA preparation and RT-qPCR
Total RNA and miRNA were extracted from MHCC97H cells using the miRcute miRNA Isolation Kit (DP501; Tiangen, Beijing, China) following the manufacturer’s instructions. Briefly, 1 × 10⁵–107 cells were lysed with Lysis Buffer. RNA was transferred to miRspin columns and eluted after buffer washing. Reverse transcription was performed using the ReverTra Ace qPCR RT Kit (FSQ-101; Toyobo, Osaka, Japan) for mRNA and the miRNA 1st Strand cDNA Synthesis Kit (MR101-02; Vazyme, Nanjing, China) for miRNA. Quantitative reverse transcription polymerase chain reaction (RT-qPCR) was performed using SYBR®Green Real time PCR Master Mix (QPK-201; Toyobo) for mRNA and miRNA Universal SYBR qPCR Master Mix (MQ101-02; Vazyme) for miRNA, and Real-time PCR System (SLAN-48P; Hongshi, Shanghai, China). The relative expression levels of the target genes were determined using the 2^−ΔΔCt method. This method made it possible to compare the expression of the genes in relation to GAPDH (for mRNA) or U6 (for miRNA), the internal control gene. To ensure the reproducibility and reliability of the RT-qPCR results, each sample was amplified 3 times. Table 1 lists the specific primer sequences used in this study.
Cell Counting Kit-8 assay
A total of 1,000 cells were seeded into each well of a 96-well plate and incubated in a 5% CO2 incubator for 0, 24 and 48 h. Ten microliters of Cell Counting Kit-8 (CCK-8) solution (CCK-8 Cell Proliferation and Cytotoxicity Assay Kit, CA1210; Solarbio, Beijing, China) were added to each well, and the plates were incubated for an additional 30 min. After incubation, the absorbance was measured at approx. 450 nm using a microplate reader (MB-530; Heales, Shenzhen, China). The IC50 (half-maximal inhibitory concentration) values were calculated by fitting concentration-response curves using the 4-parameter method. The color intensity was found to be proportional to the number of viable cells, as living cells reduced the CCK-8 dye to a colored formazan product.
Transwell assay
Cells were trypsinized, resuspended in serum-free DMEM, and counted using a hemocytometer. A total of 1 × 10⁴ MHCC97H cells were seeded in the upper chamber of a 24-well Transwell insert (Corning Company, Corning, USA), while the lower chamber was filled with DMEM containing 10% FBS. The Transwell insert was then incubated in a humidified atmosphere of 5% CO2 at 37°C for 24 h to allow cell migration. After incubation, the insert was removed, and the medium was aspirated. Cells were fixed with 4% paraformaldehyde for 15 min and subsequently stained with 0.1% crystal violet for 20 min to visualize migrated cells. The insert was then rinsed 3 times with phosphate-buffered saline (PBS) to remove the unbound stain. A cotton swab was used to gently remove non-migrated cells from the upper surface of the membrane. Finally, migrated cells on the lower surface of the membrane were imaged under a light microscope (DSY5000X, COIC, Chongqing, China).
Flow cytometry assay for the cell cycle
After collecting and fixing the cell suspension, 5 mL of cold 70% ethanol was added, and the mixture was then incubated at 4°C overnight. Following 2 washes with 5 mL of PBS, the cells were stained for 10 min with 50 μg/mL propidium iodide (PI). After passing the suspension through a 300-mesh filter, it was centrifuged for 5 min at 1,000 rpm. To remove any remaining PI, 5 mL of PBS was used to rinse the cells. Subsequently, the cells were reconstituted in 200 μL of PBS and subjected to analysis using a Beckman Coulter flow cytometer (Beckman Coulter, Brea, USA).
Luciferase reporter assay
Both wild-type (WT) and mutant (MT) sequences were generated to investigate the role of hsa_circ_0004913 in cellular biology. Several recombinant reporter constructs were created by inserting these sequences into the pGL3 reporter gene vector. These recombinant reporters were then co-transfected into 293T cells along with hsa-miR-96-5p. Luciferase activity was precisely assessed 48 h after transfection using a dual-luciferase detection kit and the dual-luciferase reporter assay method. An internal control was included using the Renilla luciferase expression vector pRLTK (Takara, Beijing, China).
Chromatin immunoprecipitation-quantitative real-time PCR (ChIP-qPCR)
Following a seeding of MHCC97H cells (3 × 10⁶) on 100 mm dishes and treatment with 1% formaldehyde, 600 μL of radioimmunoprecipitation assay (RIPA) lysis solution was used to lyse the cells. The sonicator was used to separate genomic DNA and shear it into 20–600-bp pieces. The chromatin was precipitated and incubated for an overnight duration at 4°C using either immunoglobulin G (IgG; Beyotime Biotechnology, Shanghai, China) or ERα-antibodies (Abcam, Shanghai, China) after centrifugation and removal of supernatants. The immune complexes were then cleaned using several washing buffers, including Tris-EDTA buffer, high salt, low salt, and LiCl. The immune precipitates were cross-linked overnight at 65°C after being eluted with 500 μL of elution buffer. hsa_circ_0004913 promoter primers were used to amplify ESR1 binding sites. The promoter primers were as follow:
Primer 1:
forward (5’-ACTTCTCCCTCTGATACTCGTTCC-3’),
reverse (5’-ACTCCTCCTCCTTGATGCTGTAG-3’);
Primer 2:
forward (5’-GGGAAGTGAGGACCCTAAGAAGC-3’),
reverse (5’-AAAAGCCCTGGAGCCAAGAAG-3’);
Primer 3:
forward (5’-CGACTGACCGAGTATGGTATGG-3’),
reverse (5’-AGGAGGCAGGAAGTAGAGCGA-3’).
Ultimately, DNA was extracted following the method recommended by the manufacturer, and RT-qPCR was used for analysis.
Western blot analysis
For immunoblotting, cells were lysed using preheated 2% sodium dodecyl sulfate (SDS) and then boiled for 30 min. Protein concentrations were determined using a bicinchoninic acid (BCA) assay (CW0014S; CoWin Biotech, Taizhou, China). Proteins were separated using SDS-polyacrylamide gel electrophoresis (SDS-PAGE) and transferred to a nitrocellulose membrane (GE Healthcare, Chicago, USA) using the Genscript eBlot transfer technique. Membranes were blocked for 1 h at room temperature with 5% milk in 1× Tris-buffered saline with Tween-20 (TBST; 25 mM Tris, 150 mM NaCl, 2 mM KCl, pH 7.4, supplemented with 0.2% Tween-20) and probed overnight at 4°C with the indicated primary antibodies: ERα antibody (ab32063; Abcam) or SMAD7 antibody (25840-1-AP; Proteintech, Wuhan, China). After washing with TBST 3 times for 30 min, membranes were incubated with peroxidase-conjugated secondary antibodies (SA00001-2; Proteintech) at room temperature for 1 h. The membranes were washed with TBST 3 times and detection was performed using Sensitive Chemiluminescence Test Kit (S6008M; UElany, Suzhou, China)
Statistical analyses
The normality assumption was assessed using the Shapiro–Wilk test, and the homogeneity of variance was evaluated with Levene’s test. For data that met the test assumptions, differences between 2 groups were analyzed using the Student’s t-test, and comparisons among multiple groups were performed using one-way analysis of variance (ANOVA). For small-sample data with a sample size below 7, the Mann–Whitney test was used for comparisons between 2 groups, and the Kruskal–Wallis test was applied for comparisons among multiple groups. Statistical significance was defined as p < 0.05. The corresponding results are provided in the shared data. The time from patient death or a 5-year follow-up is defined as the OS time. Kaplan–Meier method and log-rank test were used for survival analysis, and receiver operating characteristic (ROC) curve analysis was used to evaluate the discriminatory power of biomarkers. To evaluate heterogeneity among datasets, we used Cochran’s Q test and the I2 statistic. A fixed-effect model was applied when heterogeneity was minimal (I2 < 50%), assuming a consistent effect size across datasets. Conversely, a random-effects model was employed for analyses with substantial heterogeneity (I2 ≥ 50%), accounting for between-study variability. Data analysis was performed using GraphPad Prism v. 7.0 (GraphPad Software, San Diego, USA), R v. 4.2.2 software (limma package v. 3.62.2; pheatmap package v. 1.0.12; survminer package v. 0.5.0) or IBM SPSS Statistics for Windows v. 24 (IBM Corp., Armonk, USA).
Results
ERα/circRNA/miRNA/SMADs network construction
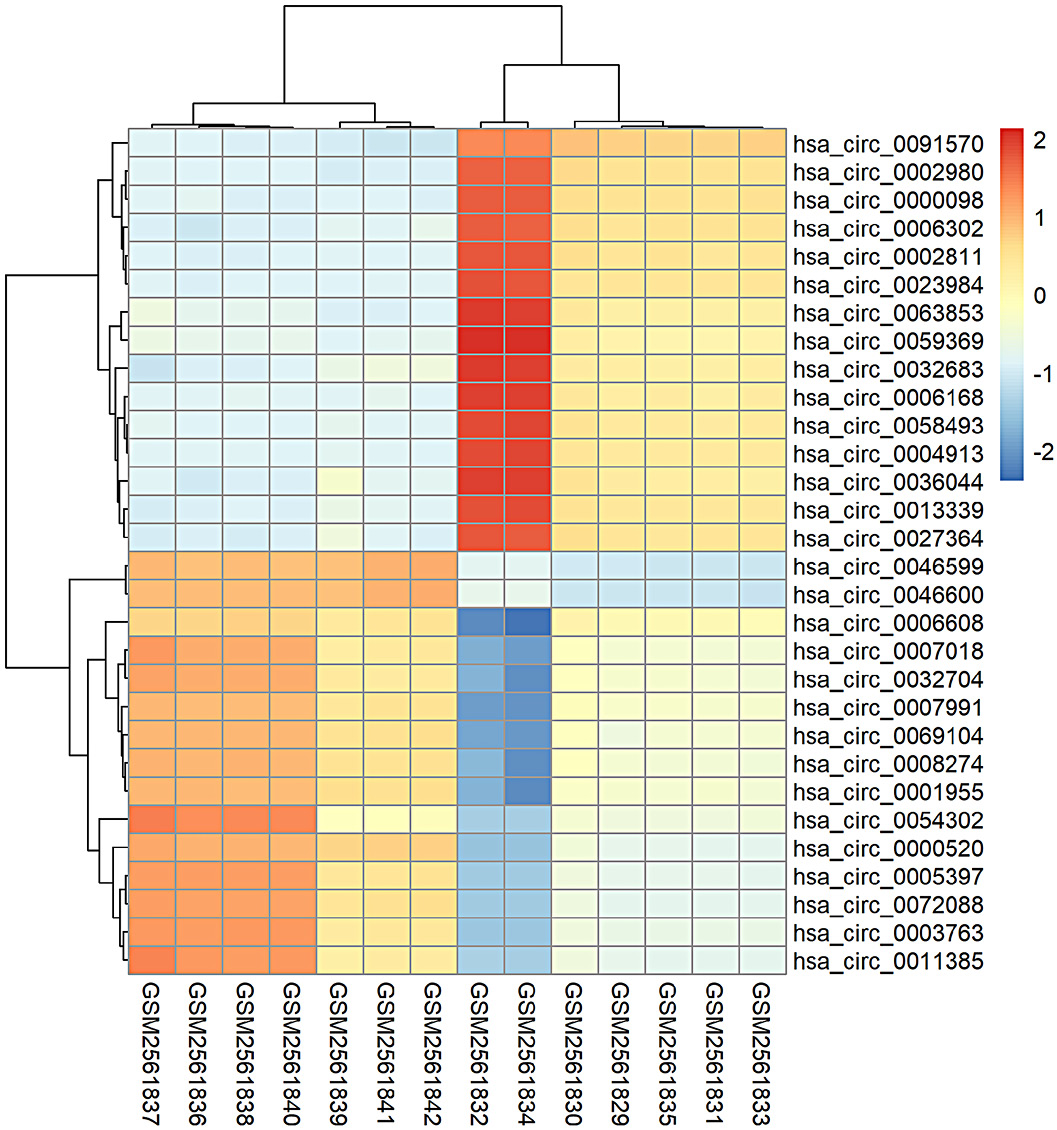
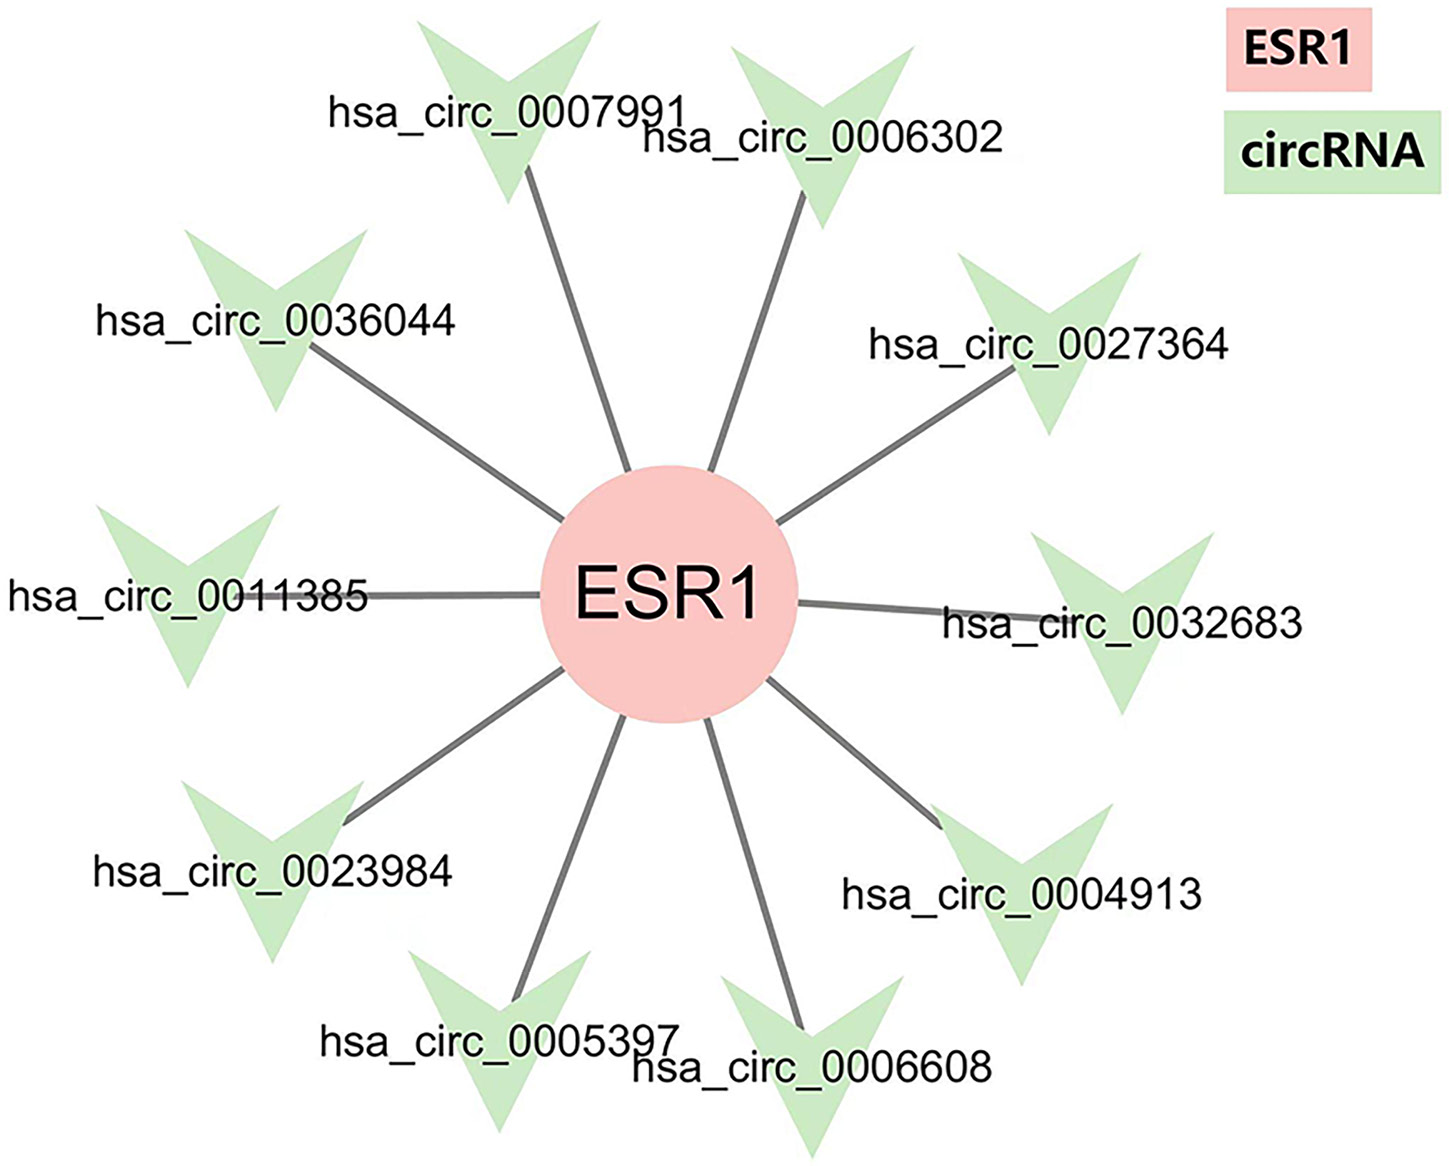
CircRNA data from GSE97332 microarrays in the GEO database were analyzed using R v. 4.2.2. The top 30 differentially expressed circRNAs between cancer tissues and paired normal tissues were selected, including 15 with high expression and 15 with low expression. A heatmap was generated to display the hierarchical clustering of circRNA expression values (Figure 1). The promoter sequence of circRNA was obtained from the UCSC database. The JASPAR database (https://jaspar.elixir.no) was used to predict potential TFs. ERα was the potential TF for 10 of these differentially expressed circRNA (Figure 2).
The target miRNAs of circRNA were predicted using the online tool circBank. In the miRwalk online tool, predicted SMADs that overlap in at least 2 of the following databases–miRPathDB, miRWalk, and TargetScan–were considered, with a score greater than 0.95. Cytoscape was used to construct the ERα/circRNA/miRNA/SMADs network. We identified 8 circRNAs that were differentially expressed in HCC and ultimately target the SMAD family (Figure 3).
Differential expression of the ERα/circRNA/miRNA/SMADs network is associated with poor prognosis in HCC
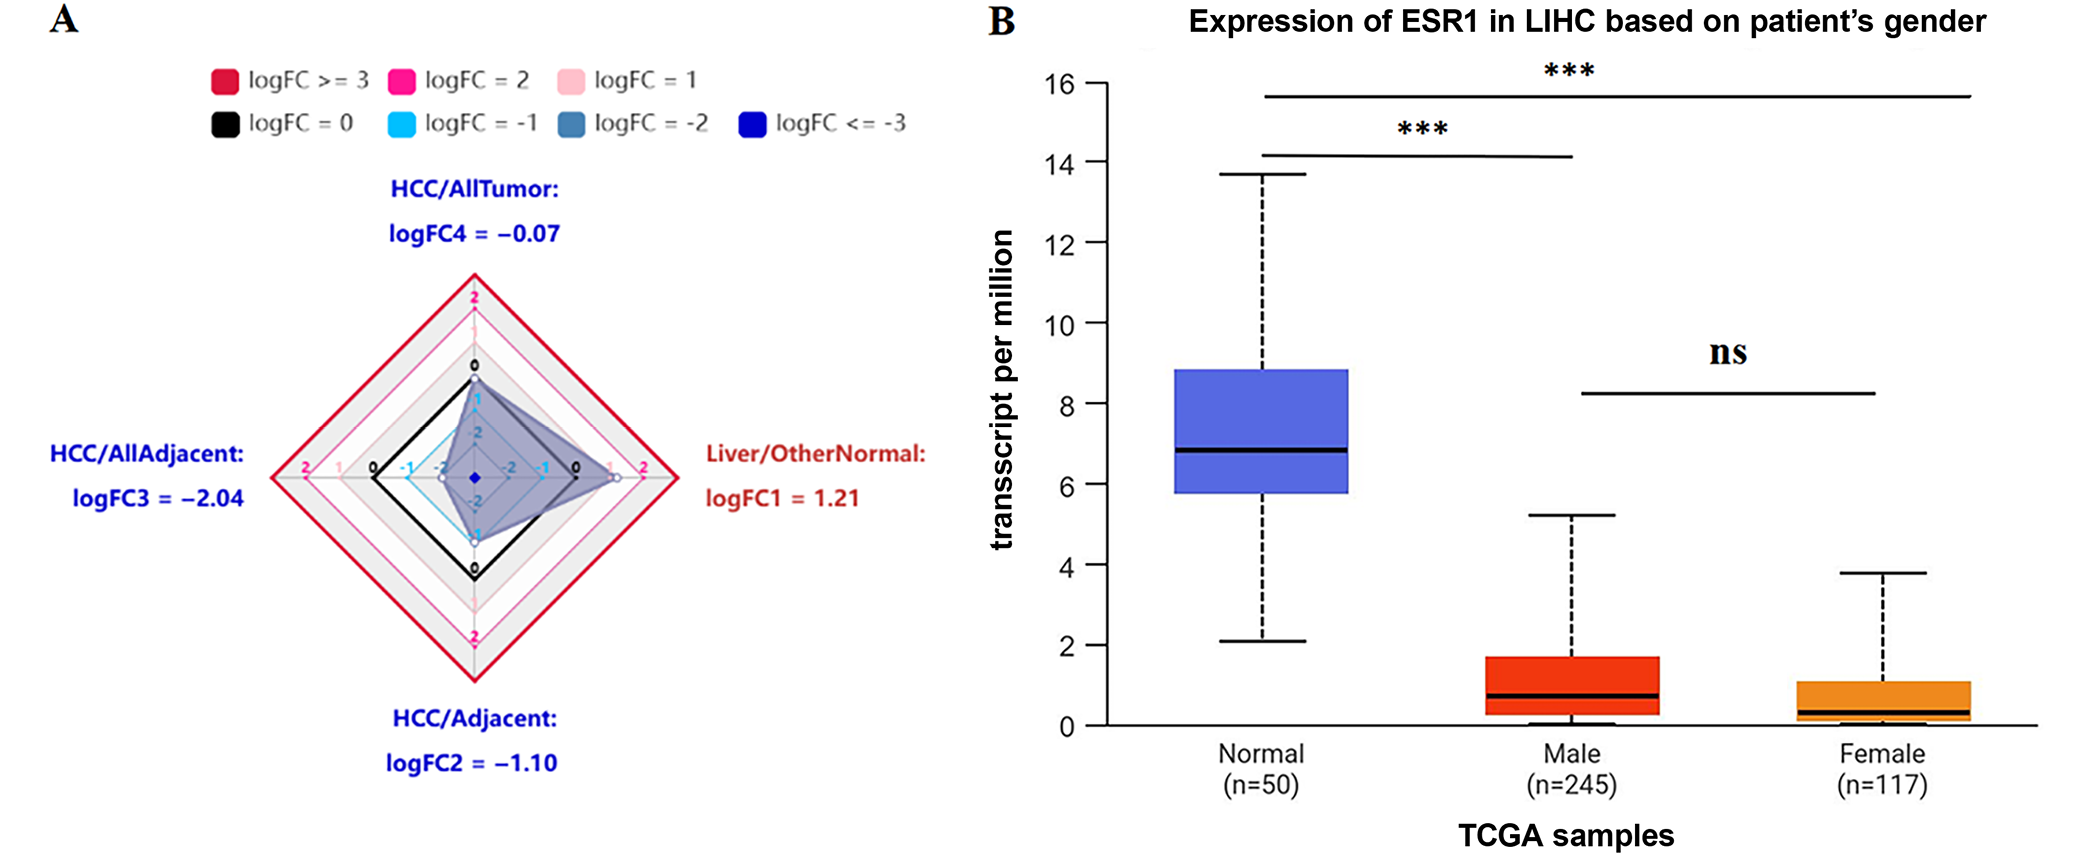
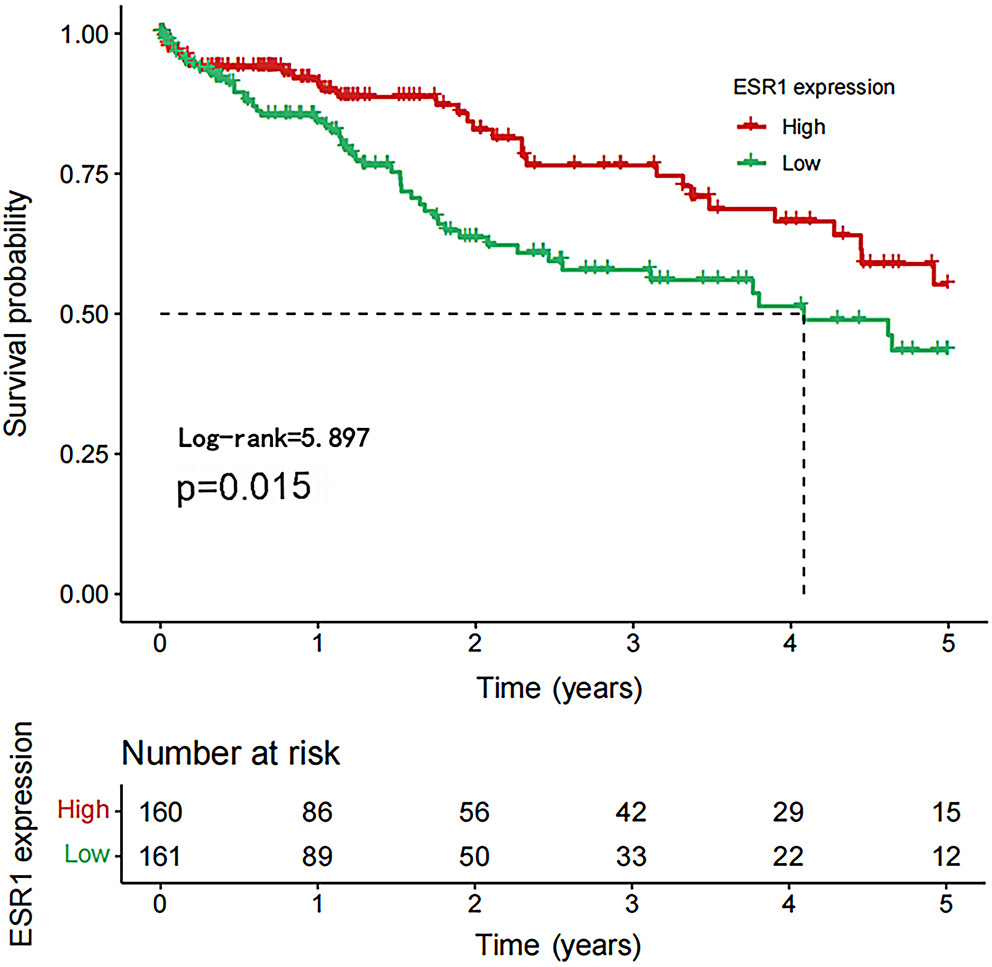
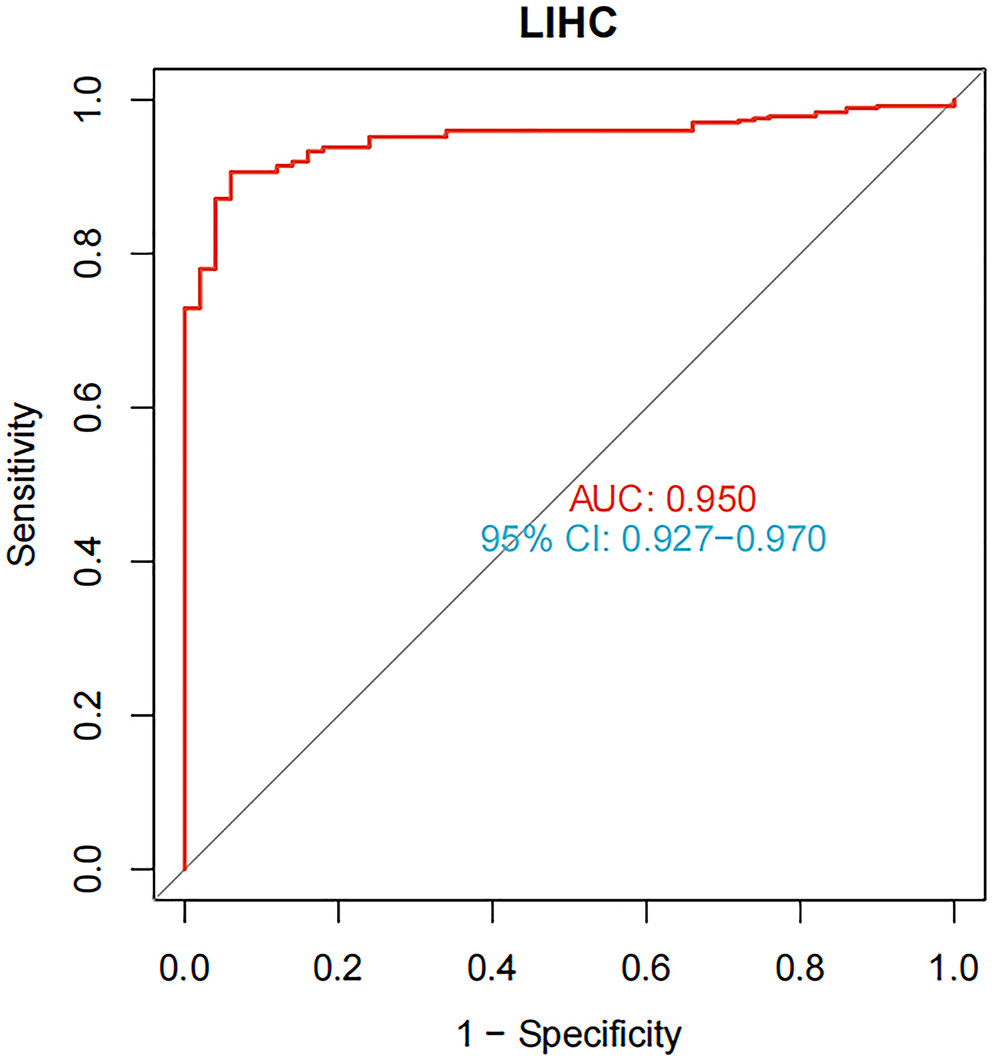
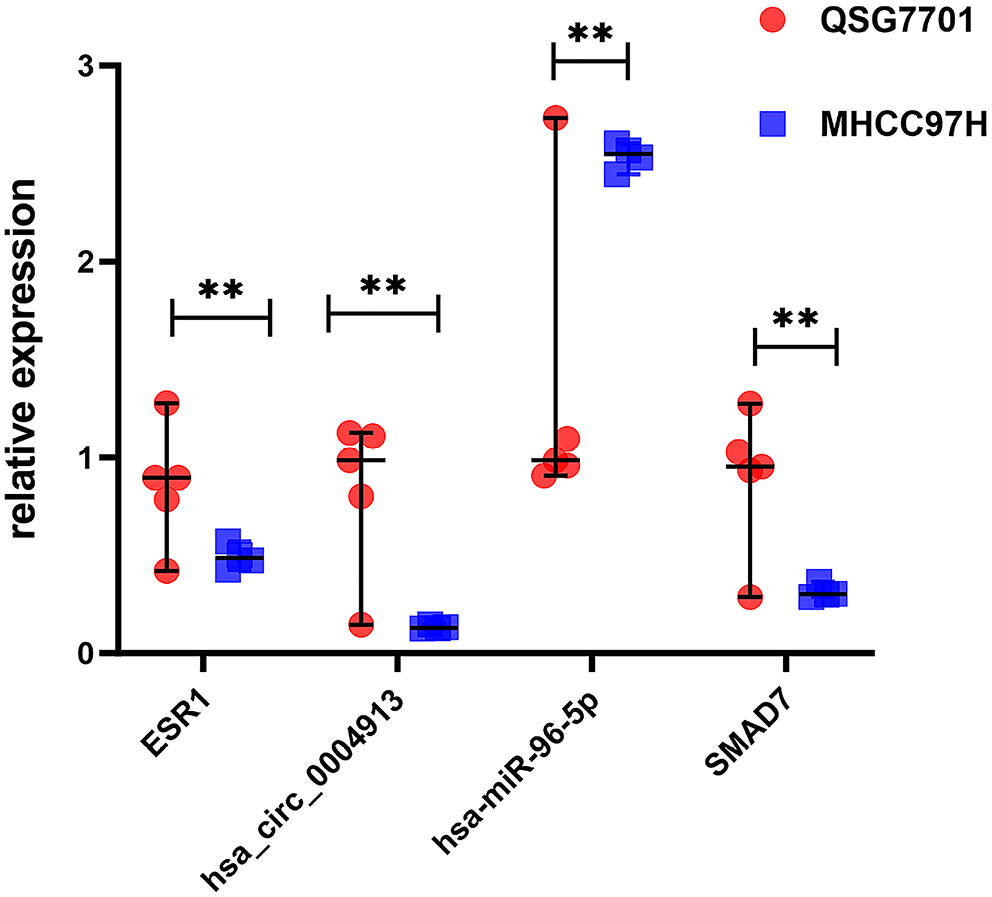
We used the HCCDB database to investigate ESR1 expression in liver tumors and adjacent liver tissues, as well as in HCC and normal patient samples. Compared to the surrounding non-cancerous tissues, HCC tissues exhibited significantly lower ESR1 expression (Figure 4). Furthermore, ESR1 expression was consistently lower in HCC patients than in healthy individuals, regardless of gender (Figure 4; p < 0.001). Based on our research, patients with high ESR1 expression levels had significantly longer OS times compared to those with low expression levels (Figure 5; p = 0.015). Additionally, ROC curve analysis demonstrated that ESR1 expression effectively distinguished tumor tissue from paired adjacent tissue, with an area under the curve (AUC) of 0.950 (95% confidence interval (95% CI): 0.927–0.970; Figure 6). The RT-qPCR results revealed that the liver cancer cell line MHCC97H expressed higher levels of hsa-miR-96-5p and lower levels of ESR1, hsa_circ_0004913 and SMAD7 compared to the normal control cell line QSG7701 (Figure 7, p = 0.008). These findings suggest that a poor prognosis in HCC patients is associated with high expression of hsa-miR-96-5p and low expression of ESR1 and SMAD7.
ERα promotes hsa_circ_0004913 expression in MHCC97H cells
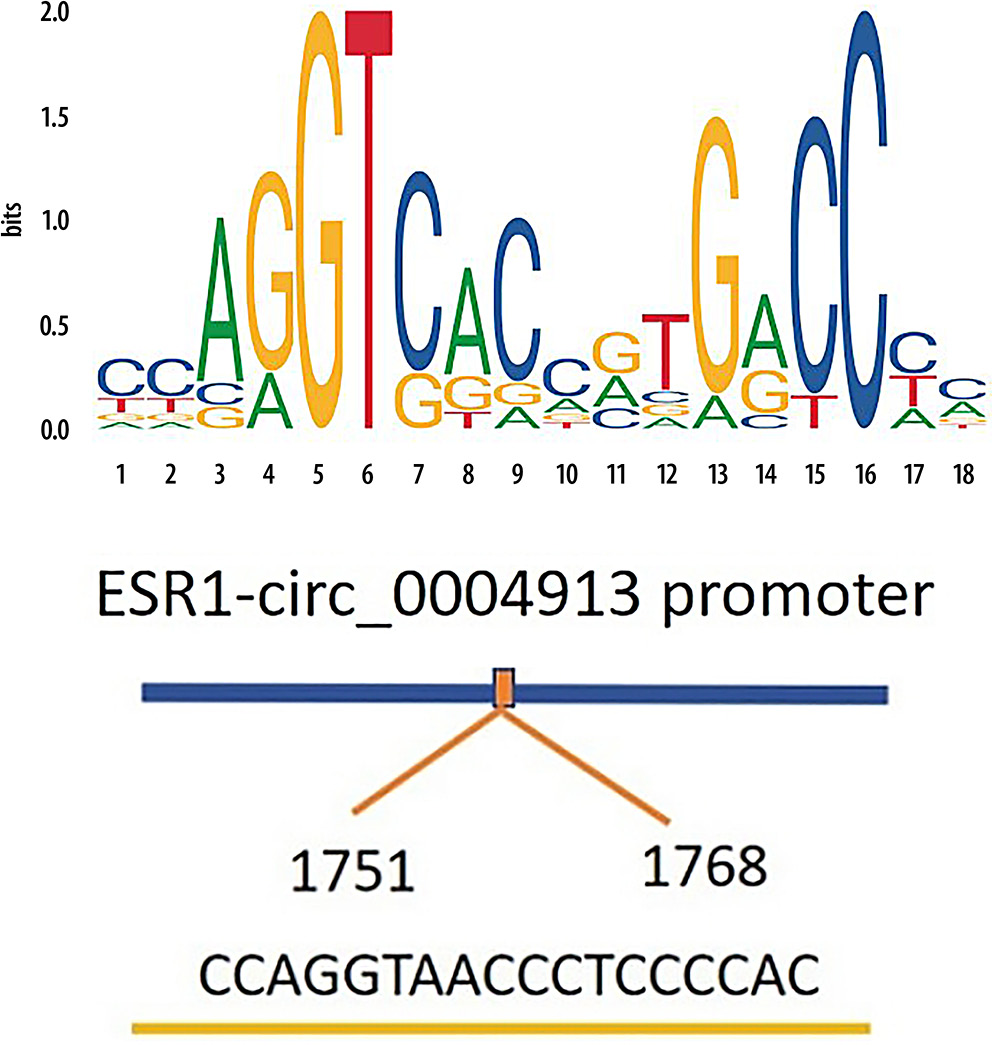
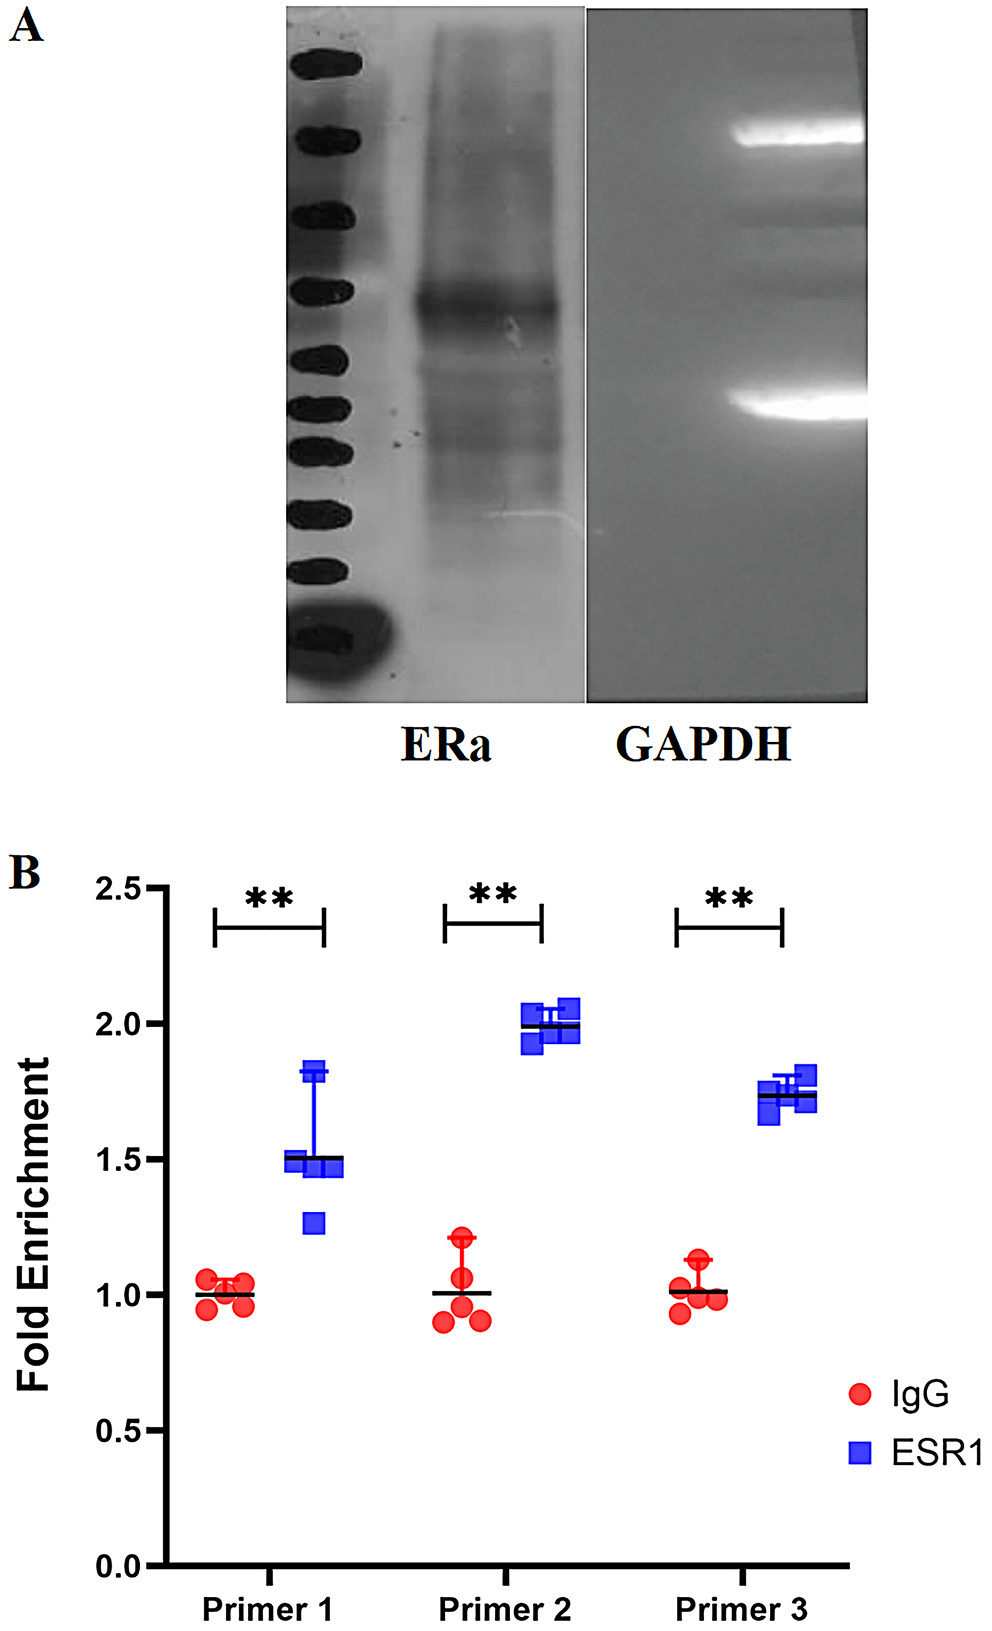
To explore the upstream regulatory mechanisms of hsa_circ_0004913, we identified ESR1 as a predicted TF using the JASPAR database. The JASPAR database was employed to predict the motif of ESR1 (Figure 8). Additionally, potential binding sites between ERα and the hsa_circ_0004913 promoter were predicted using the JASPAR database (Figure 8). We used RT-qPCR to confirm that ESR1 was overexpressed after plasmid transfection, and we found that there was a significant increase in hsa_circ_0004913 expression following ESR1 overexpression (Supplementary Fig. 1). Additionally, ChIP-qPCR analysis revealed a strong binding affinity between the hsa_circ_0004913 promoter and ESR1 at the sites targeted by the 3 primers (Figure 9). Western blot analysis confirmed the successful extraction of protein samples with GAPDH as the internal control (Figure 9). Collectively, these findings suggest that ESR1 activates the transcription of hsa_circ_0004913, thereby enhancing its expression in MHCC97h cells.
ESR1 overexpression regulates the hsa_circ_0004913/hsa-miR-96-5p/SMAD7 axis in MHCC97H
According to RT-qPCR data, ESR1 overexpression significantly increased the expression of SMAD7 while substantially decreasing the expression of hsa-miR-96-5p compared to the control group (Supplementary Fig. 2). Western blot analysis provided additional confirmation of these results (Supplementary Fig. 3). Hsa_circ_0004913 WT and MT sequences were created and transfected into 293T cells based on the anticipated binding sites (Supplementary Fig. 4). The results demonstrated that in the circ_0004913-WT group, the fluorescence of hsa-miR-96-5p mimics was significantly increased compared to negative control (NC) mimics (p = 0.008). Nevertheless, no significant difference in fluorescence was observed between NC mimics and hsa-miR-96-5p mimics in the circ_0004913-MT group (Supplementary Fig. 5). In summary, ESR1 regulates the expression of the circRNA/miRNA/SMADs axis and hsa_circ_0004913 interacts with hsa-miR-96-5p in MHCC97H cells.
ESR1 overexpression suppresses the biological activity of MHCC97H cells
To investigate the biological effects of ESR1 on MHCC97H cells, we transfected the cells with an ESR1 plasmid and an empty vector, as well as with siRNAs targeting ESR1 and a NC. Next, we evaluated MHCC97H cells proliferation with the CCK-8 test, cell migration with the Transwell assay, and cell cycle distribution with flow cytometry. The results indicated that overexpression of ESR1 significantly reduced cell proliferation, while silencing ESR1 significantly enhanced cell proliferation (p < 0.01; Supplementary Fig. 6). The migratory capacity was much lower in the ESR1 overexpression group than in the ESR1 silencing group (p < 0.01; Supplementary Fig. 7). Furthermore, compared to the ESR1 silencing group, the ESR1 overexpression group showed an increase in the proportion of cells in the G1 phase, accompanied by a decrease in cells in the S and G2 phases. This suggests that ESR1 inhibits tumor growth in MHCC97H cells by inducing G1 phase arrest (Supplementary Fig. 8; p < 0.01).
Discussion
The incidence and mortality of HCC vary significantly by gender.1 In comparison to men, women had lower incidence and mortality rates from HCC. We found that, compared to normal liver tissues, HCC tissues exhibit a marked downregulation of ESR1 expression, as confirmed with analysis of the TCGA database. Moreover, the concentration of ESR1 in adjacent non-tumor tissues was significantly higher compared to that in HCC tissues. The results of the survival study showed a favorable association between the patient’s survival times and ESR1 levels. Kaplan–Meier analysis further demonstrated that higher ESR1 expression was associated with longer survival in HCC patients. These findings suggest that the estrogen signaling pathway may play a protective role in HCC development and progression, offering a promising target for therapeutic intervention.
While substantial research has investigated the downstream regulatory mechanisms of circRNAs, their upstream regulatory pathways remain largely unexplored. Several studies have suggested that TFs can bind to circRNA promoter sequences, thereby regulating their expression.20, 21 Emerging evidence indicates that TFs, including ERα, can bind to circRNA promoter sequences, thereby modulating their transcriptional activity.
In this study, we analyzed differentially expressed circRNAs between adjacent non-tumor tissues and HCC using the GEO database and investigated potential TFs via the JASPAR database. We found that ESR1 may function as a TF for multiple differentially expressed circular RNAs (circRNAs). Of these circRNAs, hsa_circ_0004913 was identified as a key regulator of the ERα/circRNA/miRNA/SMADs network.
Based on the “gene sponge” theory, we analyzed the potential miRNAs and mRNAs targeted by these circRNAs, constructing a circRNA-miRNA-mRNA network. This network comprises several pathways that converge on the SMAD family, primarily utilizing the TGF-β/SMAD signaling pathway to influence HCC development.12, 22 This network is closely associated with the TGF-β/SMAD signaling pathway, a critical driver in HCC pathogenesis. Several circRNAs and miRNAs within this network have been implicated in HCC initiation and progression through diverse mechanisms. For instance, hsa_circ_0058493 accelerates HCC progression by binding to YTH domain-containing protein 1.23 Hsa_circ_0001955 acts as a miR-646 sponge, promoting angiogenesis in HCC.24 MiR-200b-3p suppresses HCC cell growth by targeting ERG and VEGF-mediated angiogenesis.25 MiR-329-3p enhances tumor cell responsiveness to T cell-induced cytotoxicity.26 These findings suggest that this network is closely associated with the development of HCC and may be involved in various processes such as tumor angiogenesis, cellular activity, and immune sensitivity. Collectively, this network holds promise as a novel therapeutic target for HCC.
In this study, we hypothesize that ESR1, acting as a TF, differentially modulates the expression of specific circRNAs in HCC. This modulation influences the SMADs family expression and inhibits hepatocyte proliferation. The RT-qPCR analysis revealed that ESR1 overexpression upregulates the expression of hsa_circ_0004913 and SMAD7, while downregulating hsa-miR-96-5p. Furthermore, ChIP-qPCR results confirmed that ERα interacts with the hsa_circ_0004913 promoter, enhancing its expression as a transcriptional regulator. Dual-luciferase reporter assays verified that hsa_circ_0004913 directly targets and regulates hsa-miR-96-5p. In vitro studies demonstrated that ESR1 overexpression hinders HCC progression by inhibiting the proliferation and migration of MHCC97H cells, thereby inducing cell cycle arrest.
Many studies have also corroborated our findings. For instance, Li et al. conducted a study involving 150 HCC patients who underwent surgical treatment, with tissue specimens analyzed and clinical follow-up performed. The results indicated that the expression of hsa_circ_0004913 was significantly downregulated in liver cancer tissues compared to paired adjacent normal tissues. They reported significantly downregulated hsa_circ_0004913 in HCC tissues compared to adjacent normal tissues, correlating with shorter patient survival.14
Wu et al. demonstrated that hsa_circ_0004913 overexpression inhibits HCC progression by targeting miR-184, suppressing the JAK2/STAT3/AKT signaling pathway.13 Additionally, hsa-miR-96-5p has been discovered to be significantly expressed in HCC, and its suppression can increase HCC apoptosis while reducing migration and invasion.15, 16
Our study confirmed that hsa_circ_0004913 can target and regulate the expression of hsa-miR-96-5p. Similarly, Tang et al. demonstrated that in liver cancer cells, hsa-miR-96-5p is regulated by circ_0000972 through a gene-sponge mechanism, inhibiting HCC.27 As mentioned earlier, several experiments have confirmed the targeting regulatory effect of hsa-miR-96-5p on SMAD7, which is consistent with our bioinformatics predictions.18, 19, 28 Therefore, we did not perform further experimental validation. Besides SMAD7, SMAD2, SMAD3, and SMAD4 are also potential targets within our predicted network, all of which belong to the SMAD family. Recent studies have demonstrated that the SMAD family mediates TF activation and the transmission of membrane-to-nucleus signals through the TGF-β/SMAD signaling pathway.12 This pathway regulates multiple functions, including the tumor microenvironment, immune responses, tumor cell activity, and sensitivity to targeted therapies.29, 30, 31, 32 Additionally, it can crosstalk with other pathways, such as the MAPK, PI3K/AKT and WNT/β-catenin pathways, thereby amplifying its impact on tumor progression.12 Thus, it plays a critical role in the initiation and progression of HCC.
In summary, the above indicates that the ERα/circRNA/miRNA/SMADs network may serve as a potential therapeutic target for HCC.
Limitations
Our study has several limitations. Our primary focus was on the gender differences in the incidence and mortality of HCC. Our analyses identified ERα as a TF regulating multiple differentially expressed circRNAs in HCC. It also modulates the circRNA/miRNA/SMAD network to suppress HCC progression. However, our study does not explore the potential pathways involved, nor does it examine the diagnostic value of ERα and hsa_circ_0004913 in HCC. Additionally, the small sample size may limit the statistical significance of our findings. Future large-scale studies are necessary.
Conclusions
The ERα signaling pathway represents a potential therapeutic target for HCC. We propose that ERα, functioning as a TF, , regulates the production of circRNAs that are differentially expressed in HCC. This modulates the circRNA/miRNA/SMAD network and slows the progression of the cancer. We hope this research will contribute to securing additional funding for further studies aimed at improving the survival rates of HCC patients.
Supplementary data
The supplementary materials are available at https://doi.org/10.5281/zenodo.15004445. The package includes the following files:
Supplementary Fig. 1. qRT-PCR detection of the relationship between ESR1 and hsa_circ_0004913 expression. qRT-PCR analysis validated the overexpression of ESR1 in the MHCC97H cell line transfected with the ESR1 plasmid (OE-ESR1), showing a significant increase compared to the pcDNA3.1 empty vector group (pcDNA3.1). Additionally, the overexpression of ESR1 resulted in an upregulation of hsa_circ_0004913 expression. Differences were analyzed using Mann–Whitney test and are expressed as median and range (*p < 0.05, **p < 0.01, ***p < 0.001).
Supplementary Fig. 2. qRT-PCR detection of the relationship between ESR1 hsa-miR-96-5p and SMAD7 expression. qRT-PCR data showed that overexpression of ESR1 significantly increased the expression of SMAD7, while significantly decreased the expression of hsa-miR-96-5p. Differences were analyzed using Mann–Whitney test and are expressed as median and range (*p < 0.05, **p < 0.01, ***p < 0.001).
Supplementary Fig. 3. Western blot analysis confirmed that ESR1 overexpression increases the expression level of SMAD7.
Supplementary Fig. 4. The target between hsa_circ_0004913 and hsa-miR- 96-5p were predicted through TargetScan.
Supplementary Fig. 5. Luciferase reporter assay revealed that in the circ-0004913-WT group, fluorescence significantly increased in the hsa-miR-96-5p mimic group (miR-96-5p) compared to the NC mimics empty vector group (NC mimic) (p < 0.05), confirming the interaction and targeted regulation between hsa_circ_0004913 and hsa-miR-96-5p. Differences were analyzed using Mann–Whitney test and are expressed as median and range (*p < 0.05, **p < 0.01,***p < 0.001).
Supplementary Fig. 6. CCK-8 assay showed that overexpression of ESR1 (OE-ESR1) reduced MHCC97H cell proliferation, while silencing of ESR1 (si-ESR1) enhanced proliferation. Differences were analyzed using Mann–Whitney test and are expressed as median and range (*p < 0.05, **p < 0.01,***p < 0.001).
Supplementary Fig. 7. Transwell assay demonstrating that ESR1 overexpression decreased cell migration, while silencing ESR1 had the opposite effect. Differences were analyzed using Mann–Whitney test and are expressed as median and range (*p < 0.05, **p < 0.01,***p < 0.001).
Supplementary Fig. 8. Results of cell cycle. Compared to the ESR1 silencing group, the ESR1 overexpression group showed an increased proportion of cells in the G1 phase and a decreased proportion in the S and G2 phases. This suggests that ESR1 inhibits tumor growth in MHCC97H cells by inducing G1 phase arrest. Differences were analyzed using Mann–Whitney test and are expressed as median and range (*p < 0.05, **p < 0.01,***p < 0.001).
Data Availability Statement
The datasets used and/or analyzed during the current study were obtained from publicly available sources, including from the HCCDB, TCGA, GEO, circBase, UCSC, and JASPAR.
Consent for publication
Not applicable.
Use of AI and AI-assisted technologies
Not applicable.