Abstract
Background. Breast cancer (BC) is now the most common malignancy in women. Early detection and precise diagnosis are essential for improving survival.
Objectives. To develop an integrated computer-aided diagnosis (CAD) system that automatically detects, segments and classifies lesions in mammographic images, thereby aiding BC diagnosis.
Materials and methods. We adopted YOLOv5 as the object-detection backbone and used the Curated Breast Imaging Subset of the Digital Database for Screening Mammography (CBIS-DDSM). Data augmentation (random rotations, crops and flips) increased the dataset to 5,801 images, which were randomly split into training, validation and test sets (7 : 2 : 1). Lesion-classification performance was evaluated with the area under the receiver operating characteristic (ROC) curve (AUC), precision, recall, and mean average precision at a 0.5 confidence threshold (mAP@0.5).
Results. The CAD system yielded an mAP@0.5 of 0.417 and an F1-score of 0.46 for lesion detection, achieved an AUC of 0.90 for distinguishing benign from malignant lesions, and processed images at 65 fps.
Conclusions. The integrated CAD system combines rapid detection and classification with high accuracy, underscoring its strong clinical value.
Key words: machine learning, mammography, diagnosis, breast cancer
Background
According to the latest statistics from the World Health Organization (WHO), the number of new breast cancer (BC) cases worldwide has surpassed that of lung cancer, making BC the most prevalent cancer among women and accounting for nearly 15% of female cancer-related deaths in 2020.1 The etiology of BC encompasses genetic predispositions, environmental exposures and behavioral factors such as reproductive history and lifestyle choices. Early detection and accurate diagnosis are critical for effective treatment and personalized therapeutic strategies.2 Breast cancer diagnosis can be classified into invasive and noninvasive approaches. To minimize unnecessary biopsies and reduce patient harm, low-risk imaging modalities such as mammography, breast ultrasound and breast magnetic resonance imaging (MRI) are preferred.3 While breast ultrasound demonstrates high sensitivity for soft tissue masses, it struggles to precisely delineate the margins of small lesions and detect morphological changes in microcalcifications, requiring substantial operator expertise. Although breast MRI provides high-resolution images, its high cost and lengthy examination time limit its utility as a routine screening tool. In contrast, mammography offers advantages such as affordability, rapid examination times and sensitivity in detecting breast masses and calcifications, enabling early identification of small tumors. It is currently recognized as one of the primary early screening methods for BC.4 The American Cancer Society (ACS) recommends annual mammographic screening for women aged 45 and older, transitioning to biennial screening at age 55 and beyond.5 Despite its advantages, accurate diagnosis with digital mammography is hindered by the lesions’ irregular shapes and their subtle density differences from surrounding normal tissue. Moreover, manual review of mammographic images is labor-intensive, time-consuming, and prone to variability based on the professional expertise of different radiologists, potentially leading to misdiagnoses. Studies indicate that approx. 10–30% of BC cases are overlooked during mammography, with miss rates reaching up to 50% depending on lesion type and breast density.6 Another study revealed that approx. 50% of prior mammograms could retrospectively identify lesions upon follow-up and diagnosis.7
To alleviate the workload of radiologists, enhance screening efficiency and minimize missed or incorrect diagnoses caused by subjective factors, computer-aided diagnostic (CAD) systems have emerged as essential auxiliary tools for radiologists. These systems integrate medical imaging with computer vision techniques to assist in the early detection and precise treatment of breast lesions. Early CAD technologies relied on large-scale data analysis and training based on patients’ pathological features, constructing detection and recognition models through statistical inference. However, the diagnostic accuracy of these methods was relatively limited. In recent years, with advancements in technology, numerous studies have incorporated the concept of neural networks into CAD systems, introducing deep learning – a multi-layer neural network-based approach for model training.8 Deep learning models possess the capability to directly extract high-level image features from raw input images. Several studies9, 10, 11 have developed CAD systems tailored for breast lesion detection, segmentation or classification, achieving remarkable success in identifying and categorizing lesions in mammographic images. The models commonly referenced in the literature are predominantly variations of Convolutional Neural Networks (CNNs), such as Region-based Convolutional Neural Networks (R-CNN), Fast R-CNN and Faster R-CNN.12
However, these models often struggle to detect small lesions and exhibit limited real-time detection speed, which fails to meet clinical requirements. Rapid detection and accurate classification of lesions in medical images remain a pressing issue that require immediate attention in current research. In 2016, Redmon et al.13 introduced the initial version of the You Only Look Once (YOLO) object detection model, and in June 2020, the You Only Look Once v. 5 (YOLOv5) model was released. The YOLO model is categorized as a 1-stage object detection algorithm, which completes recognition in a single pass, contrasting with the 2-stage detection models. YOLOv5 is currently recognized as one of the fastest image recognition algorithms in the field of artificial intelligence (AI) and has been extensively studied in industrial applications.14 However, its application in the medical field remains relatively underexplored.
Objectives
The aim of our study is to develop an integrated CAD system that incorporates lesion detection, segmentation and classification using the YOLOv5 model. This model performs both detection and classification tasks simultaneously, features low memory requirements and offers fast processing speed, thereby facilitating the clinical application of CAD systems.
Materials and methods
Study design
Considering that the classification problem is generally easier than the object detection problem, we first designed a high-accuracy classification model to directly infer whether the lesion in the image is benign or malignant, and then developed an auxiliary object detection model to provide detailed localization of benign and/or malignant areas within the image. The YOLOv5 model was selected as the base framework due to its efficient architecture and strong performance in object detection tasks. It uses a single neural network to perform both object detection and classification, making it faster and more efficient compared to previous versions of YOLO.
In this study, we utilized the Curated Breast Imaging Subset of the Digital Database for Screening Mammography (CBIS-DDSM) (https://www.cancerimagingarchive.net/collection/cbis-ddsm) as our dataset. This dataset represents an updated and standardized version of the DDSM dataset. The DDSM dataset comprises digital mammograms from 2,620 patients, collected across 4 institutions in the USA. It includes images of both left and right breasts, categorized into 4 classes: normal, benign, malignant, and other. Additionally, the dataset provides metadata such as patient age, breast density and lesion type. The CBIS-DDSM collection consists of a curated subset of DDSM data selected by a trained mammographer. The images have been decompressed and converted to the DICOM format. Updated region-of-interest (ROI) segmentations, bounding boxes and pathologic diagnoses for the training data were also included. For this research, we employed the CBIS-DDSM database, which encompasses 1,644 examinations from 1,566 individuals, with 891 cases involving masses and 753 related to calcifications.15 In our study, we focused exclusively on mammograms with confirmed masses. Among the 891 examinations associated with masses, the majority provided 2 distinct views: the mediolateral oblique (MLO) and the craniocaudal (CC). By incorporating both viewing angles, the total number of mammographic images increased to 1,592.
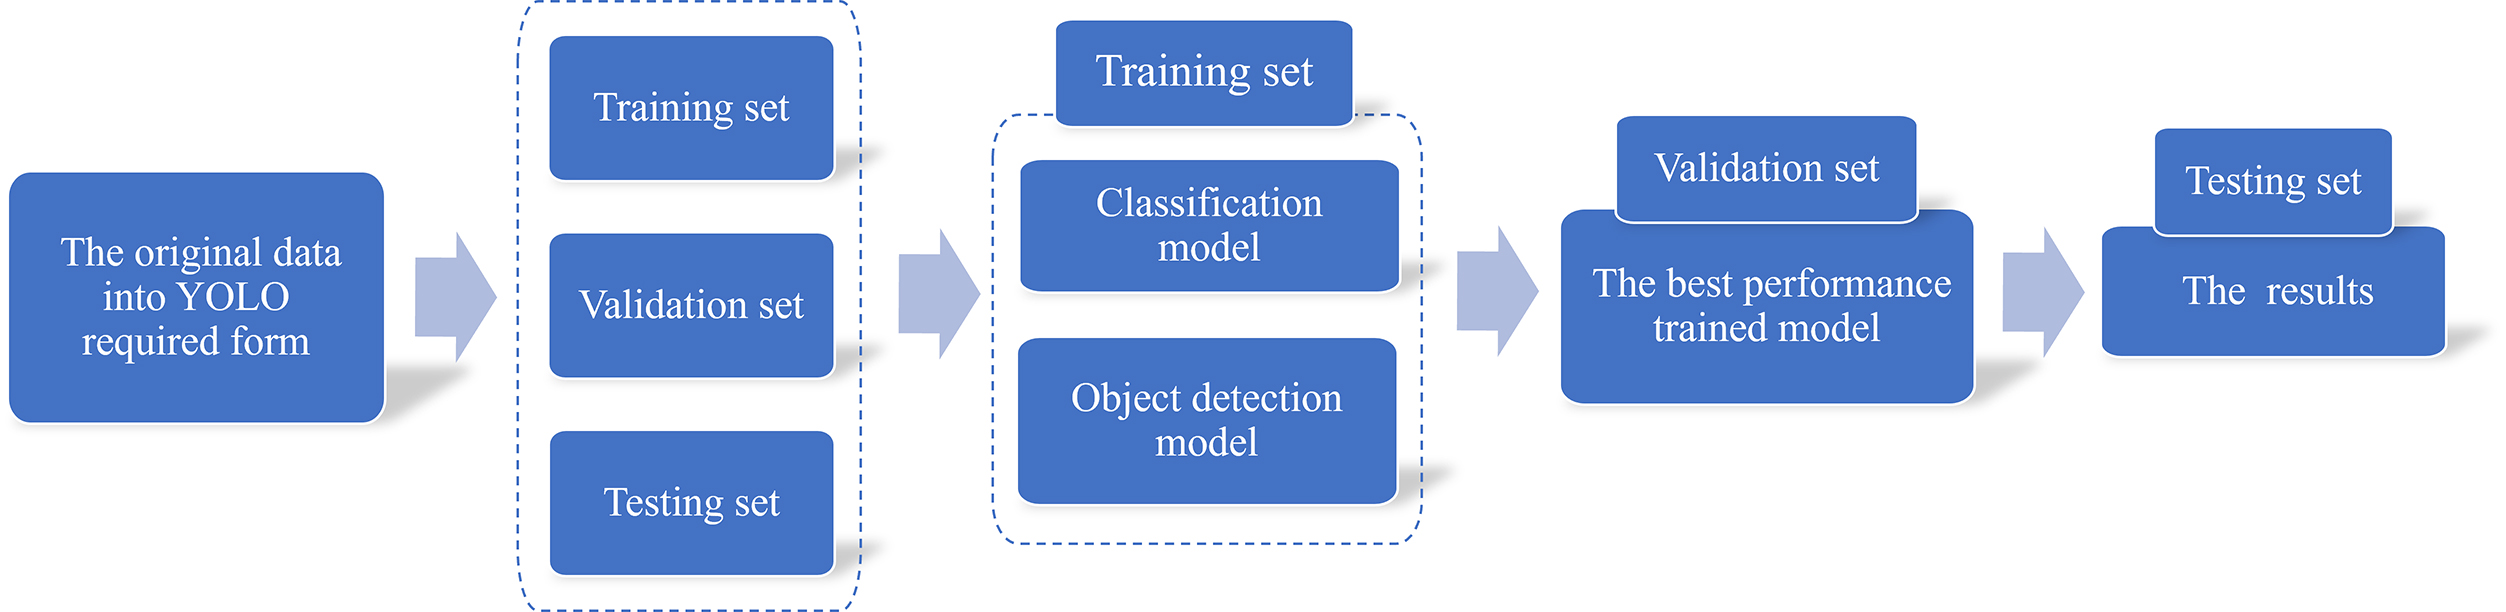
To implement our method, we first needed to convert the original data format into the form required by YOLO. This involved 3 components: the detection image, the corresponding object bounding box and the image label. Subsequently, the dataset was divided into 3 parts: the training set, validation set and testing set. The next step involved training the classification and object detection models using the training set data. The validation set data were utilized to select the model with the best performance. Finally, the testing dataset was used to generate the final results. By leveraging our classification and object detection models, breast surgeons can better interpret patient symptoms.
Data preprocess and setting
The CBIS-DDSM dataset was selected as the dataset for the tumor detection model due to its substantial sample size, encompassing both benign and malignant cases of mammograms. However, the original structure of the dataset is complex, with multiple nested folders containing DICOM files for each mammogram and associated tumors. These files are named inconsistently, making it challenging to logically group data based on individual mammograms and their corresponding ROIs. To address this issue, a batch sequential architecture was employed to preprocess the CBIS-DDSM data into a usable format. A metadata file containing relevant information, such as filenames and local file paths, was generated and subsequently used to create a single CSV file for training, testing and validation purposes. The resulting dataset provides all the necessary information for developing a model while simplifying the file structure. Generally, the accuracy of a deep learning model improves with an increase in the number of training samples.
After creating the new data structure, we proceeded to process the data itself. The mammograms in the CBIS-DDSM dataset contain visual noise, such as annotations and tape marks, introduced during the original sampling process. Additionally, the mammograms include large areas of background, which can unnecessarily extend processing time. To improve the quality of the mammograms, we removed unwanted noise using morphological opening and cropped the images around the breast region to eliminate excess background. Furthermore, the mammograms were enhanced to improve the contrast between intense tumor areas and subtle background tissue. Contrast Limited Adaptive Histogram Equalization (CLAHE) was employed to enhance image contrast. This well-established image processing algorithm has proven effective in improving mammogram detection performance.16 The bounding box coordinates for each tumor in the mammograms were calculated based on the provided ground truth masks.
Generally speaking, providing a larger number of samples to a deep learning model tends to improve its accuracy. However, this relationship is not always strictly linear due to factors such as data quality and model complexity. To prevent overfitting and enhance network performance, the training images were subjected to data augmentation techniques. Specifically, we augmented the dataset by applying random rotation, random cropping and random flipping. As a result, the total number of samples was increased to 5,801.
Statistical methods and model construction
The classification model and the object detection model in our method share similarities, as both are based on YOLOv5. The network structure of the YOLOv5 classification model is described as follows:
Input layers: The YOLOv5 classification model accepts an image of fixed size as input. The input image undergoes preprocessing and normalization to meet the model’s requirements.
Backbone network: The backbone network of YOLOv5 is a CNN designed to extract features from the input image. It consists of several blocks, each containing multiple convolutional layers with batch normalization and activation functions.
Neck: The neck component of YOLOv5 aggregates features extracted by the backbone network across different layers. It comprises multiple upsampling and concatenation operations, which merge features from different scales to enhance multi-scale representation.
Classification head: The classification head of YOLOv5 includes fully connected layers that take the aggregated features from the neck as input. This head performs the classification task by predicting the probability of the input image belonging to each class.
Output layers: The output layers of YOLOv5 generate the final classification results. These layers apply post-processing operations such as softmax to convert the output scores into probabilities, thereby producing the final class prediction.
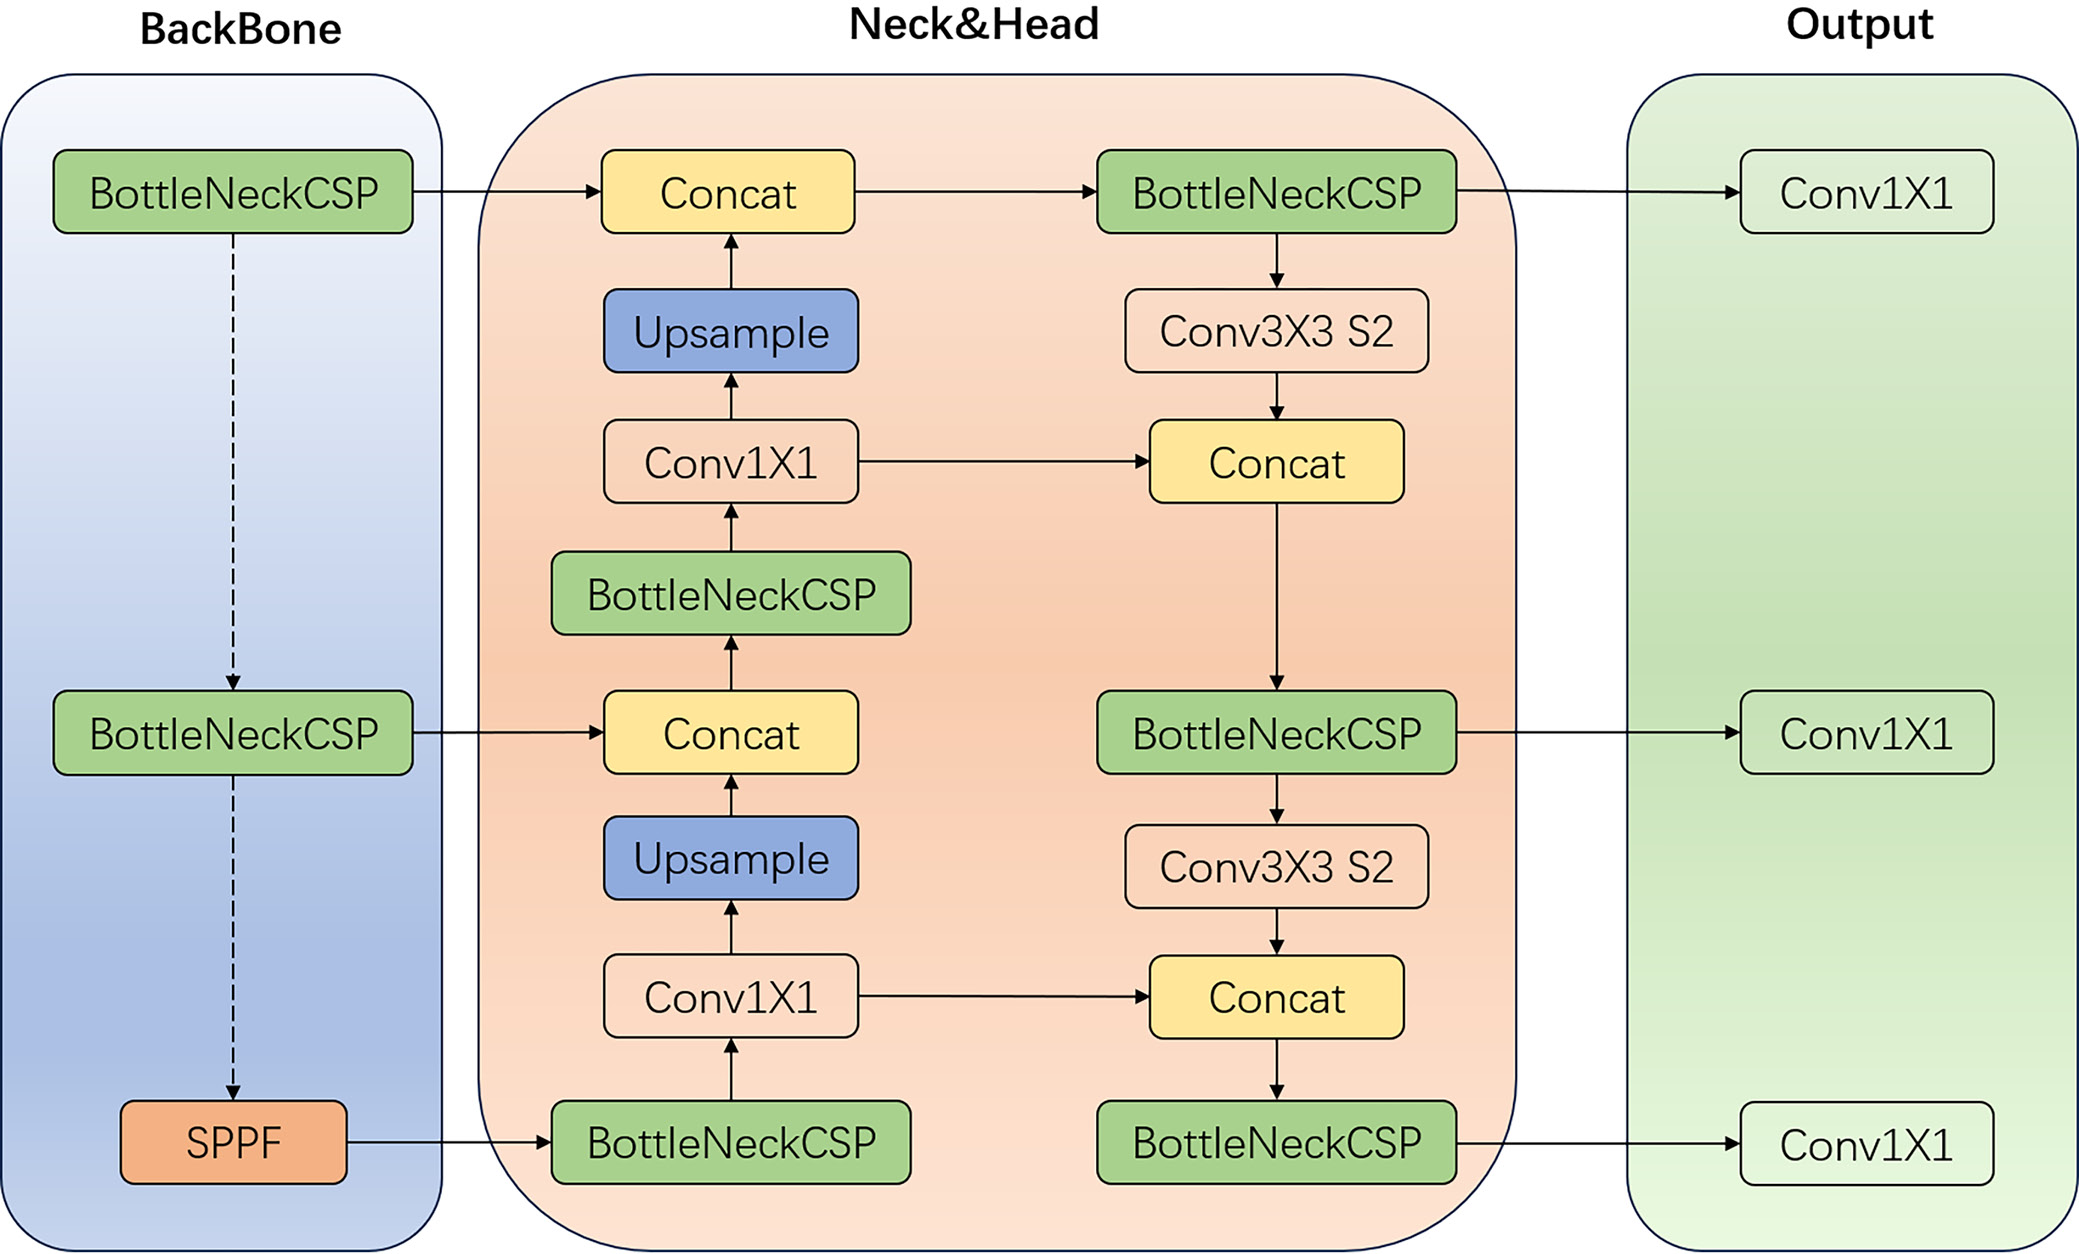
Figure 1 presents an overview of the network architecture and components of the YOLOv5 model, clearly illustrating its processing pipeline and utilized modules. The BottleneckCSP module embodies the residual structure of the network, enabling the extraction of deep semantic information from images and integrating feature maps across different scales to enhance network depth. Additionally, the YOLOv5 model incorporates a simplified version of the BottleneckCSP (False) module, which consists of 2 concatenated convolutional layers. The spatial pyramid pooling (SPP) module performs spatial pyramid pooling, involving convolutional operations both before and after the module. At its core, the SPP layer includes 4 branches: 3 branches perform max-pooling operations with kernel sizes of 5 × 5, 9 × 9 and 13 × 13, while 1 branch bypasses pooling entirely. The outputs from these 4 branches are concatenated via the Concat module and then passed through a convolutional layer to produce the final output. This design enables the SPP module to extract critical contextual features without compromising the model’s speed. In the YOLOv5 network, the path-aggregation network (PANet) module serves as the header, incorporating 2 upsampling stages followed by 2 downsampling stages post-convolution. This sampling mechanism facilitates the fusion of feature values at various scales, thereby enriching the feature information.
Experiment
The classification and object detection tasks have distinct evaluation measures. In the medical field, classification evaluation often employs the area under the curve (AUC), a widely used metric in machine learning for assessing the performance of binary classification models. Area under the curve quantifies the model’s ability to distinguish between positive and negative classes across various classification thresholds.
In a binary classification problem, the model outputs a probability score for each sample, representing the likelihood of it belonging to the positive class. By adjusting the classification threshold (i.e., the cut-off probability score above which a sample is classified as positive), the model can generate different combinations of true positive and false positive rates.
The AUC is computed by determining the area under the receiver operating characteristic (ROC) curve, which plots the true positive rate (on the y-axis) against the false positive rate (on the x-axis) at various classification thresholds. The AUC value ranges from 0 to 1, with higher values indicating superior model performance.
Object-detection models are typically assessed with 4 key metrics: precision (Pr), recall (Rc), mean average precision (mAP), and intersection over union (IoU).
Precision: Precision measures the proportion of true positive detections among all positive predictions. In other words, it indicates the fraction of predicted detections that are actually correct. Precision is calculated as:
Pr = TP / (TP + FP)).
Recall measures the proportion of true positive detections among all actual positive instances in the dataset. In other words, it indicates the fraction of actual objects that were correctly detected. Recall is calculated as:
Rc = TP / (TP + FN)).
Mean average precision (mAP) is a widely adopted evaluation metric for object detection models, accounting for both precision and recall across various confidence thresholds. Essentially, it quantifies the average precision achieved by a model at different recall levels. A higher mAP score signifies superior performance. It is computed by determining the area under the precision–recall curve. mAP is calculated as:
Results
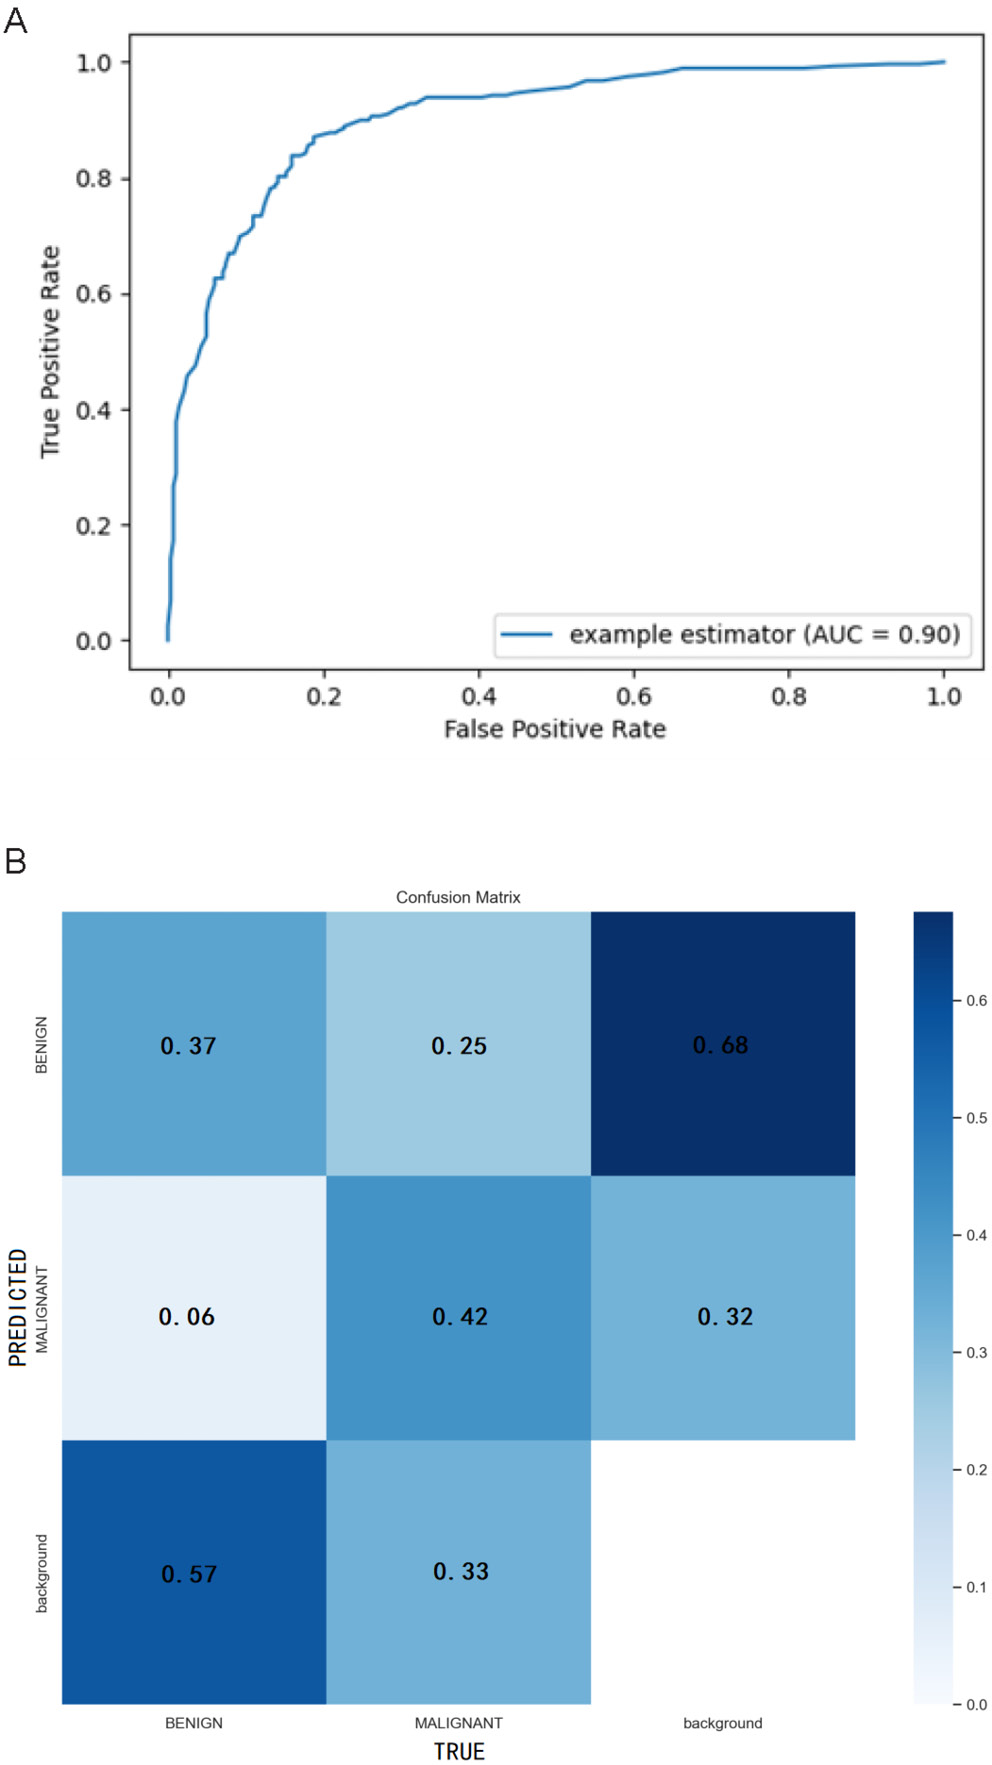
The YOLOv5-based integrated CAD system we developed for automatic detection, segmentation and classification of breast X-ray masses demonstrates outstanding performance. In the mass-classification task, the system achieves an AUC of 0.90, underscoring its strong ability to distinguish among different mass types (Figure 2A). The confusion matrix is a critical tool for evaluating classification model performance, enabling us to identify areas where the model struggles with predictions. Each column of the matrix corresponds to an actual category, while each row represents a predicted category. As illustrated in Figure 2B, the horizontal axis denotes “True” categories, and the vertical axis denotes “Predicted” categories. In this matrix, the values within each cell represent normalized probabilities rather than absolute counts, as column-wise normalization has been applied to transform the raw counts into predicted probabilities. These normalized results are automatically generated by the YOLOv5 model during the prediction process. For benign lesions, the Rc is calculated as 0.37/(0.37 + 0.06 + 0.57) = 0.37, while for malignant lesions, the Rc is 0.42/(0.42 + 0.25 + 0.33) = 0.42. Notably, the diagonal values of the confusion matrix correspond to the Rc for each category. As evident from the data, the Rc for malignant lesions (0.42) is higher than that for benign lesions (0.37).
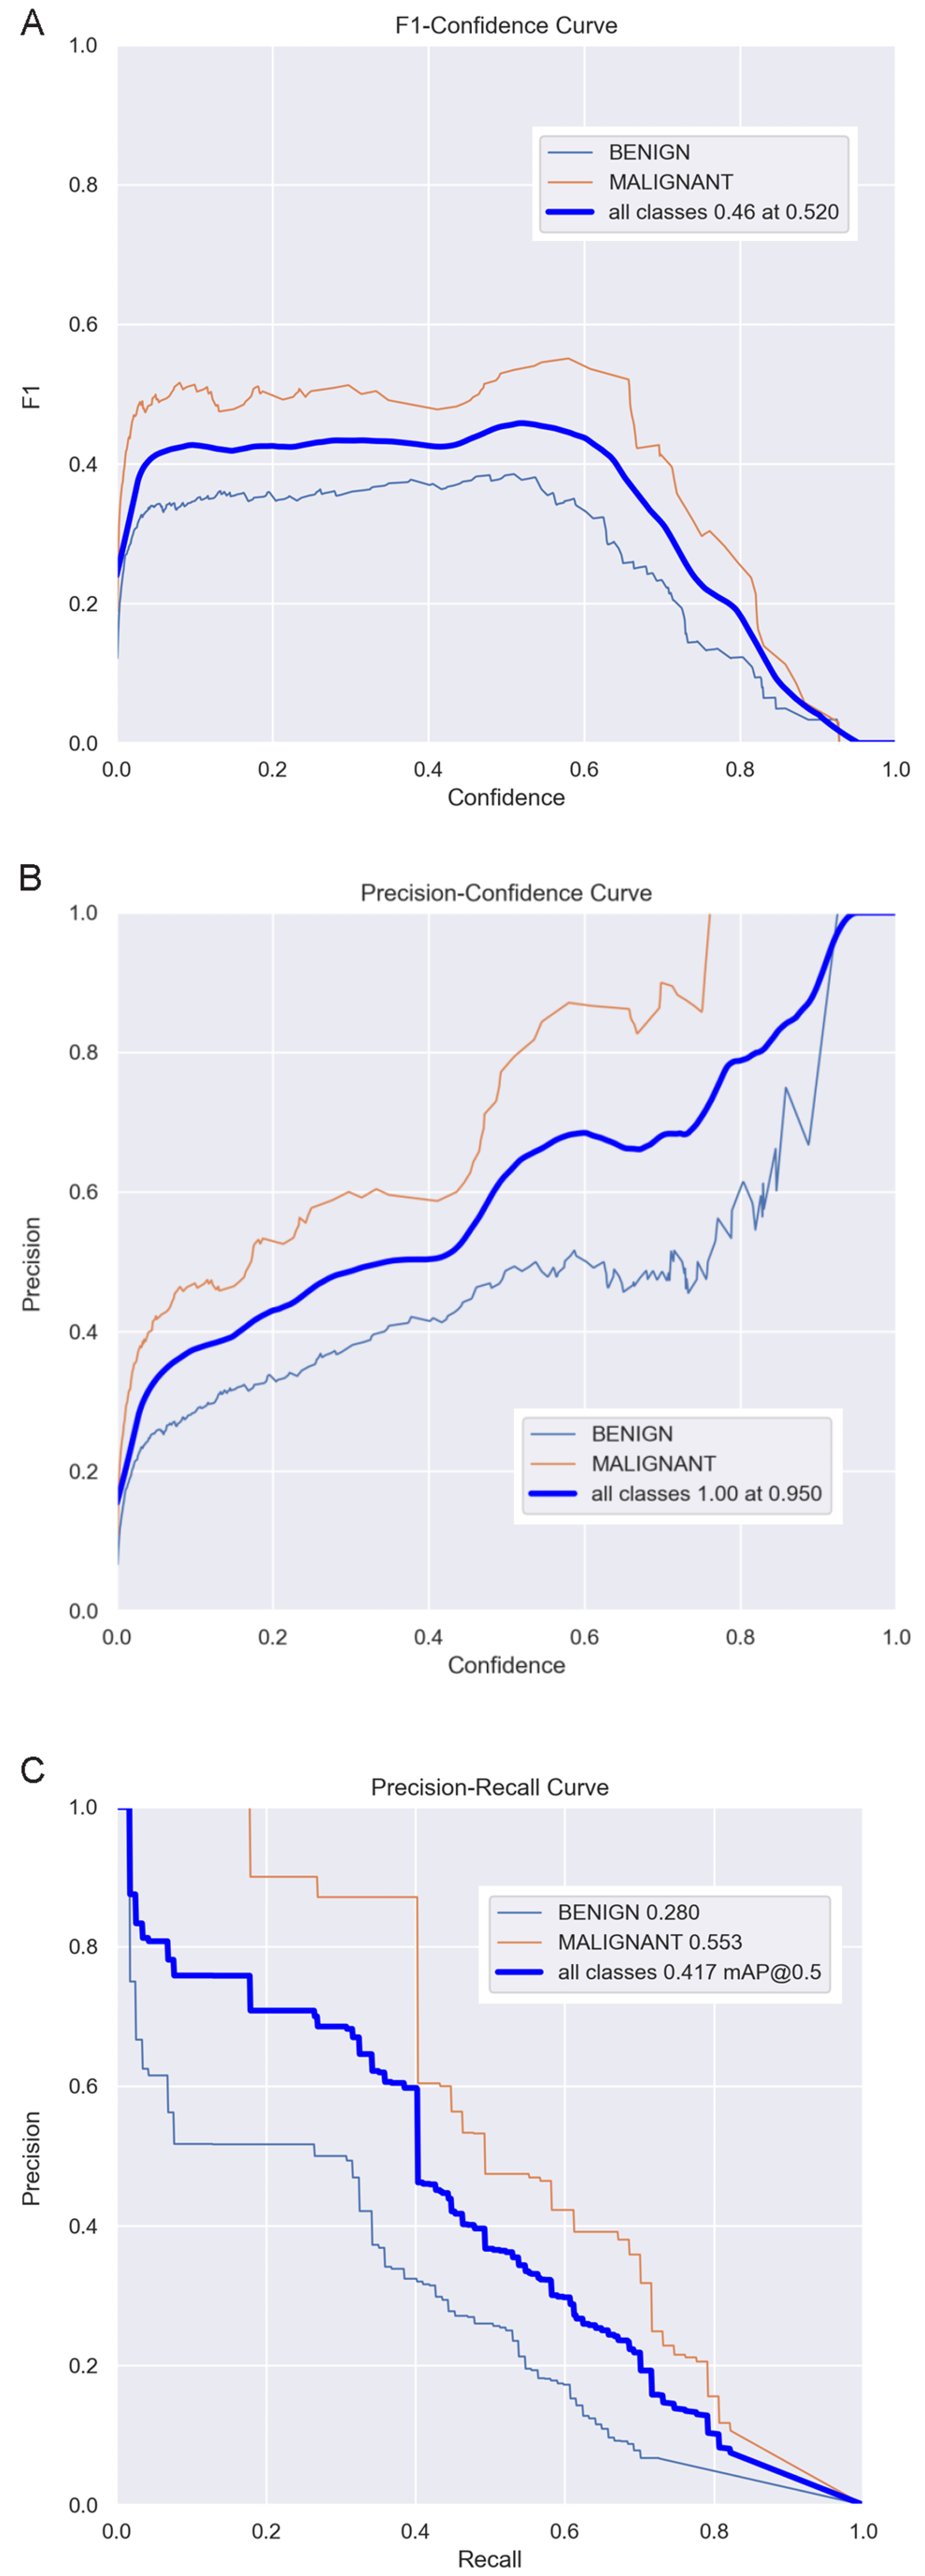
In terms of object detection, we employ the F1 curve, precision–confidence curve and precision–recall curve to evaluate the system’s performance. The F1 curve in Figure 3A represents the harmonic mean of precision and recall, providing a comprehensive reflection of the detection system’s performance. As shown in Figure 3A, the F1 score reaches its peak value of 0.46 at a confidence threshold of 0.520. Consequently, this value can be regarded as the optimal confidence threshold. The precision–confidence curve in Figure 3B depicts the relationship between precision and confidence. Higher precision indicates a greater proportion of true positive samples among those predicted as positive by the model. By analyzing the precision (P) curve, we can assess the model’s accuracy across various confidence thresholds. It is evident that as the confidence level increases, the detection accuracy also improves correspondingly. Additionally, the precision–recall curve in Figure 3C serves as a visual tool to illustrate the trade-off between precision and recall for the classification model. By plotting the precision–recall curve, we can evaluate and compare the model’s performance under different classification thresholds and calculate the mAP to measure overall performance. Here, mAP@0.5 denotes the average mAP value when the Intersection over Union (IoU) threshold equals 0.5. As depicted in Figure 3C, the mAP@0.5 value of our object detection model is 0.417, indicating that the model performs well.
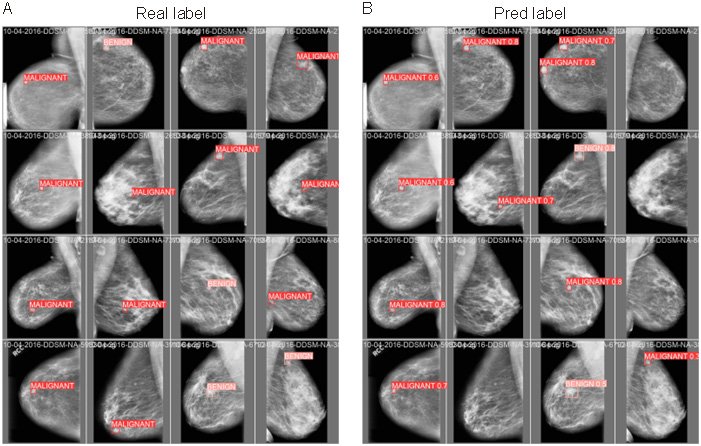
To visually demonstrate the performance of the CAD system, Figure 4 presents a comparison between predicted results and actual results for several cases. From these comparison figures, it is evident that the CAD system successfully detected masses in most cases and classified them with high accuracy. These results strongly validate the high performance and practicality of our integrated CAD system for automatic detection, segmentation and classification of breast X-ray masses based on YOLOv5.
Discussion
In our study, the integrated CAD system demonstrated excellent performance in the detection, segmentation and classification of breast lesions. Indeed, breast lesion detection is the most critical task in any CAD system, as accurate identification of suspicious lesions significantly enhances diagnostic accuracy. In this study, the YOLOv5 deep learning model, a CNN-based region of interest (ROI) model, utilizes the features of the entire image to predict bounding boxes for all target classes, enabling end-to-end training and real-time inference while maintaining high average accuracy.14 The YOLOv5-based detection model has proven effective for breast lesion detection in the DDSM database, capable of directly detecting lesions and accurately anchoring bounding boxes within mammographic images. One study had shown that YOLO can handle challenging detection tasks, such as identifying lesions located within chest muscles or dense tissues.17 Compared to other models, the YOLO detection framework demonstrates a lower false positive rate and significantly reduced testing time and memory usage, making it more efficient than more complex deep learning architectures.18 End-to-end lesion detection and segmentation are essential for reducing false positives and negatives, thereby enhancing CAD system performance.
Breast lesion classification represents the final stage of a CAD system, where the primary objective is to classify breast lesions as either benign or malignant. Deep learning has become the most widely adopted technology for this task. Currently, various architectures of CNN models, along with stacked autoencoders, have been employed for the classification of benign and malignant lesions in mammographic images. Arevalo et al.19 utilized a CNN combined with a Support Vector Machine (SVM) classifier to classify breast masses in mammographic images, achieving an AUC of 0.86. In contrast, when manually extracted features were combined with an SVM classifier, the AUC was only 0.799. This demonstrates that deep learning-based feature extraction methods, particularly those based on CNNs, significantly outperform traditional handcrafted feature extraction techniques, resulting in substantially improved classification performance. Ribli et al.20 proposed a CAD system based on Faster R-CNN for the detection and classification of benign and malignant breast lesions. Their model was evaluated and tested using the INbreast database, achieving an overall classification accuracy of 95%. However, there have been relatively few studies exploring the application of YOLO in breast lesion classification. Our developed target classification model, based on YOLOv5, was trained, validated and tested on the CBIS-DDSM database, achieving an AUC value of 0.9 in the test set. This result confirms that YOLOv5 also exhibits excellent classification performance.
In recent years, several studies have developed integrated CAD systems based on deep learning that can simultaneously perform breast lesion detection, segmentation and classification. Kooi et al.21 developed a CAD system that integrates deep features with imaging features. This system first employs conditional random fields (CRF) for lesion detection, followed by region growing to segment the lesion boundary, and finally uses a CNN for breast lesion classification. The CAD system demonstrates excellent diagnostic performance, achieving an AUC of 0.941. Another study22 proposed an integrated CAD system for breast masses that adopts a complex deep learning cascade structure for lesion detection and segmentation. It utilizes a standard feedforward CNN to classify breast lesions as benign or malignant, exhibiting strong diagnostic performance. Despite the success of these CAD systems in breast mass diagnosis, certain limitations remain, such as high storage requirements, long prediction times and challenges in meeting clinical application needs. Our integrated CAD diagnostic system, developed based on YOLOv5, achieves a mAP@0.5 of 0.417 in breast lesion detection, an AUC of 0.9 in breast lesion benign/malignant classification, and a processing speed of 65 fps. It is characterized by high detection accuracy and fast processing speed, making it suitable for clinical applications. YOLO’s high recall across most categories can be attributed to its single-stage architecture, grid-based prediction mechanism, utilization of anchor boxes, balanced trade-offs between speed and accuracy, end-to-end training approach, extensive data augmentation techniques, and a carefully designed loss function. These features collectively enhance YOLO’s ability to detect objects of various sizes, shapes and positions with high precision and recall. Notably, the YOLO algorithm has demonstrated high recall in the development and application of numerous tumor diagnosis models,23, 24, 25 which aligns closely with our research findings.
We applied YOLOv5, which demonstrates significant advancements in optimizing and streamlining neural network architectures. These improvements not only enhance the computational efficiency and real-time performance of models but also strengthen their robustness and generalization capabilities. Therefore, we did not further narrow down the neural network structures. In the evolution of the YOLO series of algorithms, optimizations and reductions in neural network architectures are primarily reflected in 3 key areas. First, efficiency improvements through layer reduction: Although the number of layers increased from YOLOv1 to YOLOv5 (e.g., Darknet-53 has more layers than Darknet-1926), overall efficiency and real-time performance were significantly improved by adopting more efficient convolutional layers and feature extraction methods. Second, multi-scale prediction and feature fusion: Starting with YOLOv3 and continuing through YOLOv4, these versions introduced multi-scale prediction and feature fusion techniques, enhancing the model’s ability to detect objects of varying sizes and improving detection accuracy.27 Lastly, lightweight design: The YOLO series emphasizes maintaining model performance while reducing complexity and computational load through strategies such as using more efficient convolutional kernels and eliminating redundant layers.28
Limitations
There are still some limitations in this study that warrant discussion. First, the CBIS-DDSM database used in this study comprises traditional film-based mammograms that were digitized using a scanner. As a result, the images are subject to high noise levels and represent an incomplete spectrum of lesion types. Second, the YOLOv5 model employed in this study was published in 2022. In recent years, the YOLO series algorithms have undergone rapid development, with notable advancements such as YOLOX,29 YOLOR,30 PP-YOLO series,31, 32, 33 YOLOv6,34 YOLOv7,35 and YOLOv8.36 Whether these newer models can achieve superior performance in BC detection and classification remains unexplored in this paper. Third, the training parameters of YOLOv5 were not fine-tuned in this study, which may limit the model’s potential for further performance improvement.
Conclusions
This study developed an integrated CAD system based on YOLOv5, encompassing detection, segmentation and classification tasks, for the automatic diagnosis of breast lesions in mammographic images. The system demonstrates high diagnostic accuracy and fast processing speed. We conclude that the integrated CAD system holds significant potential for breast lesion diagnosis. In the future, the CAD system proposed in this study will undergo practical testing to validate its true effectiveness. Future practical validation will be required to confirm the CAD system’s real-world clinical effectiveness.
Data Availability Statement
The datasets analyzed during the current study are available in the Curated Breast Imaging Subset of Digital Database for Screening Mammography (CBIS-DDSM), https://www.mammoimage.org/databases.
Consent for publication
Not applicable.
Use of AI and AI-assisted technologies
Not applicable.