Abstract
Background. Many studies reported positive effects of physical exercise on the condition of dialysis patients. The insufficient value of those changes makes it difficult to interpret their clinical relevance.
Objectives. This study aimed to assess the influence of selected training (endurance, resistance, tai chi) on cardiopulmonary fitness and muscle function, as well as to analyze the factors having the most significant effect on cardiopulmonary fitness in a group of dialysis patients.
Material and methods. Ninety-eight patients agreed to participate in the study. Selection of the type of training was done by cluster randomization. Group 1 were patients in a cluster with an endurance exercise program, and group 2 in a cluster with resistance exercises. Group 3 consisted of patients who took part in a tai chi program (non-cluster randomization). Exercise programs with each of the 3 groups were conducted for a period of 6 months, 3 times a week (groups 1 and 2) and twice a week (group 3), up to 60 min for 1 session.
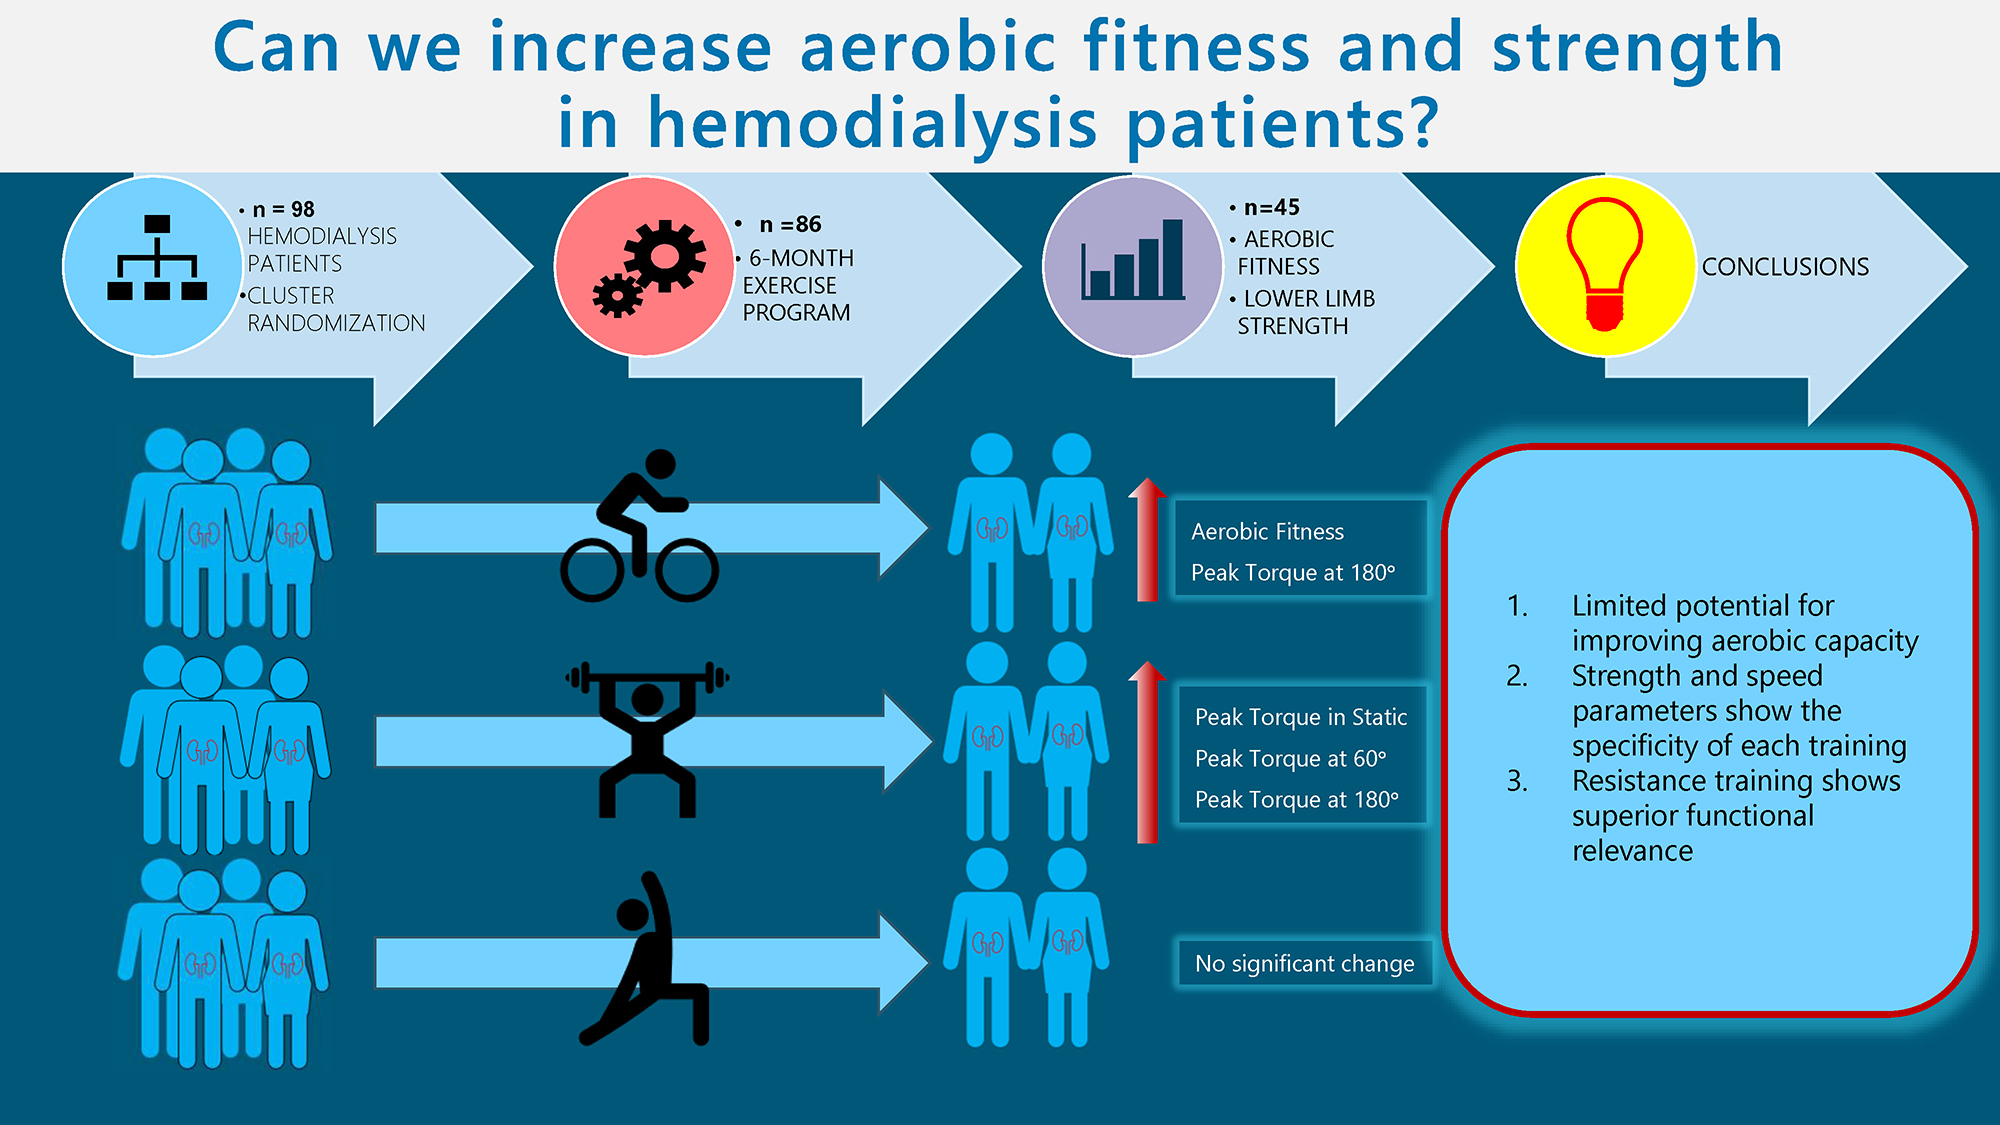
Results. The full exercises was completed by 45 patients: group 1 – 16; group 2 – 15; group 3 – 14. The significance of the observed difference in the cardiopulmonary function was confirmed only in endurance group for absolute oxygen concumption (VO2) and heart rate (HR). Measurements of peak torque (PTQ) and total work (TW) performed at a speed of 60°/s showed a significant increase in the measured values only in the resistance training group. Measurements of PTQ and TW performed at 180°/s showed a significant increase in the measured values in the endurance and resistance group.
Conclusions. The 6 months of training resulted in a slight improvement in cardiopulmonary parameters only in the endurance group. The above results seem to confirm the observed limited potential for improving aerobic capacity in dialysis patients. The results of strength and speed parameters shows the specificity of each training, expressed by selective improvements in isometric and both isokinetic tests.
Key words: hemodialysis, endurance training, strength training, muscle function, spiroergometry
Background
Chronic kidney disease (CKD) is a rapidly emerging public health concern worldwide and is now recognized as a civilization disease. Over the past 2 centuries, the average human life expectancy has more than doubled, leading to a significant increase of the elderly population. Aging processes contribute to structural and functional changes in all organs, including the kidneys.
The rise in CKD cases can also be attributed to lifestyle factors. The prevalence of CKD is steadily increasing, particularly in rapidly developing countries, likely driven by the concurrent epidemics of diabetes and cardiovascular diseases.1, 2 These changes are undoubtedly reflected in the epidemiology of kidney disease.2, 3 Unfortunately, the early stages of kidney disease can be secretive, even latent. The final stage of kidney failure, the end-stage renal disease (ESRD), is often referred to as “silent epidemy”.3
Patients with ESRD show significantly lower levels of physical activity and associated physical capacity than the population average.4, 5, 6 The process of physical impairment begins with the initial changes in renal function, although it may not be subjectively noticeable in the early stages.5 This poses a serious problem because the level of physical activity correlates significantly with physical capacity (oxygen uptake rate) and is independently associated with mortality.7, 8 The VO2max index, also known as maximal oxygen consumption or oxygen capacity, is a widely adopted measure of physical fitness used to assess both healthy individuals and patients with various medical conditions. Decreased aerobic capacity levels are evident even in the earlier stages of kidney failure9 and become significantly lower in patients with ESRD, averaging 15–21 mL/min/kg, compared to the general population average of 30–40 mL/min/kg.9, 10
Adequate muscular strength is essential for maintaining the proper function of the musculoskeletal system, enabling individuals to engage in necessary daily activities, including professional work and fulfilling basic needs, as well as intentional and recreational physical activities. Several studies suggest a significant correlation between muscle strength and various factors influencing individual fitness, particularly gait speed,9, 10 as well as the incidence of balance disorders, risk of falls and fractures,10, 12 and frequency of hospitalization.11, 12 Consequently, a reduction in muscle strength and power contributes to decreased physical activity13, 14, 15 and is an important factor in the development of disability.11, 12, 15
Patients with CKD show a reduction in muscle strength already in the early stages of the disease, correlating with a decrease in the glomerular filtration rate (GFR). The most significant decline in strength occurs in ESRD, potentially hindering physical functioning even after transplantation.15, 16 The mechanism of these changes can be both primary, due to uremic myopathy, as well as secondary, due to a number of factors: comorbidities, lifestyle and age-related sarcopenia.17 This combination of the aforementioned variables leads to significant alterations in the muscle tissue structure of dialysis patients. Magnetic resonance imaging (MRI) scans of hemodialysis patients reveal pronounced atrophic changes in the muscles, along with an increased presence of non-contractile muscle elements, which significantly impacts muscle functionality.18
The recommendations and clinical guidelines established by experts in 2016, including the European Renal Best Practice Guideline (ERBPG) and the expert team of the rehabilitation section of the Polish Society of Nephrology, highlight the importance of evaluating patient’s functional status. They emphasize the need to implement individualized physical training programs to enhance the functional capacity of patients with ESRD.19, 20
Many studies reported positive effects of physical exercise on the condition of dialysis patients. The evidence supports the integration of structured exercise programs into routine care for dialysis patients, emphasizing the need for healthcare providers to promote physical activity as a vital component of comprehensive CKD management. Despite that, the insufficient value of those changes makes it difficult to interpret their clinical relevance.21 There is also no consensus on which form of physical training offers the greatest potential for improving the widest range of physical fitness aspects in this patient group. Tailored exercise programs that consider individual patient capabilities and preferences are essential for maximizing the therapeutic benefits of physical activity in this population.
Objectives
The primary aim of this study was to assess the influence of selected training modalities (endurance, resistance and tai chi) on cardiopulmonary fitness and muscle function in ESRD patients. The secondary aim was to analyze the factors that most significantly impact cardiopulmonary fitness within this group of patients.
Materials and methods
Trial design
This study was designed as a parallel cluster intervention trial. Two care providers delivered specific exercise programs to 3 groups of ESRD patients. Group 1 participated in a cluster with an endurance exercise program, while group 2 engaged in a cluster with resistance exercises. Group 3 (tai chi) consisted of patients who wanted to take a part in workouts on their non-dialysis days (not subject to cluster randomization). All care providers were selected by project leader, based on their experience in their field. Care provider 1, a physiotherapist and instructor in resistance and endurance training, supervised the exercise programs in groups 1 and 2. Care provider 2, a physiotherapist and instructor, who specializes in yoga and tai chi exercise programs, supervised group 3.
This research was conducted in line with the recommendations of the Declaration of Helsinki. The research project received a positive opinion from the Senate Committee on Research Ethics at the Wroclaw University of Health and Sport Sciences issued on January 18, 2012.
Participants
Ninety-eight patients with ESRD at the dialysis station of the Department of Nephrology, Transplant Medicine and Internal Medicine of Wroclaw Medical University (Poland) agreed to participate in the study. All training participants were qualified by a nephrologist and a cardiologist. Written informed consent was obtained from the patients to participate in the tests and workouts, which was preceded by an explanation of the purpose and conduct of the workouts, assurances of the confidentiality of the data obtained, and information that the patients could withdraw from the project upon request.
Inclusion criteria
– Diagnosed end-stage renal failure;
– renal replacement therapy with hemodialysis for at least 6 months;
– adequate dialysis therapy: dialysis adequacy index Kt/V > 1.2 (K – dialyzer clearance of urea, t – dialysis time, V – volume of distribution of urea, approximately equal to patient’s total body water);
– protein catabolism ratio-polymerase chain reaction (PCR) 0.8–1.4 g protein/kg body weight/day;
– age 40–80 years.
Exclusion criteria
– The presence of contraindications to the exercise test and physical training;
– kidney transplant;
– no final tests;
– adherence to training units below 70%;
– malnutrition expressed by hypoalbuminemia (<3 g/dL) and <17 points in the assessment of nutritional status with the Mini Nutritional Assessment (MNA) questionnaire*;
– lack of patient consent.
*The MNA scale is a simple nutrition screening and assessment tool, designed to determine the possibility of malnutrition.
Intervention
Exercise programs with each of the 3 groups were conducted for a period of 6 months, 3 times a week (groups 1 and 2) and twice a week (group 3), up to 60 min for 1 session. Group 1 comprised undergoing controlled endurance training during a hemodialysis procedure. Group 2 consisted of undergoing controlled strength (resistance) training during a hemodialysis procedure. Group 3 were participating in tai chi training 2 times a week on non-dialysis days.
Physical training
The trainings were conducted at the Dialysis Center of the University Hospital in Wrocław and the gym of the Wroclaw University of Health and Sport Sciences (tai chi training). The exercises for groups 1 and 2 were conducted during the first 2 h of hemodialysis while the patients remained seated in their dialysis chairs. The workouts took place under the constant supervision of a nephrologist and a physiotherapist. Each training session was divided into 3 parts: 1. The introductory part, which was a short warm-up of about 5 min. It included active exercises of the lower limbs in the supine position. 2. The main part took lasted 10–50 min. In this part, depending on the assigned training, group 1 performed endurance training, and group 2 performed strength (resistance) exercises. 3. The final part, or cool-down, lasted about 5 min and included limb relaxation exercises, as well as breathing exercises.
Endurance training
Group 1 performed endurance training on the Reck MOTOmed® letto2 rotor (Reck-Technik, Betzenweiler, Germany), which allows for riding in a supine or semi-recumbent position. This rotor allows for the adjustment of set parameters to modulate the intensity of the workout: speed of rotation [rpm] and degree of mechanical resistance 1–11 [nm].
Training intensity was assessed using a subjective 10-degree Borg scale. The premise of the training was to achieve load progression from low intensity (1–3 on the Borg scale) in the 1st week, through medium (4–7) to high intensity (>7 on the Borg scale). The aerobic training commenced with a brief 5-min warm-up at a moderate rotation speed, without mechanical resistance, before transitioning to the main session.
During the main session, based on the patient’s subjective reaction, as well as the parameter of average power [W], the physiotherapist increased the intensity of the training in 10-min stages, modulating the speed of rotation and mechanical resistance. The training was conducted until participants experienced a clear, subjective feeling of fatigue, followed by a 5-min cooling phase to conclude the session, with a reduction (approx. 50%) of mechanical resistance and rotation, until the patient’s breathing calmed down significantly.
After the workout, the physiotherapist wrote down the training parameters from the rotor: training duration [min], speed [rpm], motor power [W], and total work (TW) cost [J]. These formed the basis for determining the training load progression for subsequent workouts. The physiotherapist encouraged patients to progressively increase their workload in each session or, at a minimum, maintain the same level as in the previous workout.
Strength training
Group 2 performed resistance exercises using weights, balls and elastic bands under individual supervision of the physiotherapist (care provider 1). The exercises primarily targeted the lower limbs and the upper limb that was not affected by the arteriovenous fistula. Each movement pattern included 1 exercise, performed in 4–5 sets. The 1st set was light, consisting of 20 repetitions, while sets 2–5 were standard, ranging from 10 to 20 repetitions, continuing until significant fatigue was reached. The intensity was adjusted based on subjective perception, with the appropriate selection of resistance bands’ color or the weight of the dumbbells. If the patient demonstrated clear tolerance to the exercise, the training load was increased and maintained at a constant level for at least 3 training sessions (1 week) to allow adaptation to the new load. If the patient demonstrated clear progression, the training load was increased in the following week. The exercise was performed until a clear, subjective feeling of fatigue was achieved (at the beginning of training sessions 5–6 according to the 10-point Borg scale), but not to “muscle breakdown” (to avoid the risk of injuries in the area of tendons, muscle attachments, etc.). The time of exercise unit, intensity (weights and color of elastic bands used) and volume (numbers of repetitions and sets of single exercises) were noted. The duration of the actual part gradually increased from 10 min in the initial training period, up to 50 min. In addition to the training time, the training intensity and volume increased, depending on the patients’ responses to the physical effort.
Tai chi training
Group 3 participated in tai chi training, which took place twice a week for 6 months on non-dialysis days. The training took place under the constant supervision of a physiotherapist (care provider 2) and the attending physician. The training was divided into 3 parts: preliminary – warm-up, main and final. The warm-up and final part lasted about 10 min each, while the main part lasted up to 40 min.
Exercises were conducted in a standing position, requiring no instruments or utensils. Exercises for the lower limbs in “soft” high positions required continuous muscle engagement, stimulating increased lower limb strength. The training intensity and duration were assessed using the subjective 10-point Borg scale. Intensity was adjusted by extending the duration of specific positions and incorporating new exercises. The training protocol aimed for a gradual progression in load intensity, starting from low intensity (1–3 on the Borg scale) in the 1st week, progressing through moderate intensity (4–7) and ultimately reaching high intensity (>7 on the Borg scale).
Outcomes/research methods
Primary outcomes were the changes in cardiopulmonary function expressed with oxygen consumption (peak VO2max) and muscle force of lower limbs (speed-strength parameters). The secondary outcome was to assess the strongest predictors of oxygen consumption in this patient population.
The primary objective of this study was to assess the potential risks and feasibility of exercise therapies by evaluating adherence, side effects and tolerance. Preliminary and final examinations were carried out at the Mikulicz-Radecki University Hospital in Wrocław and the Functional Research Laboratory of the Department of Rehabilitation in Internal Diseases at the Wroclaw University of Health and Sport Sciences. To assess the impact of the intervention, the following tests were performed on each patient at the beginning of the program (pre-test) and the end of the 6-month training program (post-test):
The Cardio-Pulmonary Exercise Test (CPET) was performed on a Cosmed K4b2 ergospirometer (Cosmed, Rome, Italy), on a Kettler cycloergometer, by an experienced exercise physiologist. The following parameters were used for analysis: absolute oxygen consumption – VO2 [mL/min], relative oxygen uptake – VO2 max [mL/min/kg], and maximum heart rate HR [bpm].
Lower limb strength was assessed using a Biodex Multi-Joint 4 isokinetic test stand by an experienced researcher. Isokinetic testing included the calculation of peak torque (PTQ) [nm] from 5 repetitions at 60°/s and 20 repetitions at 180°/s, as well as TW [J] at both 60°/s and 180°/s. Isometric testing assessed the maximum peak torque (static PTQ) [nm].
Randomization
The selection of the training type and allocation to groups (1 and 2) was carried out using cluster randomization. A cluster was a group of patients in 1 room on a specific shift of dialysis sessions (e.g., Tuesday 3rd shift). The rule ensured that each cluster (patients in the same room during a specific dialysis shift) received only 1 type of training. Clusters were randomized by evenly selecting and assigning pairs of clusters to either strength or endurance training across all dialysis shifts over a 1-week period. Group 1 consisted of patients assigned to a cluster with an endurance exercise program, while group 2 participated in a cluster with strength exercises. Both groups were supervised by care provider 1. Group 3 (tai chi), supervised by care provider 2, included patients who voluntarily participated in workouts on their non-dialysis days and were not subject to cluster randomization.
Blinding
Blinding was not feasible in this study. Participants were informed that the study aimed to compare the 3 different forms of training, but they were not informed of all the research hypotheses. There was no blinding of care providers, as they were specialists in their field. To limit the bias, data collection, pre-and post-tests and data analysis were performed by a blinded researcher, i.e., a team member who did not provide any intervention to the participants.
Statistical analyses
The normality of the distribution of the analyzed characteristics was evaluated using the Shapiro–Wilk test. For a matched-pair analysis, normality of the distribution was assessed for the differences between the paired values. Descriptive statistics were calculated. Depending on the result of the normality of the distribution test, the mean and standard deviation (SD) or median and quartile range (IQR) were used. For nominal variables, counts and percentages were calculated.
The analysis of differences between the 1st and 2nd studies was conducted using either the Wilcoxon paired rank test or Student’s t-test for dependent samples, depending on the distribution of the data. The analysis of differences between groups of subjects was performed depending on the type of variables using analysis of variance. For quantitative variables with a normal distribution, a one-way analysis of variance (ANOVA) was performed. In cases where the distribution was non-normal or the variables were ordinal, the Kruskal–Wallis test was used, followed by the Dunn–Bonferroni–Holm post hoc test for multiple comparisons. Multivariate regression analysis was also employed. Statistical significance was determined at p < 0.05. In the case of multiple comparisons, the Bonferroni correction was applied by dividing the assumed significance level by the number of comparisons (0.05/4 = 0.0125). The value of rc (rc = Z/√n) was used as the effect size for the Wilcoxon pairwise order test.22 Effect size for the T-test for dependent pairs was calculated using Hedges’ g-factor. According to the template, Hedges’ g is calculated as follows:
where:
μ1 and μ2 – mean values; SD1 and SD2 – standard deviations; r – Pearson correlation coefficient.23
The effect size for the Kruskal–Wallis ANOVA was determined using η2 and subsequently converted to Cohen’s d coefficient.24 Statistical calculations were performed using Statistica v. 13.1 (TIBCO Software Inc., Palo Alto, USA)and PQstat 1.8.2 (StatSoft Polska, Cracow, Poland).
Results
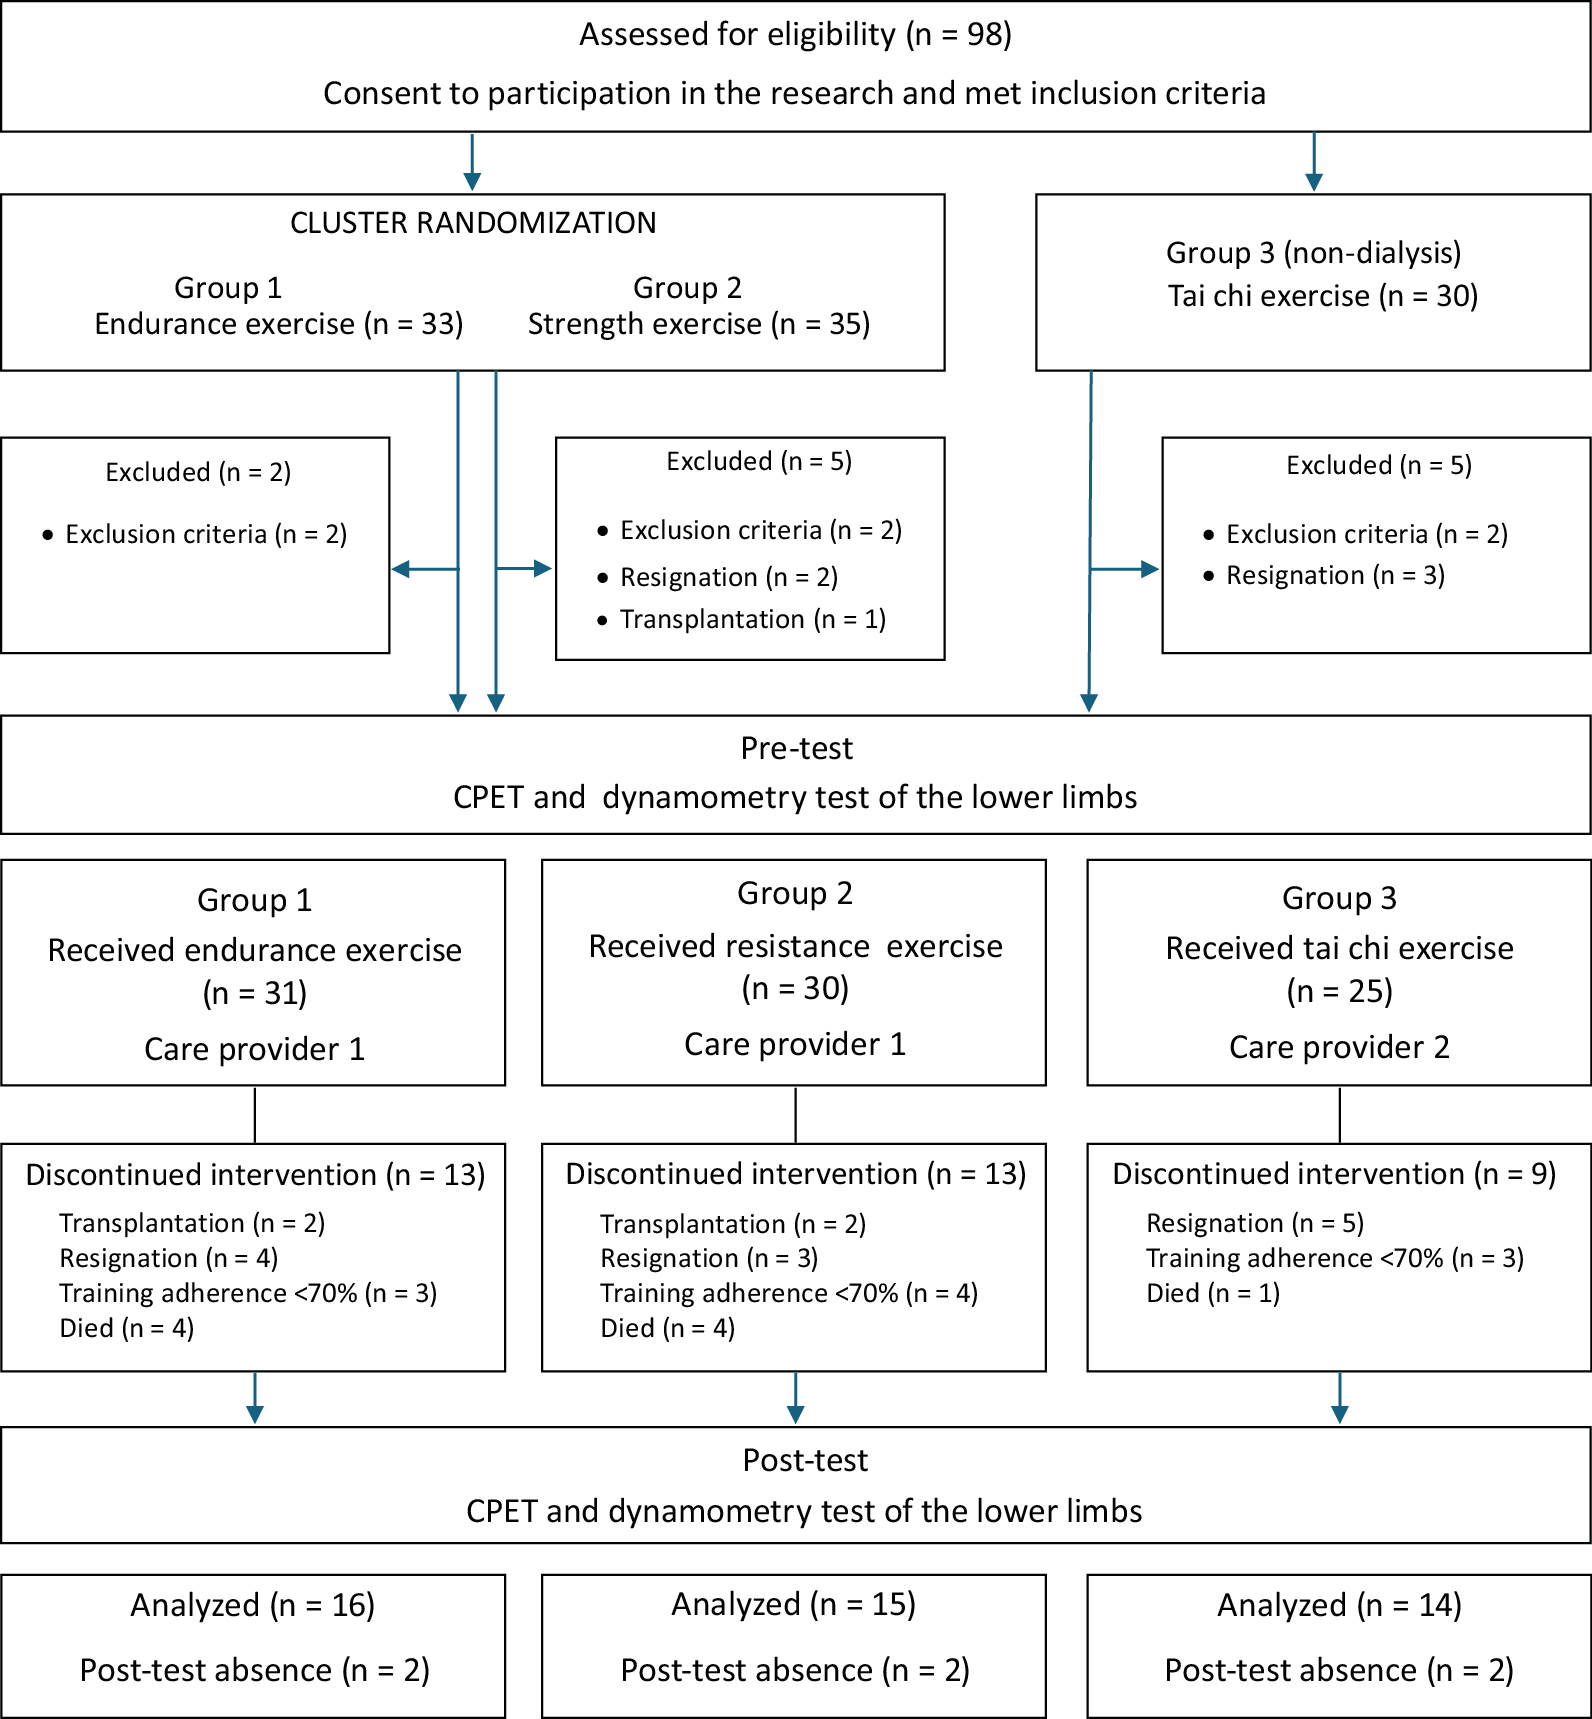
Ninety-eight patients with ESRD met the inclusion criteria, consented to participate in the study and were assigned to the respective groups: 33 participants in group 1 (endurance), 35 participants in group 2 (resistance) and 30 participants in group 3 (tai chi). Twelve participants were excluded from the study. The trial group comprised 86 patients who engaged in pre-tests and commenced the 6-month exercise intervention as per the prior allocation. The intervention included 45 patients: group 1 had 16 participants, group 2 had 15 and group 3 had 14 (Figure 1). The characteristics of the patients who completed the exercise program, underwent final examinations and were included in the statistical analysis are presented in shared data.
Spiroergometric test
In the post-training assessment (study 2), all groups, except for group 3, demonstrated an increase in VO2, VO2/kg and heart rate (HR) compared to the baseline assessment (study 1). However, the observed differences were statistically significant only in group 1 for VO2 and HR. Additionally, a strong effect size was noted in both cases (Table 1). A statistically significant difference in VO2 levels was observed between group 2 and group 3 in both study 1 and study 2. In study 1, group 2 had a significantly higher average VO2 value compared to group 3, and this difference became more pronounced in study 2. Also, the HR value in study 2 in group 2 was significantly higher compared to group 3 (Table 1, Table 2).
Measurements of PTQ and TW performed under isokinetic conditions at a movement speed of 60°/s in study 2 showed a significant increase in values for both the extensor and flexor muscles of the knee joint, but only in the group that participated in resistance training (group 2). A strong effect size was also observed for these variables (Table 3). The analysis of results between the subject groups revealed significant differences, particularly in study 2. In the study performed after the end of the training cycle, significantly higher values were observed in group 2 compared to group 1. The significance of the differences between the groups was also shown for some of the variables in the preliminary study. In study 2, the magnitude of the differences was increased. Group 2 demonstrated higher results in study 2 compared to group 3. The significance of the differences was confirmed for the PTQ values of the knee flexors and the TW performed by the knee extensor muscles on the right side (Table 3, Table 4).
Measurements of PTQ and TW performed under isokinetic conditions at 180°/s showed in study 2 a significant increase in the values obtained for both the extensor and flexor muscles of the knee joint in the group participating in endurance (group 1) and resistance (group 2) training. In all of those variables, a strong effect size was also noted (Table 5). Analysis of the differences between groups highlighted significant differences between the values of the TW obtained for the knee joint extensor muscles in both measurements. In group 2, the values obtained were significantly higher compared to group 1 (Table 5, Table 6).
Tests of the PTQ under static conditions showed an increase in the obtained values in study 2 in groups 2 and 3. However, the observed differences proved to be significant in group 2 participating in resistance training. Also, a strong effect size is noted only for group 2 (Table 7). In group 2, the values obtained proved to be the highest in both study 1 and study 2 compared to the results of groups 1 and 3. Study 2 showed the significance of differences between all static measurements in groups 1 and 2, as well as between the results obtained for the flexor muscles in groups 2 and 3. In study 1, the significance of differences concerned only the maximum PTQ of the right knee flexors (Table 7, Table 8).
Multivariate regression analysis was performed to indicate which variables have a significant effect on personal VO2/kg. Analysis of the results obtained before the training program indicated a significant effect of age, body mass index (BMI) and maximum knee extensor torque on VO2/kg. There was a negative direction of the relationship between age and BMI and a positive static PTQ. According to this model, increasing age by 1 year will decrease VO2/kg by 0.02, increasing BMI by 1 unit will induce a decrease in VO2/kg by 0.34, and increasing static PTQ will result in an increase in VO2/kg by 0.04 (Table 9, Table 10).
A very similar model was obtained for the results of study 2. There was also a negative significant relationship between VO2/kg, and age and BMI, and a positive one with isokinetic PTQ at 60°/s. However, there was no significant effect of any training model (Table 10).
Discussion
The accumulation of traditional (e.g., age, hypertension, smoking, dyslipidemia) and non-traditional (e.g., hyperphosphatemia, conductance, vascular stiffness, years of dialysis therapy) cardiovascular risk factors in a dialysis patient with a sedentary lifestyle raises questions about an appropriate (safe and effective) rehabilitation program. Given the challenge of maintaining full attendance in this patient group, the final analysis included only those patients who completed at least 70% of the training sessions. This accounted for 45.9% of the total qualifying group, totaling 45 patients. Adherence serves as a key indicator of the practical efficacy of the rehabilitation approach. However, it is important to acknowledge that this was an extensive 6-month training program conducted among a cohort of patients with a significantly higher average age. Shorter training programs provide higher results and are associated with a lower average age of the patients examined.25
In this research project, the most common reasons for discontinuing training were a lack of motivation and health-related events unrelated to exercise. These factors contributed to inconsistencies in participation and a lack of regularity in the training program. During the first month of the program, the most common reasons for patient dropout were discomfort with post-exercise fatigue and a low subjective perception of the exercise’s appeal. As the program progressed, the group size remained stable, with subsequent dropouts primarily due to health-related events, kidney transplant surgery or death.
Evaluation of spiroergometric parameters
The oxygen uptake capacity (oxygen ceiling; VO2max) can be viewed as a determinant of the body’s ability to perform maximal work.26 After a 6-month exercise program, an increase in minute oxygen uptake (VO2), VO2/kg and HR was demonstrated in each of the study groups, compared to study 1. The significance of the observed difference was confirmed only in group 1 for VO2 and HR, with a strong effect size.
In the available literature, the results vary depending on the training model, duration and anthropometric parameters of the participants, ranging from no significant changes in VO2max aerobic capacity27, 28 to substantial improvements of up to 40%.29, 30 Scapini et al. observed a greater increase in VO2max, reaching 3.35 mL/kg/min.31 Matsuzawa et al. analyzed a population of elderly patients with ESRD and found a statistically significant mean change in VO2max of 0.62 mL/kg/min after various workout programs, including those following a day-off model.32 Young et al. conducted a meta-analysis evaluating the effects of cycloergometer training during dialysis on spiroergometric parameters. Other authors highlighted the limited potential of this intervention to improve exercise capacity (oxygen uptake), pointing to an unmeasured increase in the VO2max parameter of only 1.19 mL/kg/min in the entire collected cohort of dialysis patients.21 Groussard et al. reported that, following a 3-month aerobic training program, VO2max decreased from 14.7 ±2.1 mL/kg/min to 14.3 ±2.3 mL/kg/min.28 Reboredo et al., after a 3-month rotor training program (n = 12, age 50.7 ± 10.7 years, initial VO2max 25.8 ± 5.5 mL/kg/min, BMI 22.8 ± 2.3), recorded a significant increase in VO2max to 29 ±7 mL/kg/min.33
The analysis of the cited works indicates the dependence of performance on baseline fitness, age and BMI. This was also confirmed by the results of the regression analysis, which showed that age and BMI had the greatest effect on VO2/kg in the study group of dialysis patients. Studies on populations with a higher average age and lower initial VO2max, often accompanied by increased BMI,27, 28 generally do not report significant changes. However, when conducted on younger patients with higher initial VO2max values and a normal BMI, the results demonstrate a significant positive effect.33, 34 Advanced age and prolonged dialysis therapy significantly impair the body’s physiological adaptive capacity and exacerbate sarcopenic changes. Reduced aerobic capacity and increased body fat mass (negatively impacting VO2max) are indicative of reduced physical condition from the outset, which in turn impacts the patient’s adaptive capacity and motivation to maintain training intensity and regularity. Older patients are more likely to experience fatigue during dialysis and shortness of breath, which further discourages them from engaging in physical activity.35
Based on the study’s findings and those of other researchers, it can be inferred that younger individuals in better physical condition and those with a shorter duration of dialysis therapy benefited the most from the implemented training cycle. In our study, group 3, which participated in tai chi training on non-dialysis days (“day-off”), showed nonsignificant improvements in the assessed fitness parameters. The minimal gains in fitness indices are likely attributed to the participants’ age, as well as the methodology and specific characteristics of tai chi training. The resultant VO2max following 6 months of endurance training in group 1, considering the individuals’ average age and beginning fitness levels, was comparable to findings from previous studies. Hence, the results of our study confirm the reported challenges of rehabilitation and highlight the unique characteristics of this patient group, including the accumulation of both traditional and non-traditional risk factors.35
Evaluation of strength and speed parameters
Endurance training is mainly used to increase fitness and improve cardiovascular function and is not the preferred intervention to induce functional muscle improvement. However, depending on an individual’s age, activity level and physical fitness, it can also enhance strength and speed parameters.36, 37 After 6 months of training on cycle-ergometers, nonsignificant increases in peak force moments of the knee extensors and flexors on isometric testing were recorded in group 1. In contrast, significant observations were noted in the isokinetic test at 180°/s. In group 1, there was a significant overall improvement in force-velocity parameters, with a significant increase in peak force moments for the extensors and flexors of the knee joint. In rehabilitation and biomechanical studies on elderly individuals, a significant reduction in neuromuscular reaction speed during dynamic movements has been observed, which can increase the risk of falls and injuries.38 Improving neuromuscular excitability and PTQ during dynamic movements through simple rotor training may offer potential benefits in injury prevention. Consistent with scientific findings, enhancing muscular endurance, as reflected in TW, could contribute to improved daily functioning.11
Group 2 recorded the greatest changes in strength and speed parameters, both in isometry and isokinetic testing at 60°/s. In contrast, at 180°/s, group 2 had a weaker but significant improvement compared to the endurance group (group 1). To the best of the authors’ knowledge, no studies have been conducted using comparable direct dynamometry measurements. Most researchers assess strength using indirect measures and report percentage changes, making direct comparisons unfeasible. Consequently, only general conclusions can be drawn.
Chen et al. reported significant increases in knee extensor muscle strength of 44.9 ±26.3% after a 6-month training intervention following a similar model. However, this measurement was conducted using a hand dynamometer under isometric conditions.39 In contrast, Thompson et al., using a similar training methodology but a shorter 12-week program (n = 7, age 59.7 (45.9–81.4) years), observed no significant improvement in strength. However, strength was assessed using the one-repetition maximum (1RM) method.40 Cheema et al., following a similar training model during dialysis, observed an improvement in muscle strength, including knee extensors, under isometric conditions after 3 months of training.41 Kirkman et al. reported a 7% increase in isometric muscle strength after 12 weeks of resistance training (n = 12; age 48 ±18 years). It should be noted that Kirkman implemented a high-resistance training program using a specially designed resistance platform mounted to the dialysis chair.42 Headley et al. reported a 12.7% improvement in knee extensor strength after 3 months of training in a day-off resistance training model, but only for the slowest speed tested, i.e., 90°/s.43
Group 3 engaged in 6 months of tai chi training, a supervised exercise program that does not require specialized equipment. The key advantage of tai chi lies in its diverse set of movement sequences, with gradually increasing difficulty levels that necessitate the adaptation of muscle strength and motor control. This practice enhances balance, coordination and overall functional stability. The group exhibited a slight improvement in both static and dynamic strength moments, though these changes were not statistically significant. However, it is important to consider that group 3 participated in sessions only twice per week, whereas the other groups followed a 3-times-per-week training model. This difference in training frequency may explain the nonsignificant gains observed in the biomechanical parameters. Currently, there are no published studies on this specific patient group using an analogous method for measuring muscle strength.
Chang et al. conducted a 12-week tai chi program involving 21 ESRD patients (mean age 54.2 ±15.2 years). Lower limb strength was assessed using the sit-to-stand (STS) test, which included the 5- and 10-repetition tests (STS5 and STS10) measured by time, as well as the 60-second test (STS60) performed for the maximum number of repetitions. After 12 weeks of training, a significant improvement was observed only in the STS60 test, which the authors attributed to enhanced lower limb muscular endurance. The STS5 and STS10 tests, requiring 5 and 10 repetitions of the “stand up/sit down” movement, assess the ability to generate power and muscle speed. In contrast, the STS60 test, performed over 60 s, allows for a slower movement pace with less demand for agonist-antagonist muscle control, making it a better indicator of endurance rather than explosive strength.44
Limitations
The main limitation of this study is the lack of a non-exercise control group. This is due to the specificity of this group of patients. The CPET and dynamometry tests are highly demanding assessments. It was not possible to get enough patients to do these tests without a tradeoff in the form of therapy intervention. We used the cluster randomization method which has some drawbacks – it does not give a precise picture of the whole population. The studied groups were relatively small and the results require confirmation using a larger group of patients.
Also, an important aspect of the planned workouts was the tradeoff between maintaining adequate training intensity and its safety for patients and the hemodialysis process. It should be noted that the task of the conducted research was not to determine the maximum adaptive capacity of patients with ESRD (expressed in spiroergometric and strength-velocity parameters), but to establish an effective, safe and pragmatic model – possibly accessible to all patients. In addition, tai chi training, for organizational reasons, took place twice a week, on a day without dialysis. In contrast, resistance training, for reasons of safety and correctness of execution, requires individual supervision of a physiotherapist during exercise, which could increase the sense of safety and have a motivating effect on the patient, potentially increasing the intensity of training and greater acceptance of the progression being introduced.
Conclusions
The above results seem to confirm the observed limited potential for improving aerobic capacity in patients with ESRD. The strongest determinants of exercise capacity, aside from age and BMI, were the strength of the lower limbs. Enhancing performance in this area is challenging and warrants further research. However, greater potential for improving patients’ overall condition is associated with the incorporation of resistance training. The analysis of strength and speed parameters highlights the specificity of each training modality, as evidenced by selective improvements in isometric and isokinetic test performance. These changes could have a protective influence on the risk of falls. Activities of daily living, such as walking, climbing stairs, lifting objects, and performing manual work, require overcoming the resistance of body weight and involve muscle groups of the trunk and upper limbs. In this context, resistance training demonstrates superior functional relevance due to its engagement of nearly the entire muscular system and the notable improvements in muscle strength it produces.
Data availability
The datasets generated and/or analyzed during the current study are available from the Repository for Open Data: https://doi.org/10.18150/ZZJY3I,RepOD,V1, and in Zenodo:
https://doi.org/10.5281/zenodo.15024227.
Consent for publication
Not applicable.
Use of AI and AI-assisted technologies
Not applicable.