Abstract
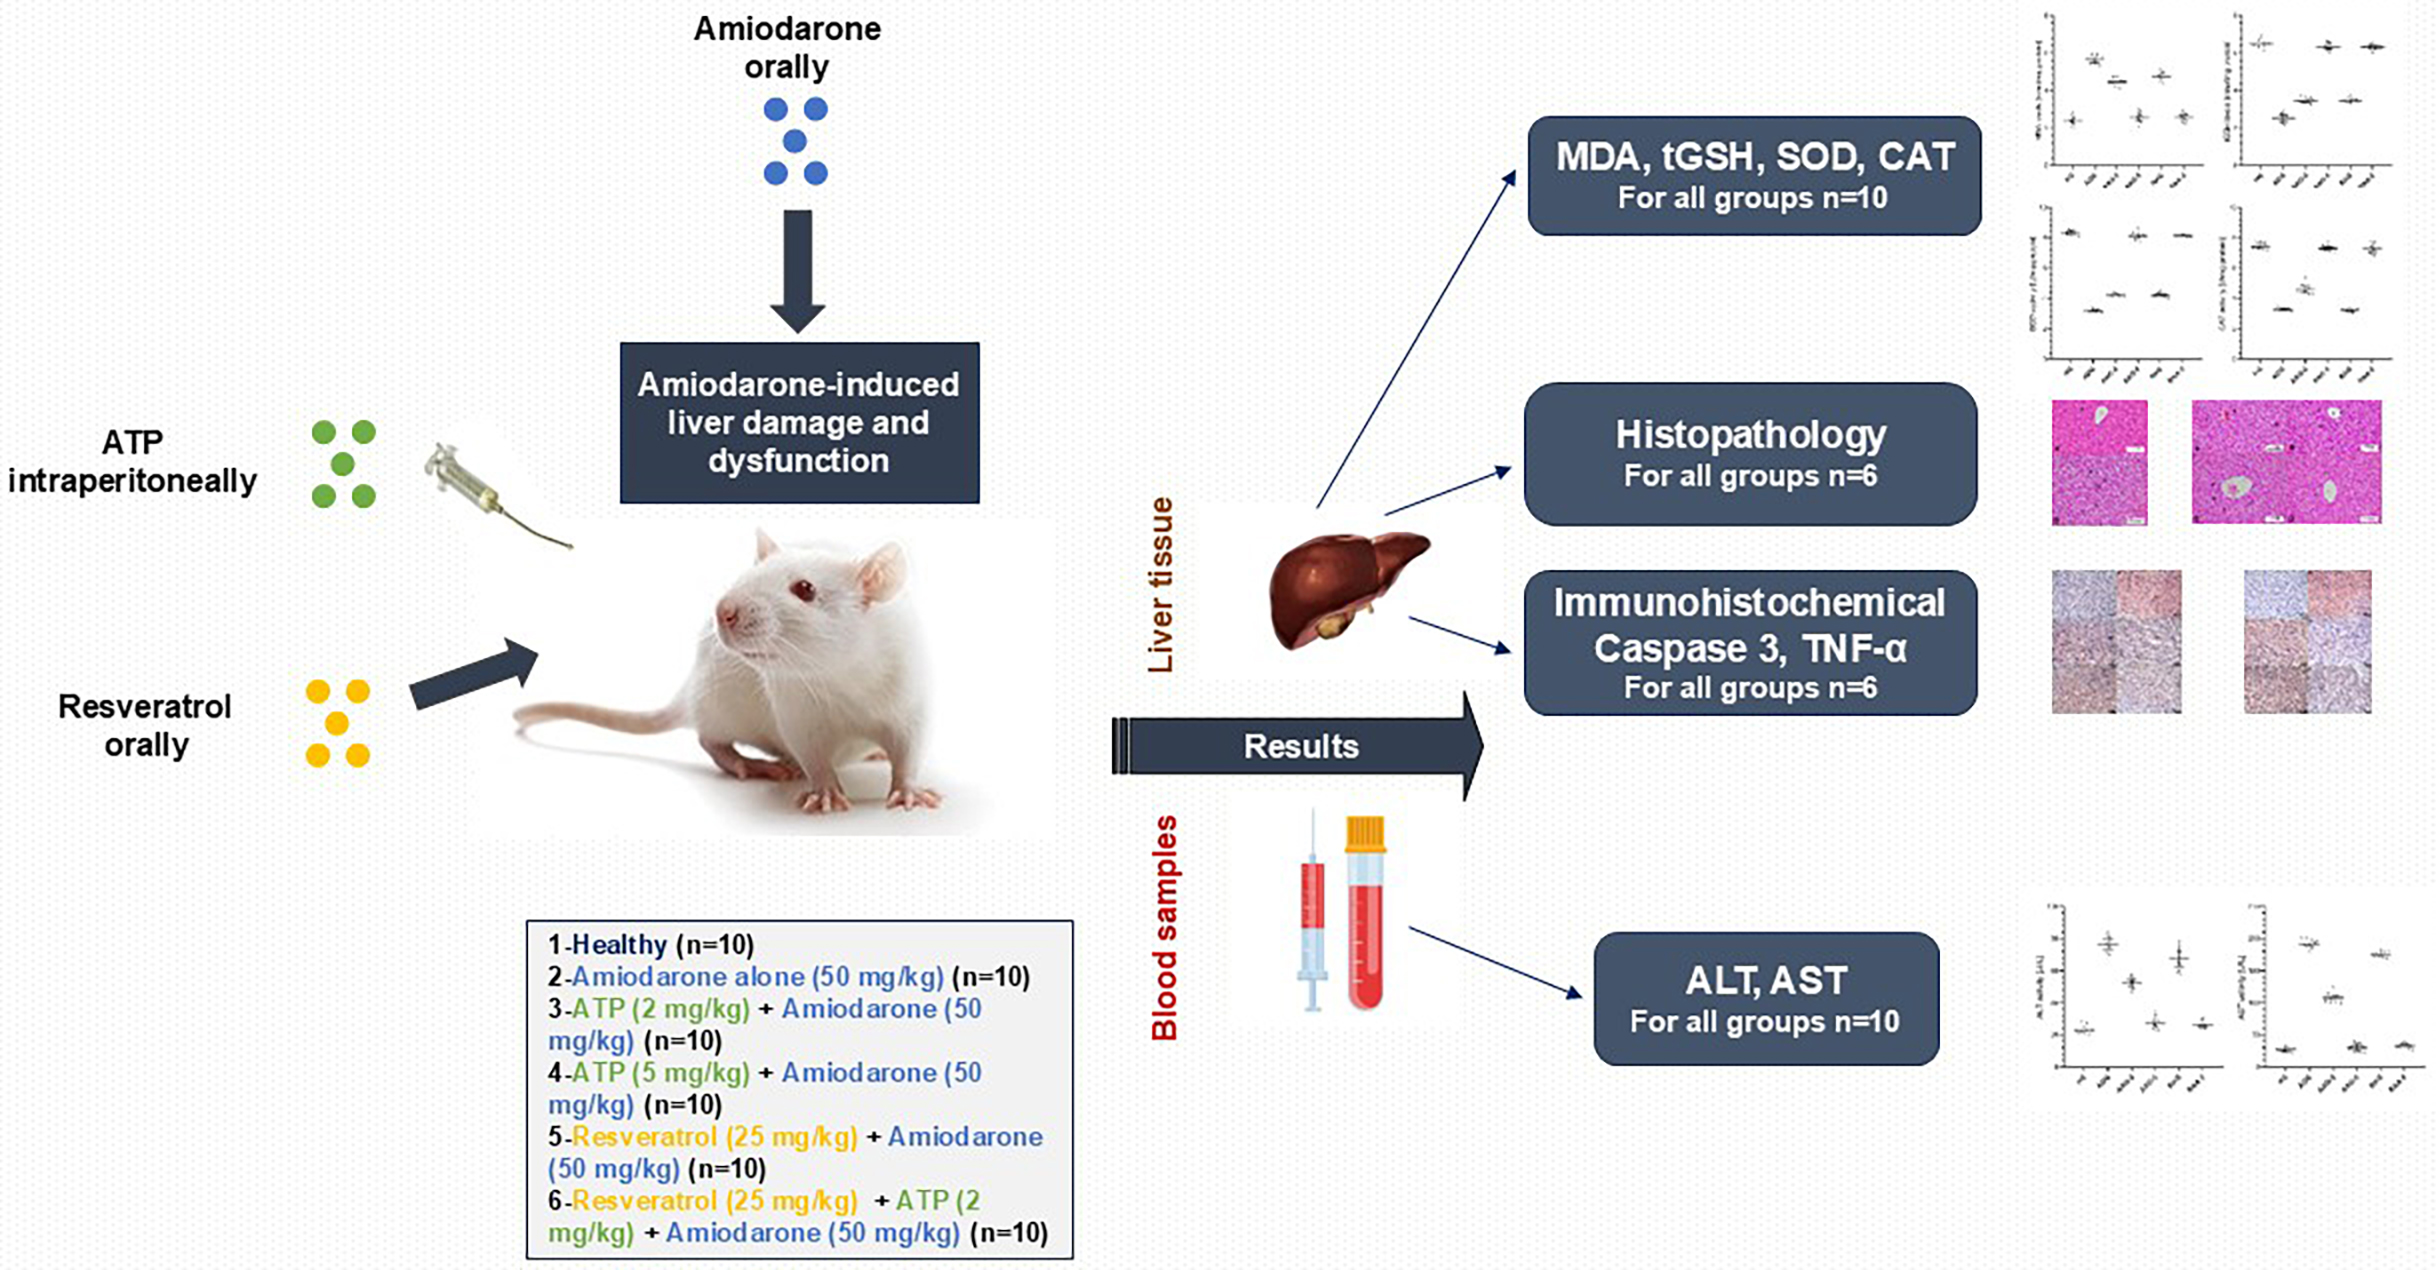
Background. Amiodarone is the most commonly used class III antiarrhytmic drug with antiarrhytmic and vasodilator properties. Adenosine triphosphate (ATP) serves as a crucial source of intracellular energy, while resveratrol is known for its potent antioxidant activity.
Objectives. This study aimed to biochemically, histopathologically and immunohistochemically evaluate the effects of ATP, resveratrol and their combination on potential liver damage and dysfunction induced by amiodarone in rats.
Materials and methods. The rats were divided into 6 groups: healthy control (HG), amiodarone alone (ADG), amiodarone + ATP at 2 mg/kg (AAG-2), amiodarone + ATP at 5 mg/kg (AAG-5), resveratrol + amiodarone (RAG), and resveratrol + amiodarone + ATP at 2 mg/kg (RAA-2). Amiodarone (50 mg/kg, orally), ATP (2 mg/kg and 5 mg/kg, intraperitoneally) and resveratrol (25 mg/kg, orally) were administered once daily for 14 days. Following treatment, liver tissues were excised for biochemical analysis. Oxidative stress was assessed by measuring malondialdehyde (MDA) levels, while antioxidant status was evaluated through total glutathione (GSH), superoxide dismutase (SOD) and catalase (CAT) levels. To assess liver function, alanine aminotransferase (ALT) and aspartate aminotransferase (AST) activities were measured in serum samples collected from the animals’ tail veins. In addition, liver tissues were subjected to histopathological and immunohistochemical examination to evaluate structural and molecular changes associated with treatment.
Results. Amiodarone administration led to a significant increase in oxidative stress markers and a reduction in antioxidant levels in rat liver tissue. Additionally, serum levels of ALT and AST were elevated, indicating liver dysfunction. Histopathological and immunohistochemical analyses revealed severe (grade 3) oxidative damage in the liver tissue. All biochemical parameters in the 5 mg/kg ATP and resveratrol + 2 mg/kg ATP treatment groups were comparable to those observed in the HG group. Histopathological and immunohistochemical evaluations showed a reduction in liver damage severity to grade 2 in the groups treated with ATP (2 mg/kg) and resveratrol alone, and to grade 1 in the groups receiving ATP (5 mg/kg) or the combination of resveratrol + ATP (2 mg/kg).
Conclusions. The results of the present study suggest that adjusting the ATP dosage or using a combination of ATP and resveratrol may be effective strategies for minimizing amiodarone-induced liver damage.
Key words: rats, resveratrol, amiodarone, adenosine triphosphate, oxidative liver damage
Background
Amiodarone, a benzofuran derivative with antiarrhythmic and vasodilator properties, is the most commonly used Vaughan–Williams class III antiarrhythmic drug today.1 Amiodarone is approved by the U.S. Food and Drug Administration (FDA) for the treatment of ventricular arrhythmias. However, it is also used off-label for the treatment of supraventricular tachyarrhythmias, such as atrial fibrillation (AF), and for the prevention of ventricular tachyarrhythmias in high-risk patients.2 According to the European Society of Cardiology’s (ESC) 2020 guideline, amiodarone is recommended in addition to β-blockers to prevent AF following cardiac surgery, regardless of risk factors.3 Although β-blockers are often used as first-line antiarrhythmic therapy, amiodarone may be needed in some cases.1 Amiodarone’s ability to block sodium, potassium and calcium channels as well as adrenergic receptors4 may be an important reason for its need. However, serious and potentially life-threatening side effects can occur with long-term treatment with amiodarone.5 It is known to be toxic to organs and tissues such as the thyroid, lungs, heart, liver, eyes, skin, and central and peripheral nervous system.6, 7 Previous studies have suggested that the formation of reactive oxygen species (ROS) leading to lipid peroxidation (LPO) and oxidative stress is an important component of amiodarone toxicity.8 In addition, mitochondrial adenosine triphosphate (ATP) content in hepatocytes was found to decrease in parallel with the amiodarone-induced increase in mitochondrial ROS.9 However, amiodarone has been shown to significantly reduce cellular ATP levels and cell viability even at low concentrations.10 Adenosine triphosphate is recognized as one of the most vital molecules for cellular function, playing critical roles both intracellularly and extracellularly. It is a crucial component in the biosynthesis of nucleic acids and a significant source of intracellular energy.11 The literature suggests that amiodarone-induced tissue damage may be linked to increased production of ROS caused by ATP deficiency. Adenosine triphosphate is known to play a role in the synthesis of antioxidants that scavenge and neutralize ROS.12 Adenosine triphosphate also acts as an energy source for the antioxidants synthesis.13 Additionally, resveratrol – a natural polyphenol – is included in this study to evaluate its potential protective effect against amiodarone-induced liver damage.14 Resveratrol was first extracted from the Vera oleifera root by the Japanese scientist Takaoka in 1939.14 Resveratrol can currently be obtained from over 70 different plants, including peanuts, grapes, Polygonum cuspidatum, and mulberries.14, 15 It has demonstrated a wide range of biological activities, including anti-inflammatory, antioxidant, cardioprotective, anti-carcinogenic, anti-diabetic, anti-obesity, neuroprotective, and anti-aging effects.16 Resveratrol is also known to enhance intracellular ATP production.17
Objectives
The literature suggests that oxidative liver damage induced by amiodarone may be related to increased production of ROS due to ATP deficiency. In addition, the literature suggests that ATP, resveratrol, and their combination – referred to as ATP-resveratrol combinations (ARCs) – may offer therapeutic benefits in the treatment of amiodarone-induced oxidative liver injury. Furthermore, there are no available data on the protective effects of ATP, resveratrol and ARCs against oxidative liver damage induced by amiodarone. Therefore, the aim of our study was to investigate and compare the protective effects of ATP, resveratrol and ARCs against potential amiodarone-induced liver damage and dysfunction in rats.
Materials and methods
Animals
The experiment involved 60 male albino Wistar-type rats weighing 280–292 g and aged 9–10 weeks. Animals were purchased from the Experimental Animals Application and Research Centre (Erzincan Binali Yıldırım University, Erzincan, Turkey). The animals were randomized into 6 groups so that the average body weight of each group was similar to the others. Prior to the experiment, the rats were housed in groups of 10 in wire cages under laboratory conditions, maintained at 22°C with 30–70% humidity and a 12-h light/dark cycle. Animals were given tap water and standard pellet feed (Experimental Animal Feed; Bayramoglu Co., Erzurum, Turkey) ad libitum. All experiments were carried out according to the guidelines of Directive 2010/63/EU of the European Parliament and Council (approval No. 2016-24-199) and the Animal Research: Reporting of In Vivo Experiments (ARRIVE) guidelines.18 All procedures were carried out with the approval of Erzincan Binali Yıldırım University Animal Experiments Local Ethics Committee (meeting date: November 30, 2023, meeting No. 2023/11, decision No. 39).
Chemical substances
The chemicals used in the experiment were thiopental sodium supplied by IE Ulagay (Istanbul, Turkey), ATP purchased from Zdorove Narodu (Kharkiv, Ukraine) and resveratrol obtained from Sigma-Aldrich (St. Louis, USA).
Experimental design
The minimum number of animals was selected in accordance with the Reduction, Refinement, Replacement, Responsibility (4R) guidelines to ensure ethical and responsible use of experimental subjects.19 Animals displaying signs such as hunched posture, reduced movement or injury caused by other animals were excluded from the experiment and corresponding data points were omitted from the analysis. There were no exclusions during the experiment. A random numbers table was used to generate the randomization sequence. Cages and animals were numbered to minimize potential confounding factors.
Experimental groups
Six groups of rats were used in the experiment: healthy control (HG), amiodarone alone (ADG), amiodarone + 2 mg/kg ATP (AAG-2), amiodarone + 5 mg/kg ATP (AAG-5), amiodarone + resveratrol (RAG), and amiodarone + resveratrol + 2 mg/kg ATP (RAA-2).
Experimental procedure
The AAG-2 group (n = 10) was administered an intraperitoneal (i.p.) injection of ATP at a dose of 2 mg/kg, while the AAG-5 group (n = 10) was administered the same injection at a dose of 5 mg/kg. The RAG group (n = 10) received resveratrol at a dose of 25 mg/kg orally via gastric gavage. The RAA-2 group (n = 10) was administered resveratrol (25 mg/kg) and ATP (2 mg/kg) as described above. Distilled water was used as the solvent for both the HG (n = 10) and ADG (n = 10) groups. One hour after the administration of ATP, resveratrol, or distilled water, amiodarone was administered orally by gastric gavage to the ADG, AAG-2, AAG-5, RAG, and RAA-2 groups at a dose of 50 mg/kg. Over a period of 14 days, the procedures were repeated once a day. Animals were sacrificed under high-dose thiopental sodium anesthesia (50 mg/kg), and liver tissues were excised at the end of this period. In the excised liver tissues, levels of malondialdehyde (MDA), total glutathione (tGSH), superoxide dismutase (SOD), and catalase (CAT) were measured. Blood samples were collected from the tail veins of the animals prior to euthanasia, and the activities of alanine aminotransferase (ALT) and aspartate aminotransferase (AST) were measured to assess liver function. Additionally, histopathological and immunohistochemical examinations were conducted on liver tissues from 6 rats randomly selected from each experimental group of 10 animals. The biochemical, histopathologic and immunohistochemical results of the experiment were compared and evaluated between groups.
Biochemical analyses
Preparation of samples
Initially, the tissue samples were rinsed with physiological saline, then pulverized in liquid nitrogen and subsequently homogenized. The protein levels of MDA, tGSH, SOD, and CAT were determined in the supernatants.
Determination of the protein levels of MDA, tGSH, SOD and CAT
Commercially available rat enzyme-linked immunosorbent assay kits (MDA product No. 10009055; tGSH product No. 703002; SOD product No. 706002; Cayman Chemical Co., Ann Arbor, USA) were purchased for the measurement of MDA, tGSH and SOD parameters. The method suggested by Góth was applied to perform CAT determination.20 Protein concentration was determined using the Bradford method, with absorbance measured spectrophotometrically at 595 nm.21
Measurement of ALT and AST activities
Venous blood samples were collected into anticoagulant-free tubes for serum separation. Serum was separated by centrifuging after blood clotting and kept at −80°C until the assay was performed. Liver function tests were performed by measuring serum ALT and AST activities spectrophotometrically using commercially available kits on a Cobas® 8000 auto-analyzer (Roche Diagnostics GmbH, Mannheim, Germany).
Histopathological examination
Tissue samples were fixed in 10% formaldehyde solution for 72 h. After fixation, the tissues were placed in cassettes and rinsed under running water for 24 h. They were then dehydrated by passing through a series of increasing degrees of alcohol (70%, 80%, 90%, and 100%). The xylol-transparent liver tissues were embedded in paraffin blocks, and 4–5-μm-thick sections were taken. The sections were stained with hematoxylin and eosin (H&E) double stain and evaluated and photographed using the Olympus DP2-SAL firmware program (Olympus Corp., Tokyo, Japan). In the serial sections obtained, six areas (1 central and 5 peripheral) were selected per section for each experimental group. At a ×100 magnification, deviations from normal histological structure were scored based on hepatocyte vacuolization, necrosis, vascular dilatation/congestion, and polymorphonuclear leukocyte (PMNL) infiltration. Each of the above criteria was scored on a scale from 0 to 3 (0 – none, 1 – mild, 2 – moderate, 3 – severe). Histopathological evaluations were performed by a histologist who was blinded to the experimental group assignments.
Immunohistochemical examination
Briefly, 4 μm-thick sections mounted on polylysine-coated slides were deparaffinized in xylene and rehydrated through a graded alcohol series. After rinsing with phosphate-buffered saline (PBS), endogenous peroxidase activity was blocked by incubating the sections in 3% hydrogen peroxide (H2O2) for 10 min. In order to reveal the antigen in the tissues, it was treated with antigen retrieval solution at 500 W for 2 × 5 min. Later, cleaved caspase-3 (product No. E-AB-30004; Elabscience, Houston, USA) and tumor necrosis factor alpha (TNF-α; product No. sc-133192; Santa Cruz Biotechnology, Inc., Santa Cruz, USA) were incubated overnight with primary antibodies (dilution 1/200). Large Volume Detection System (anti-polyvalent, horseradish peroxidase (HRP); product No. TP-125-HL; Thermo Fisher Scientific Inc., Waltham, USA) was applied as recommended by the manufacturer. Subsequently, 3-amino-9-ethylcarbazole (AEC) was used as the chromogen. The sections were then counterstained with Mayer’s hematoxylin, mounted with an aqueous mounting medium, and examined under a light microscope. Immunoreactivities were semi-quantitatively evaluated as none (0), mild (1), moderate (2), and severe (3).
Statistical analyses
All statistical analyses were carried out using IBM SPSS v. 27.0 (IBM Corp., Armonk, USA). Figures were generated using GraphPad Prism v. 8.0.1 (GraphPad Software, San Diego, USA). All biochemical results are expressed as mean ±standard deviation (mean ±SD) along with the 95% confidence interval (95% CI) of the mean. The assumption of normality was evaluated with Shapiro–Wilk test and the assumption of homogeneity of variances was evaluated with Levene’s test. One-way analysis of variance (ANOVA) or Welch’s ANOVA test was used to assess differences in means between groups. Pairwise comparisons regarding these tests were made with Tukey’s honestly significant difference (HSD) and Games–Howell test, respectively. All histopathological and immunohistochemical results are presented as median and minimum and maximum. In the histopathological and immunohistochemical evaluation, the difference between the groups in terms of median values was determined using the Kruskal–Wallis test, a nonparametric test. Dunn’s test with Bonferroni correction was used for pairwise comparisons between groups, and adjusted p-values are presented. A p < 0.05 was deemed statistically significant.
Results
Biochemical findings
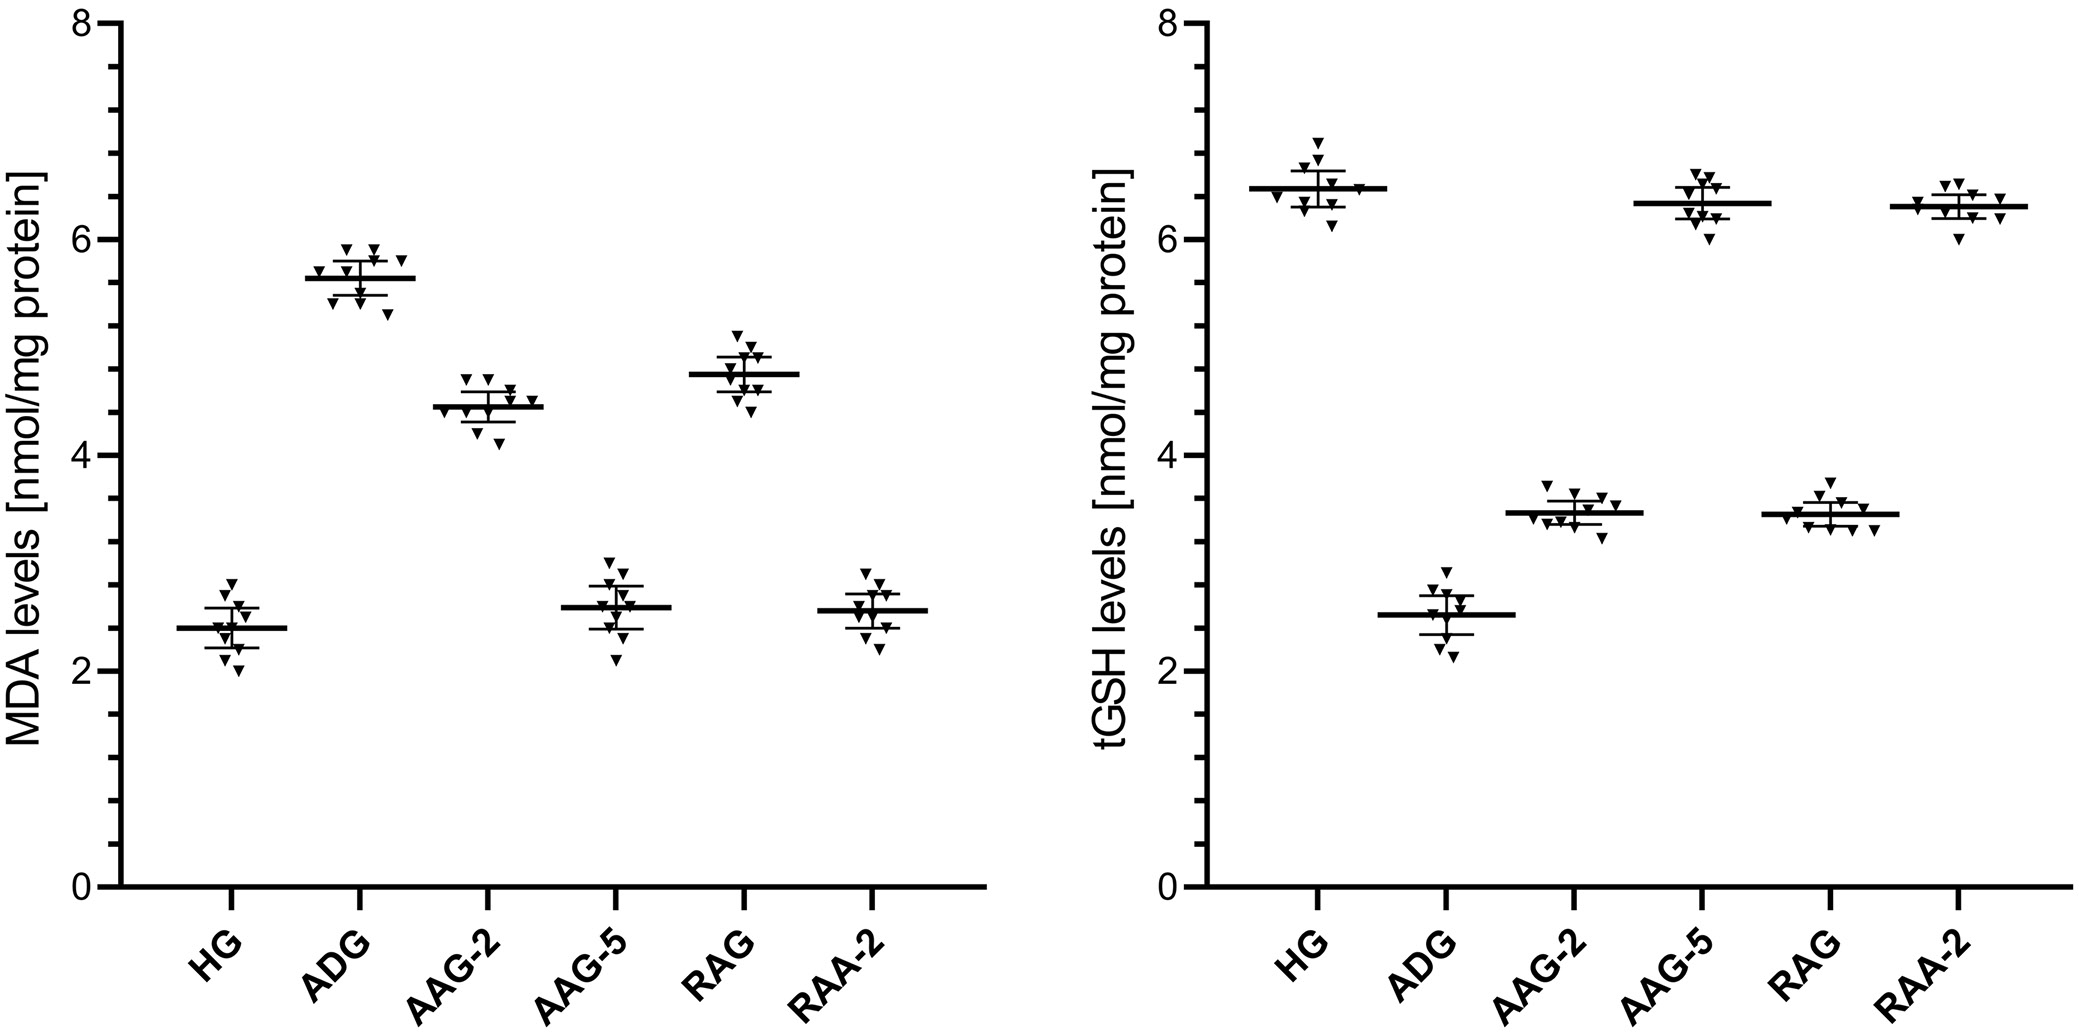
MDA analysis results of liver tissue
The MDA levels in liver tissue were higher in the amiodarone-treated group than in the healthy group, as shown in Figure 1 and Table 1, Table 2. The difference in the levels of MDA in the liver tissue between the healthy group and the group treated with amiodarone was statistically significant. In addition, ATP 2 mg/kg and 5 mg/kg, resveratrol, and resveratrol + ATP 2 mg/kg treatment significantly suppressed the amiodarone-induced rise in MDA levels in liver tissue. In the groups treated with ATP 2 mg/kg and resveratrol, a statistically significant difference in MDA levels was found in the liver tissues compared to the healthy group. However, the difference in MDA levels between the healthy group and the groups treated with ATP 5 mg/kg and resveratrol + ATP 2 mg/kg was not statistically significant.
tGSH analysis results of liver tissue
As shown in Figure 1 and Table 1, Table 2, the levels of tGSH in the liver tissue were lower in the group treated with amiodarone than in the HG. The difference in liver tGSH levels between the HG and the amiodarone-treated group was statistically significant. Furthermore, the amiodarone-induced reduction in liver tGSH levels was significantly attenuated by treatment with ATP at 2 mg/kg and 5 mg/kg, resveratrol alone, and the combination of resveratrol + ATP at 2 mg/kg. In the ATP 2 mg/kg and resveratrol-treated groups, a statistically significant difference in tGSH levels was found in liver tissue compared to HG. However, the difference in tGSH levels between the HG and the groups treated with ATP 5 mg/kg and resveratrol + ATP 2 mg/kg was not statistically significant.
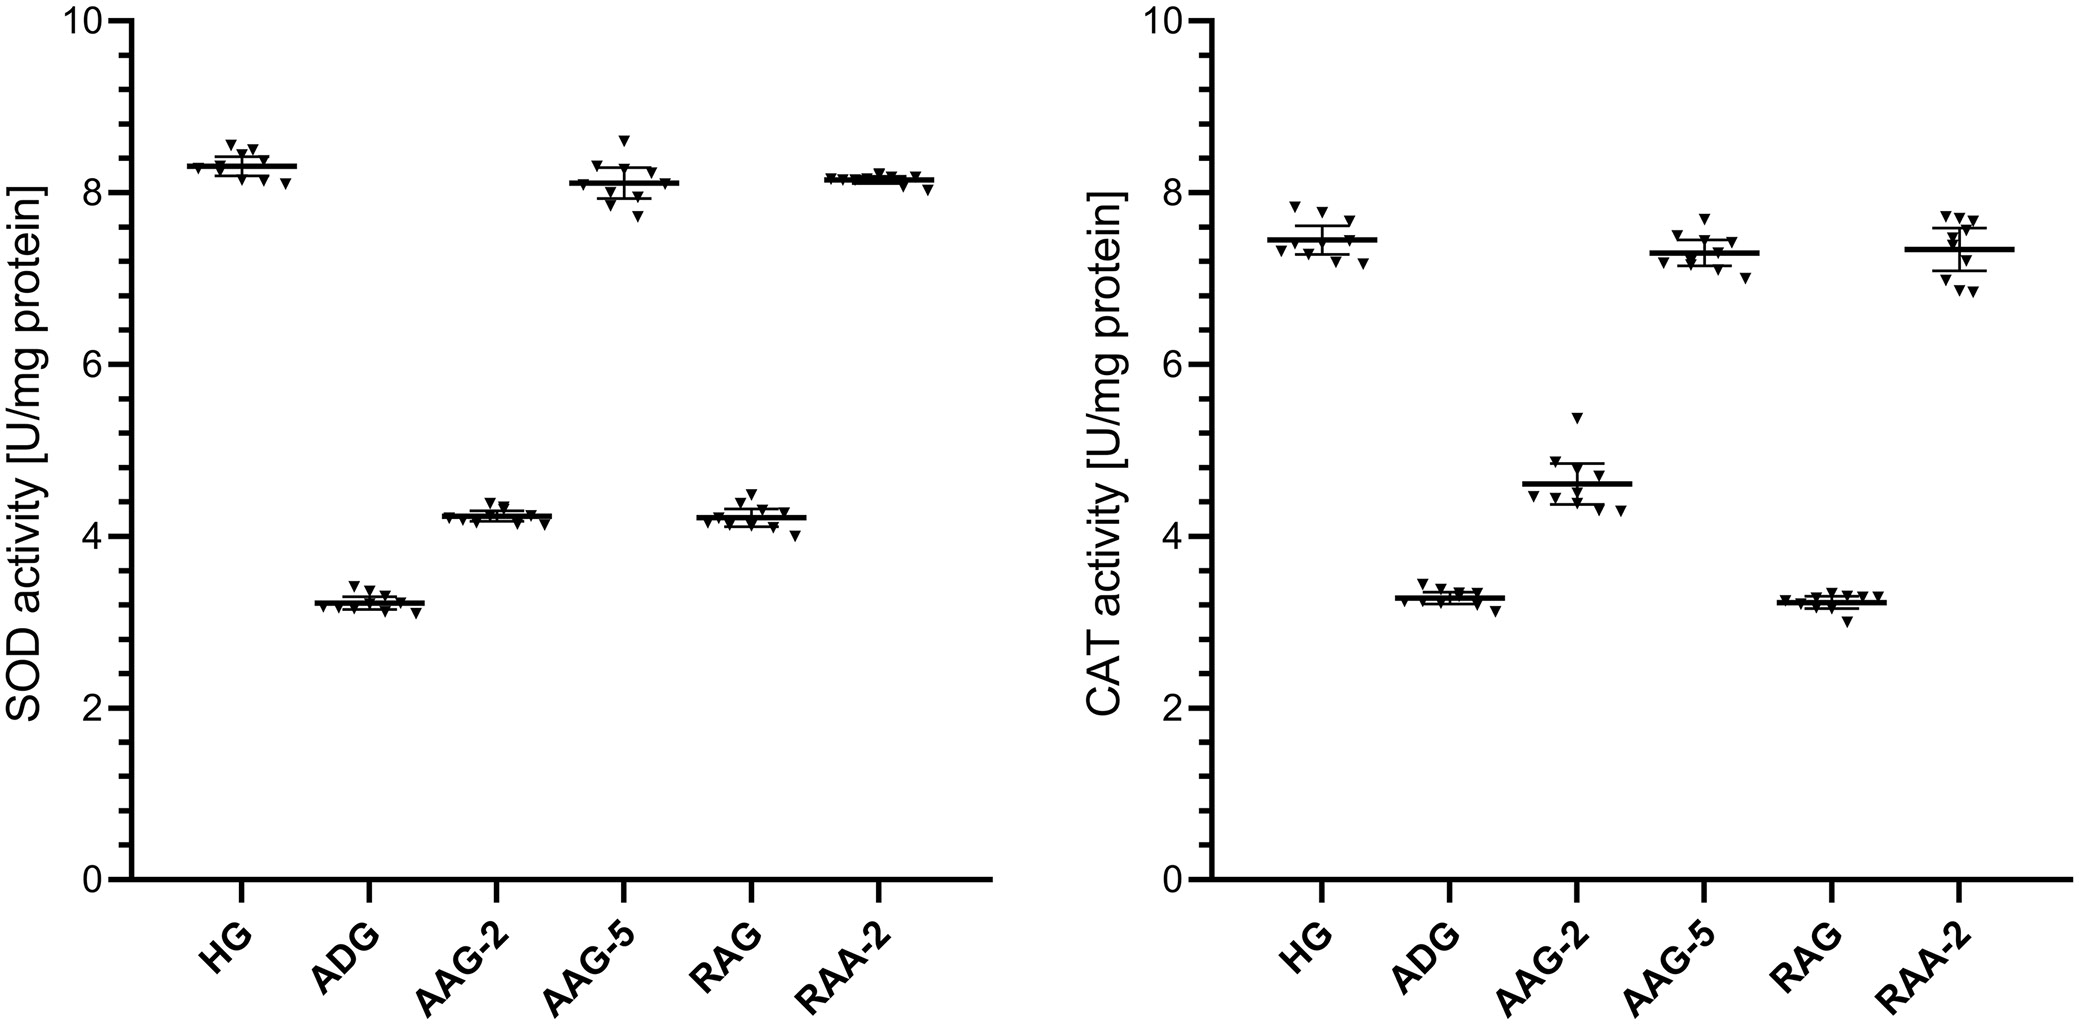
SOD analysis results of liver tissue
The activities of SOD in the liver tissue were lower in the group treated with amiodarone than in the HG, as shown in Figure 2 and in Table 1, Table 2. The difference in liver SOD activities between the HG and the group treated with amiodarone was statistically significant. In addition, ATP 2 mg/kg, ATP 5 mg/kg, resveratrol and resveratrol + ATP 2 mg/kg treatment significantly suppressed the amiodarone-induced decrease in SOD activities in liver tissue. In the groups treated with ATP at 2 mg/kg and resveratrol, liver SOD activity showed a statistically significant difference compared to the HG group. However, the difference in SOD activity between the HG and the ATP 5 mg/kg and resveratrol + ATP 2 mg/kg treatment groups was not statistically significant.
CAT analysis results of liver tissue
As shown in Figure 2 and Table 1, Table 2, the activities of CAT in the liver tissue were lower in the group treated with amiodarone than in the HG group. The difference in liver CAT activities between the HG group and the amiodarone-treated group was statistically significant. Treatment with ATP at 2 mg/kg, ATP at 5 mg/kg, and the combination of resveratrol + ATP at 2 mg/kg significantly suppressed the amiodarone-induced decrease in CAT activity in liver tissue, whereas resveratrol alone did not produce a significant effect. In the groups treated with ATP 2 mg/kg and resveratrol, a statistically significant difference in liver CAT activities was observed compared to the HG group. However, the difference in CAT activity between the HG and the ATP 5 mg/kg and resveratrol + ATP 2 mg/kg treatment groups was not statistically significant.
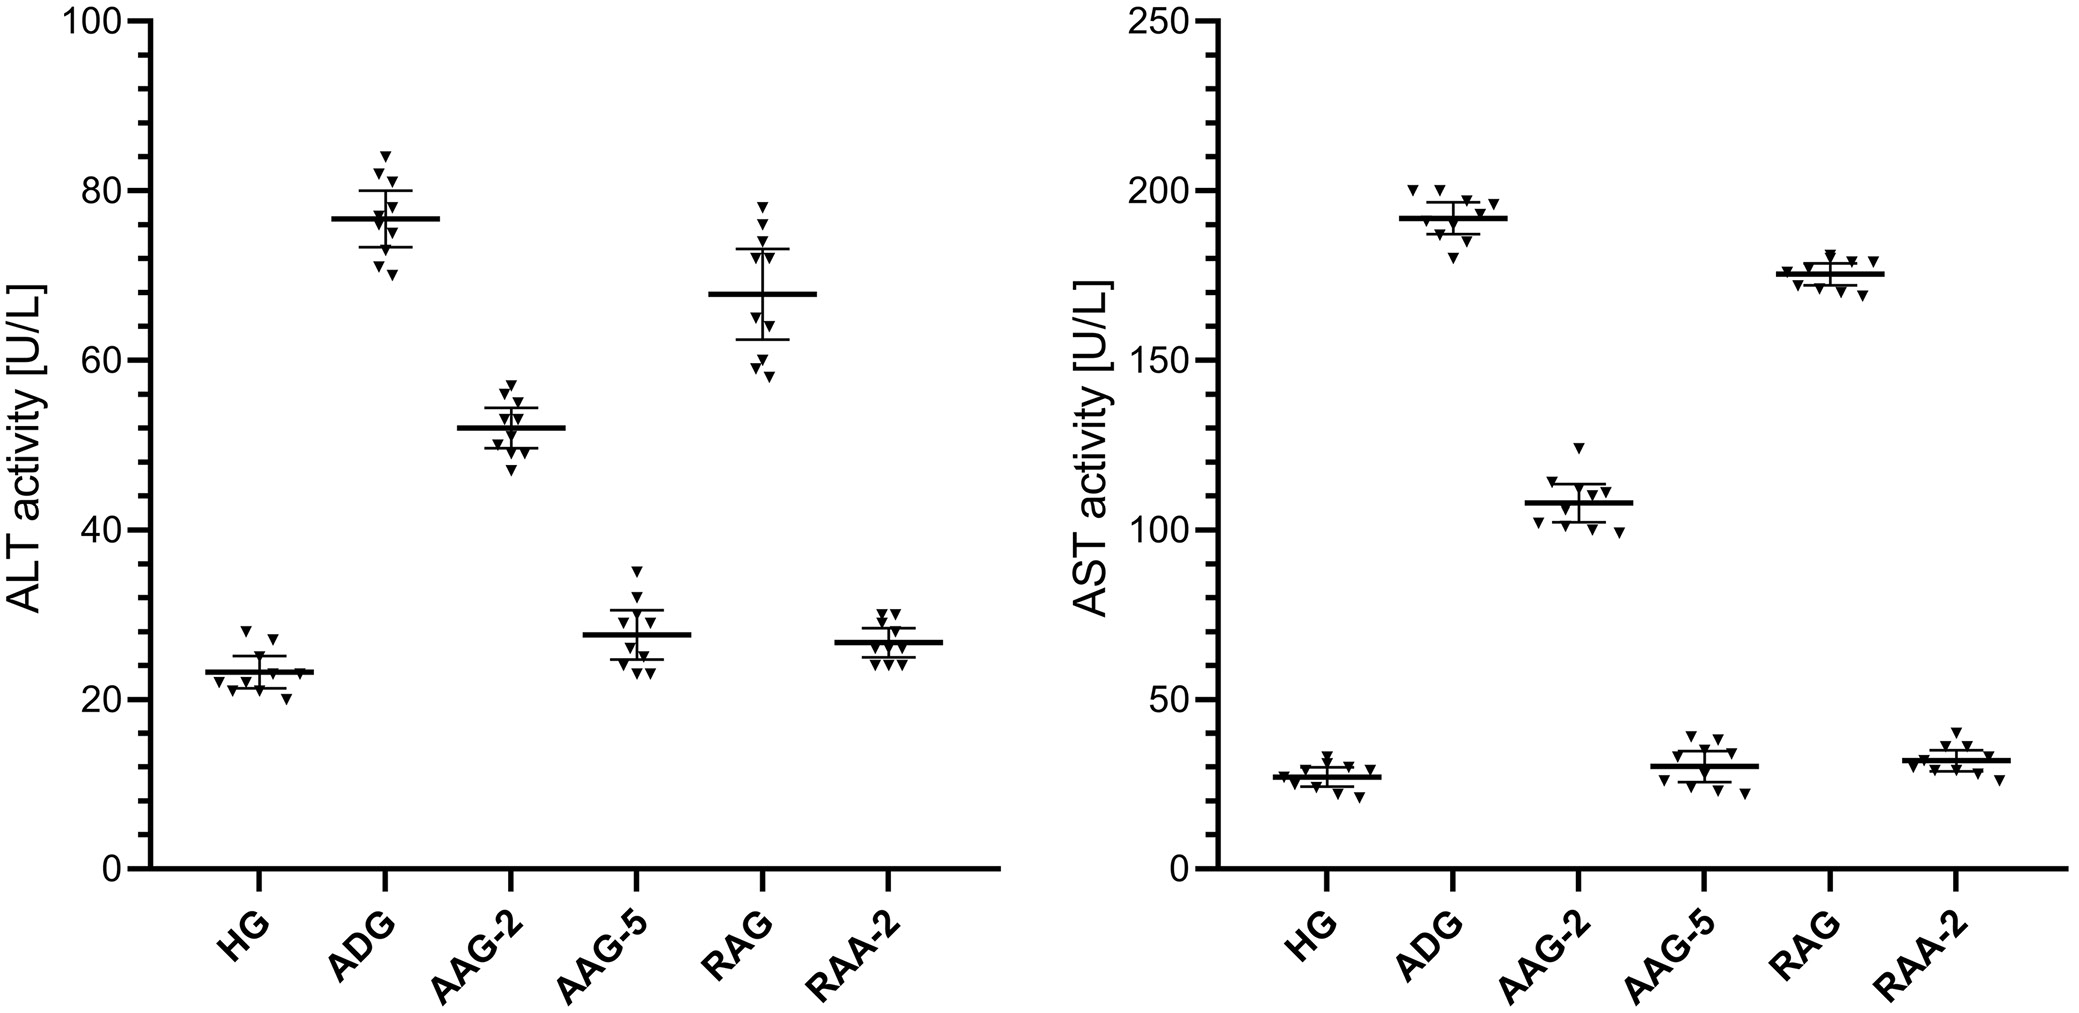
ALT and AST analysis results of blood serum
The ALT activity in blood serum was higher in the amiodarone-treated group than in the HG group, as shown in Figure 3 and Table 1, Table 2. The difference in serum ALT activity between the HG group and the amiodarone-treated group was statistically significant. Notably, treatment with ATP at 2 mg/kg, ATP at 5 mg/kg, and the combination of resveratrol + ATP at 2 mg/kg significantly attenuated the amiodarone-induced increase in serum ALT levels, whereas resveratrol alone did not produce a significant effect. A statistically significant difference in blood serum ALT activity was observed in the groups treated with ATP 2 mg/kg and resveratrol compared to the HG group. However, the difference in ALT activity between the HG and the treatment groups with ATP 5 mg/kg and resveratrol + ATP 2 mg/kg was not statistically significant.
As shown in Figure 3 and Table 1, Table 2, the activity of AST in the blood serum was higher in the group treated with amiodarone than in the HG group. The difference in serum AST activities between the HG and the amiodarone treatment group was statistically significant. In addition, treatment with ATP 2 mg/kg, ATP 5 mg/kg, resveratrol and resveratrol + ATP 2 mg/kg significantly suppressed the amiodarone-induced increase in serum AST activity. In the groups treated with ATP 2 mg/kg and resveratrol, a statistically significant difference in blood serum AST activity was observed compared to the HG group. However, the difference in AST activity between the HG and the ATP 5 mg/kg and resveratrol + ATP 2 mg/kg treatment groups was not statistically significant.
Histopathological findings
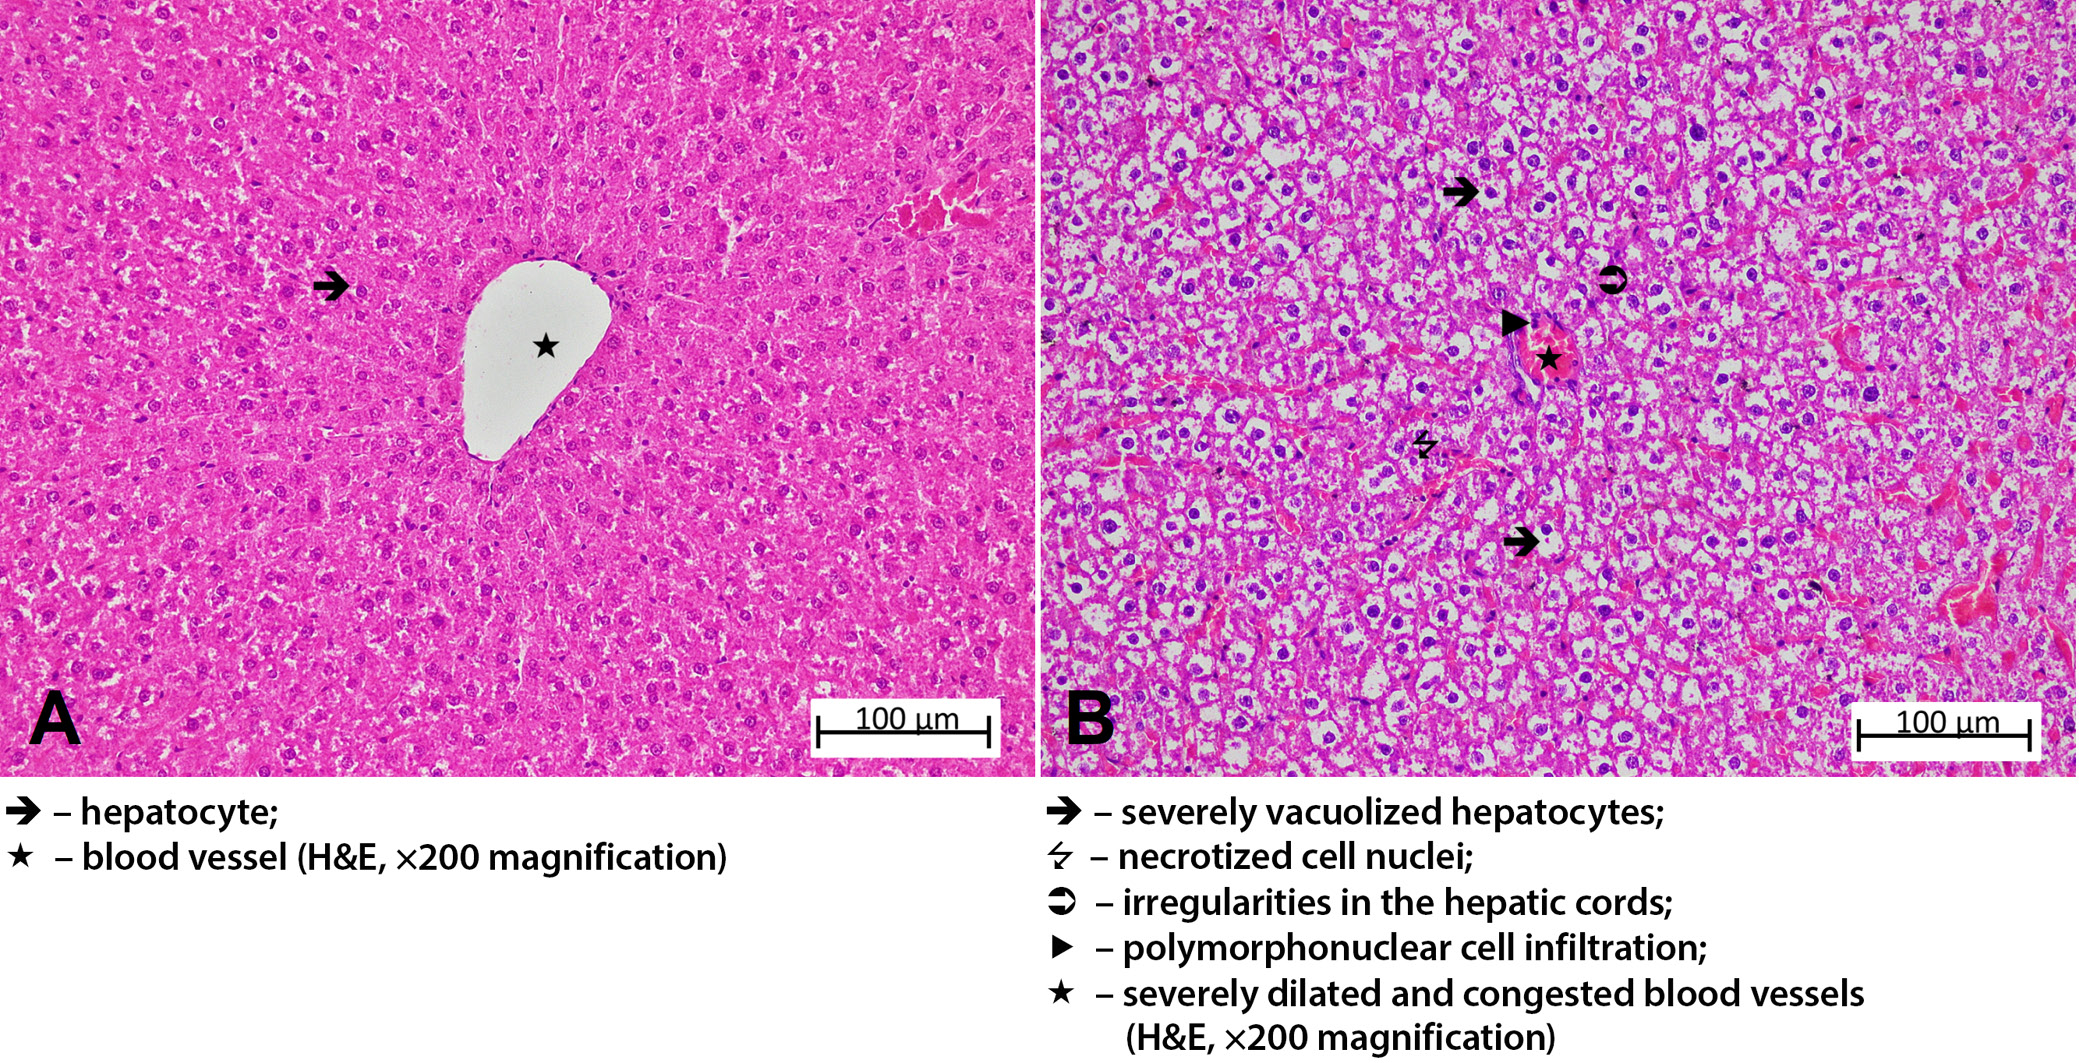
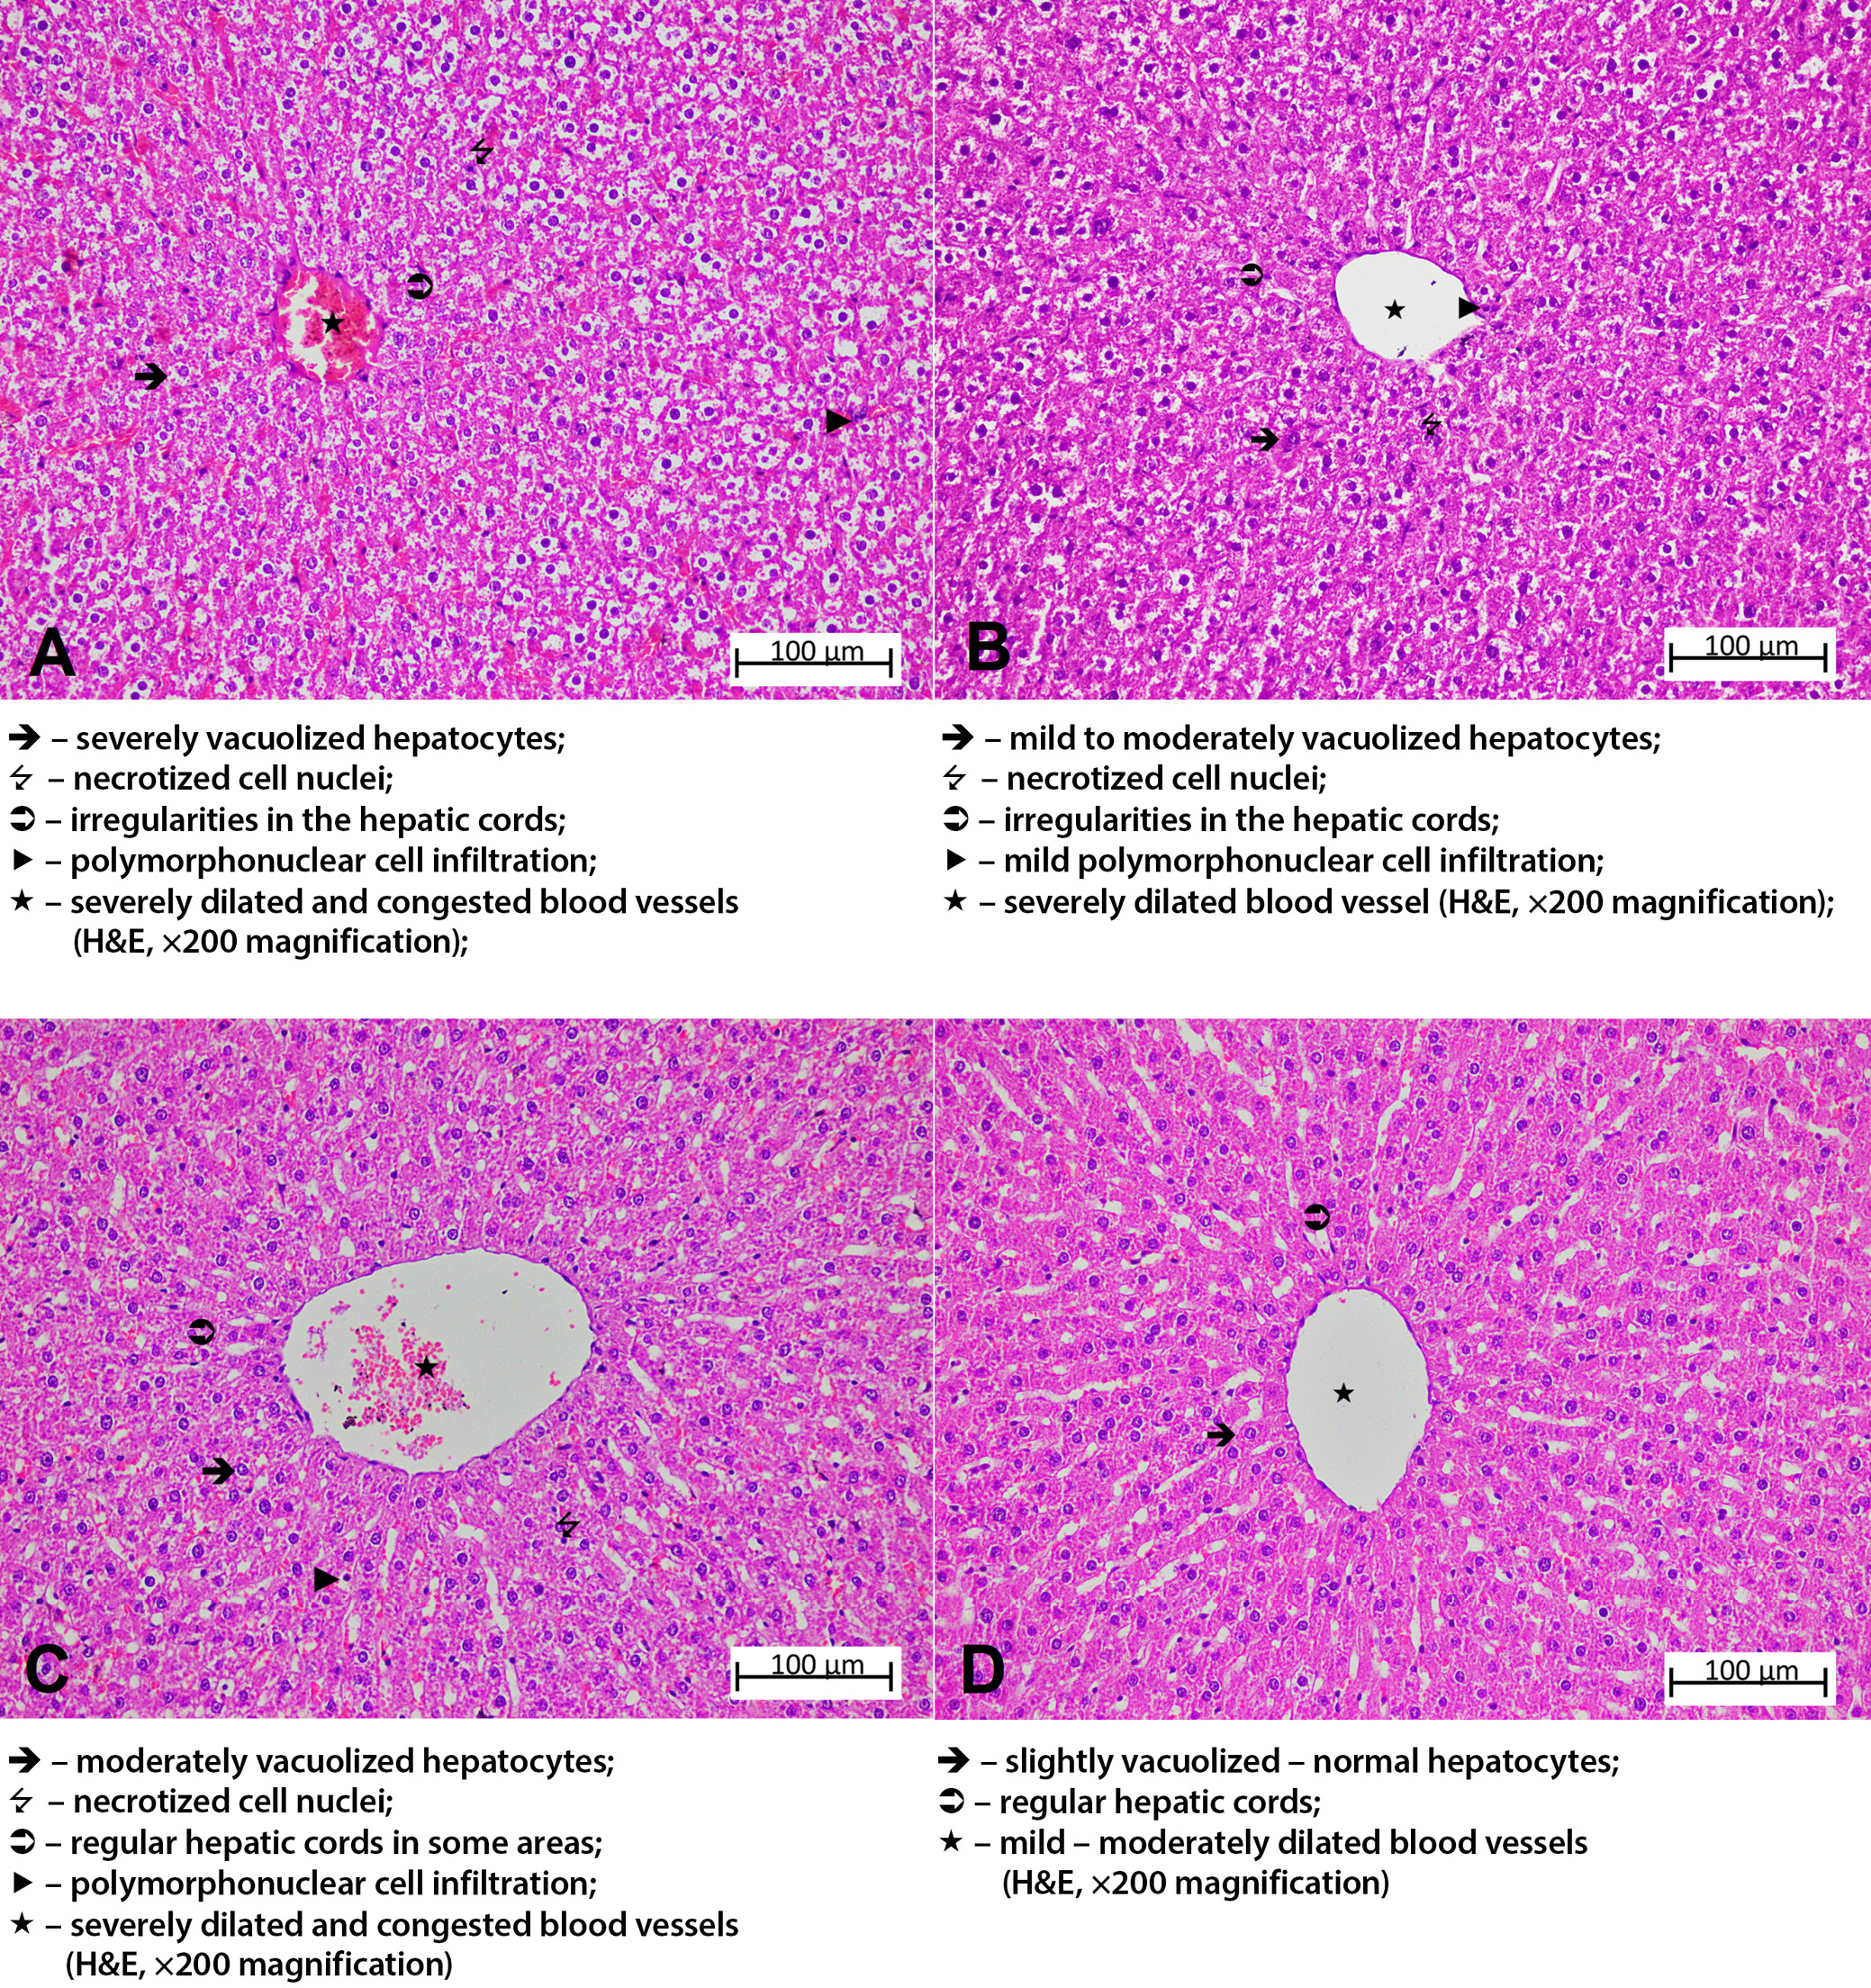
The liver tissue sections of the HG group exhibited normal hepatic cords with radial arrangement in the hepatic lobule, with a central vein in the center. The general tissue arrangement of the liver was also normal (Figure 4A). Histopathological damage was classified as grade 3 in the group treated with amiodarone alone. Upon analysis of the liver tissue from this group, severe dilatation and congestion were observed in both the central artery and the surrounding blood vessels. It was observed that the hepatic cords lost their radial arrangement and became irregular and spiralized cords. Severe lipid infiltration was observed in the irregularly arranged hepatocyte cords around the central vein, with the cell content almost completely filled with lipid and becoming vacuolized. The liver tissue exhibited necrosis in some of the hepatocytes, and there was PMNL infiltration throughout the tissue, along with other accompanying findings (Figure 4B). The histopathological damage was grade 2 in the group that received amiodarone and 2 mg/kg ATP. In this group, while necrotic nuclei were decreased compared to the amiodarone group, the hepatic cords remained disorganized, hepatocytes were severely vacuolized. Vascular structures showed severe dilation and congestion, and PMNL infiltration was seen in the areas surrounding the vessels (Figure 5A). In the group administered amiodarone and ATP at a dose of 5 mg/kg, hepatic damage was evaluated as grade 1. The liver tissue of this group showed a decrease in lipid infiltration in hepatocytes forming irregular hepatic cords, a decrease in necrotized nuclei compared to the previous group, and the presence of mild PMNL infiltration was remarkable. Vessels were moderately dilated but did not show congestion (Figure 5B). The liver damage severity in the group treated with amiodarone and resveratrol was classified as grade 2. When the liver tissues of this group were examined, it was observed that the lipid infiltration of the hepatocytes was at a moderate level and the hepatic cords were arranged in a regular pattern. The amount of necrotic cell nuclei and the distribution of PMNLs were similar to the ADG group, while there was severe dilatation and congestion in the vessels (Figure 5C). The liver tissue of the group treated with amiodarone, 2 mg/kg ATP, and resveratrol showed similarities to that of the HG group (grade 0–1). Mild lipid accumulation was observed in the hepatocytes, forming regular hepatic cords in this group. Necrotized cells and PMNLs were not observed throughout the tissue. However, moderate dilatation of the vascular structures was observed, but they were not congested (Figure 5D). Histopathological grading data obtained from rat liver tissue and comparison of p-values are presented in Table 3, Table 4.
Immunohistochemical findings
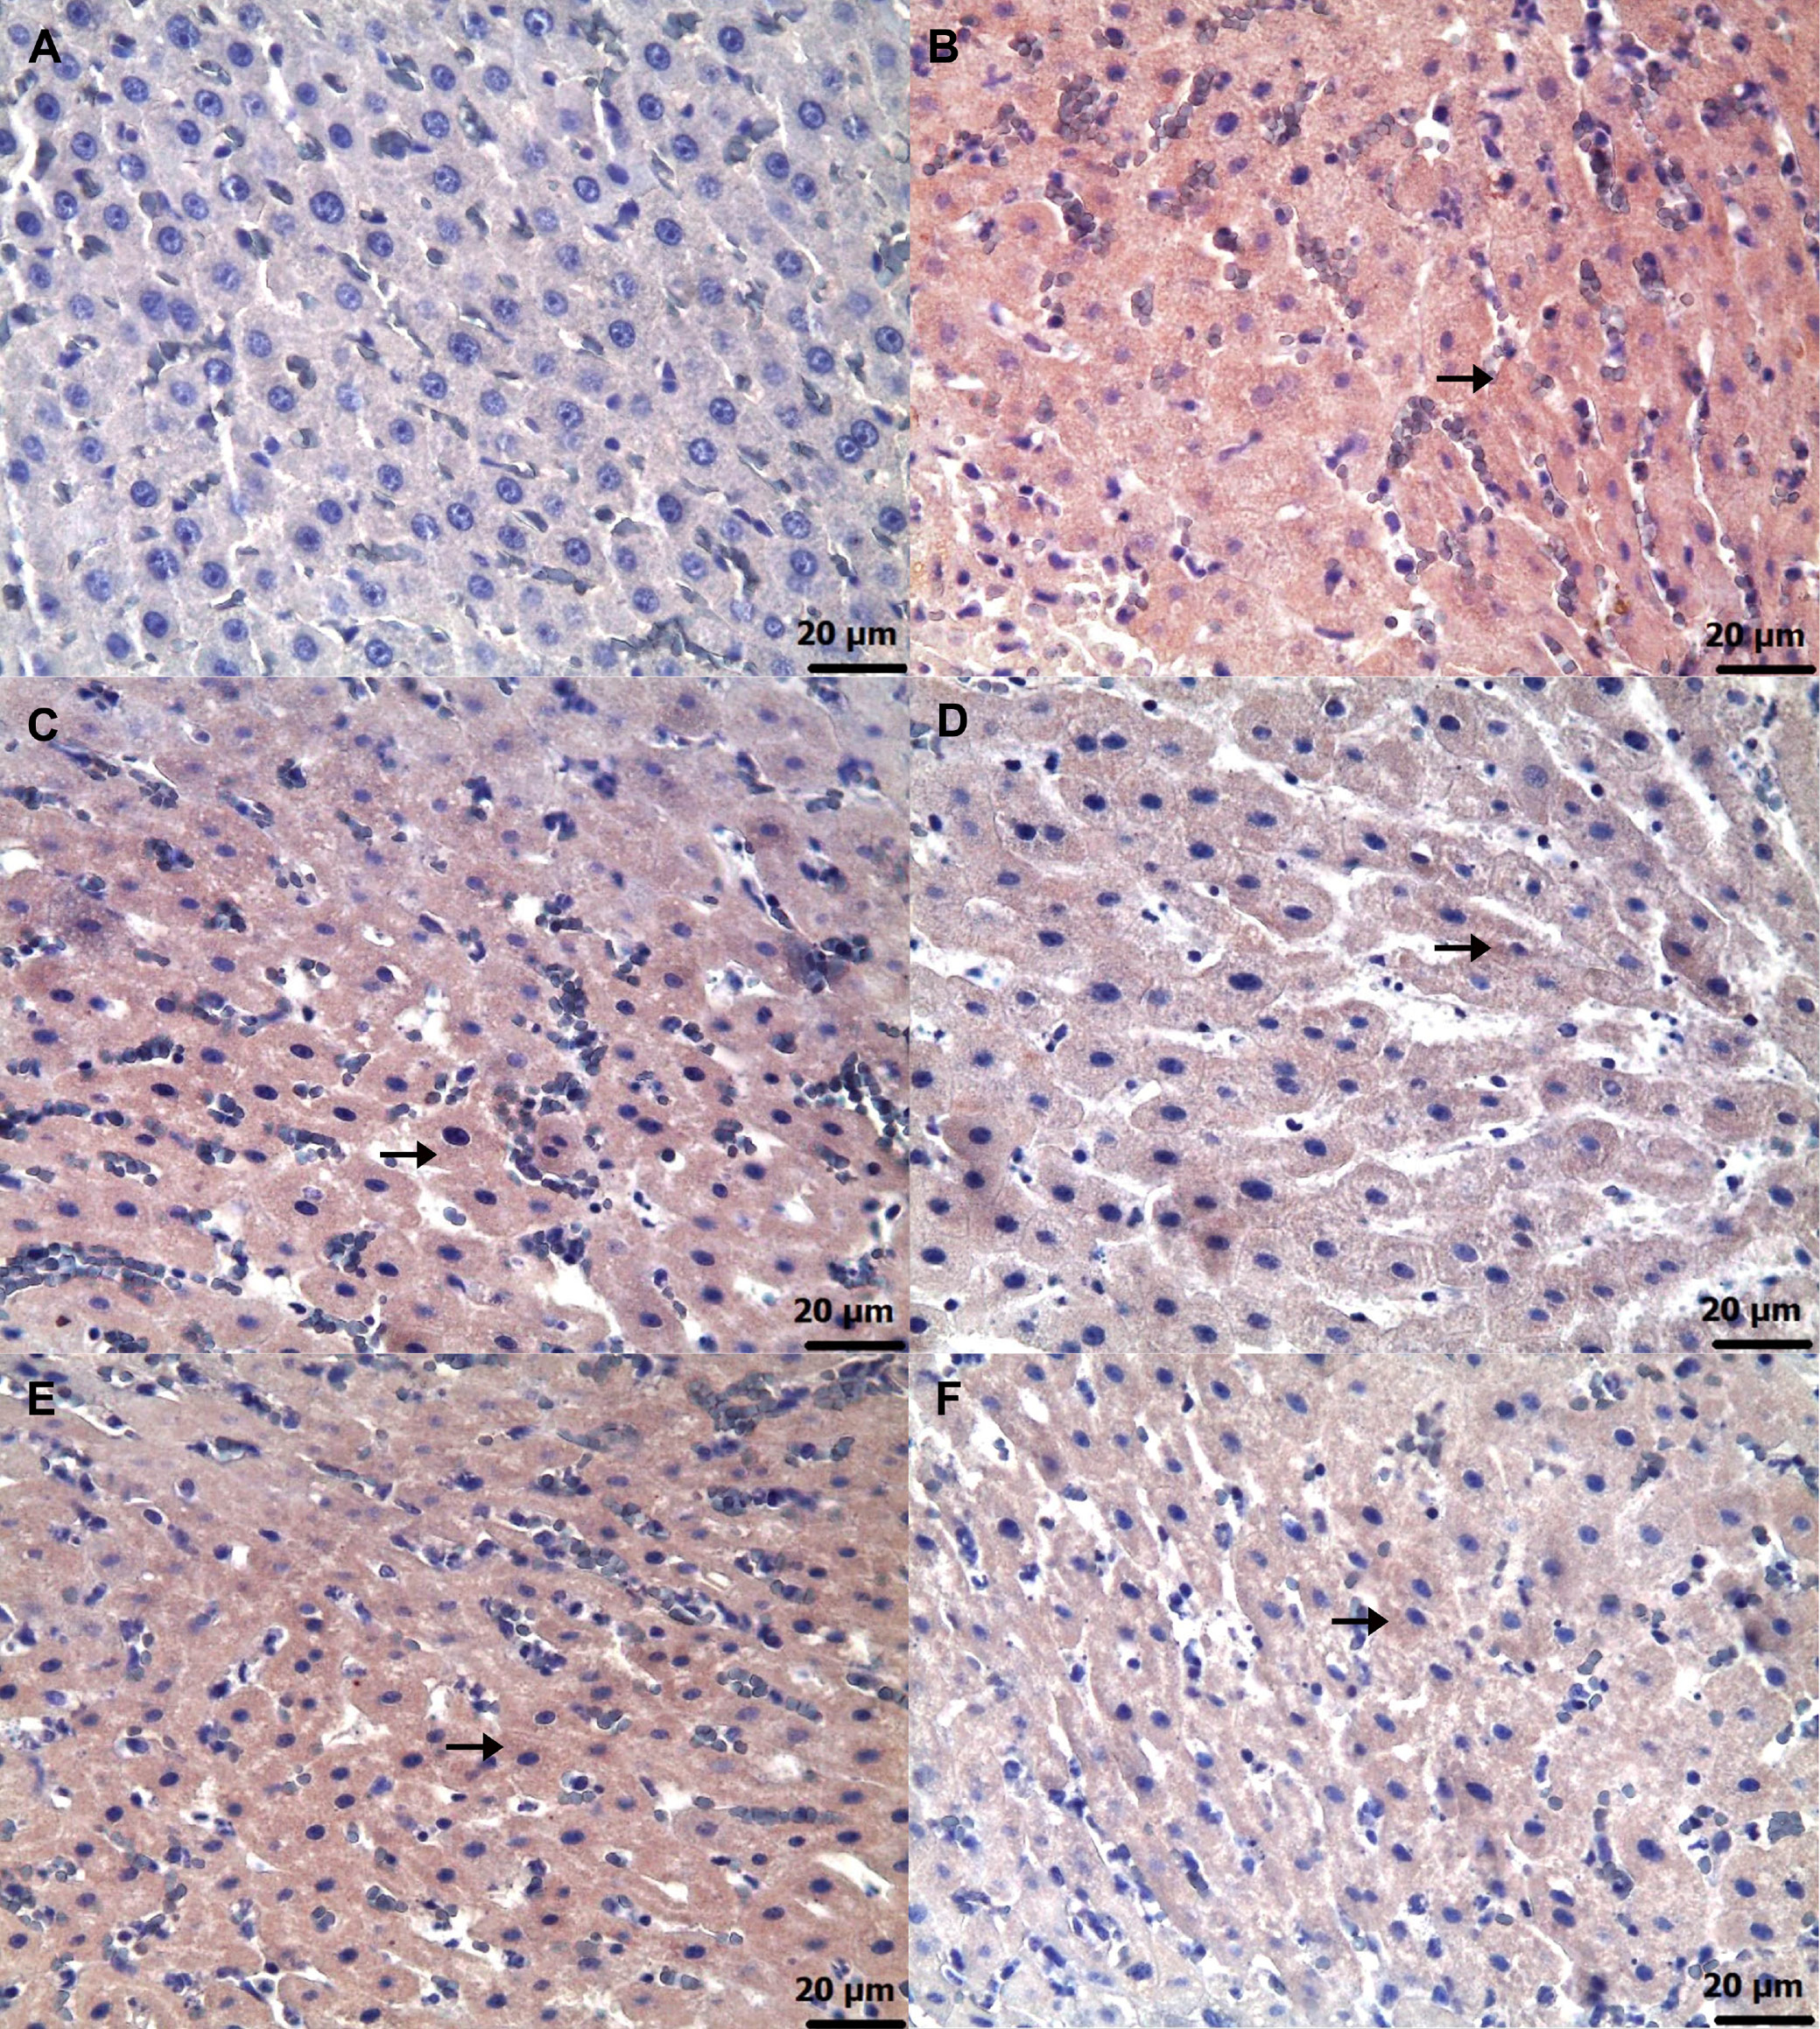
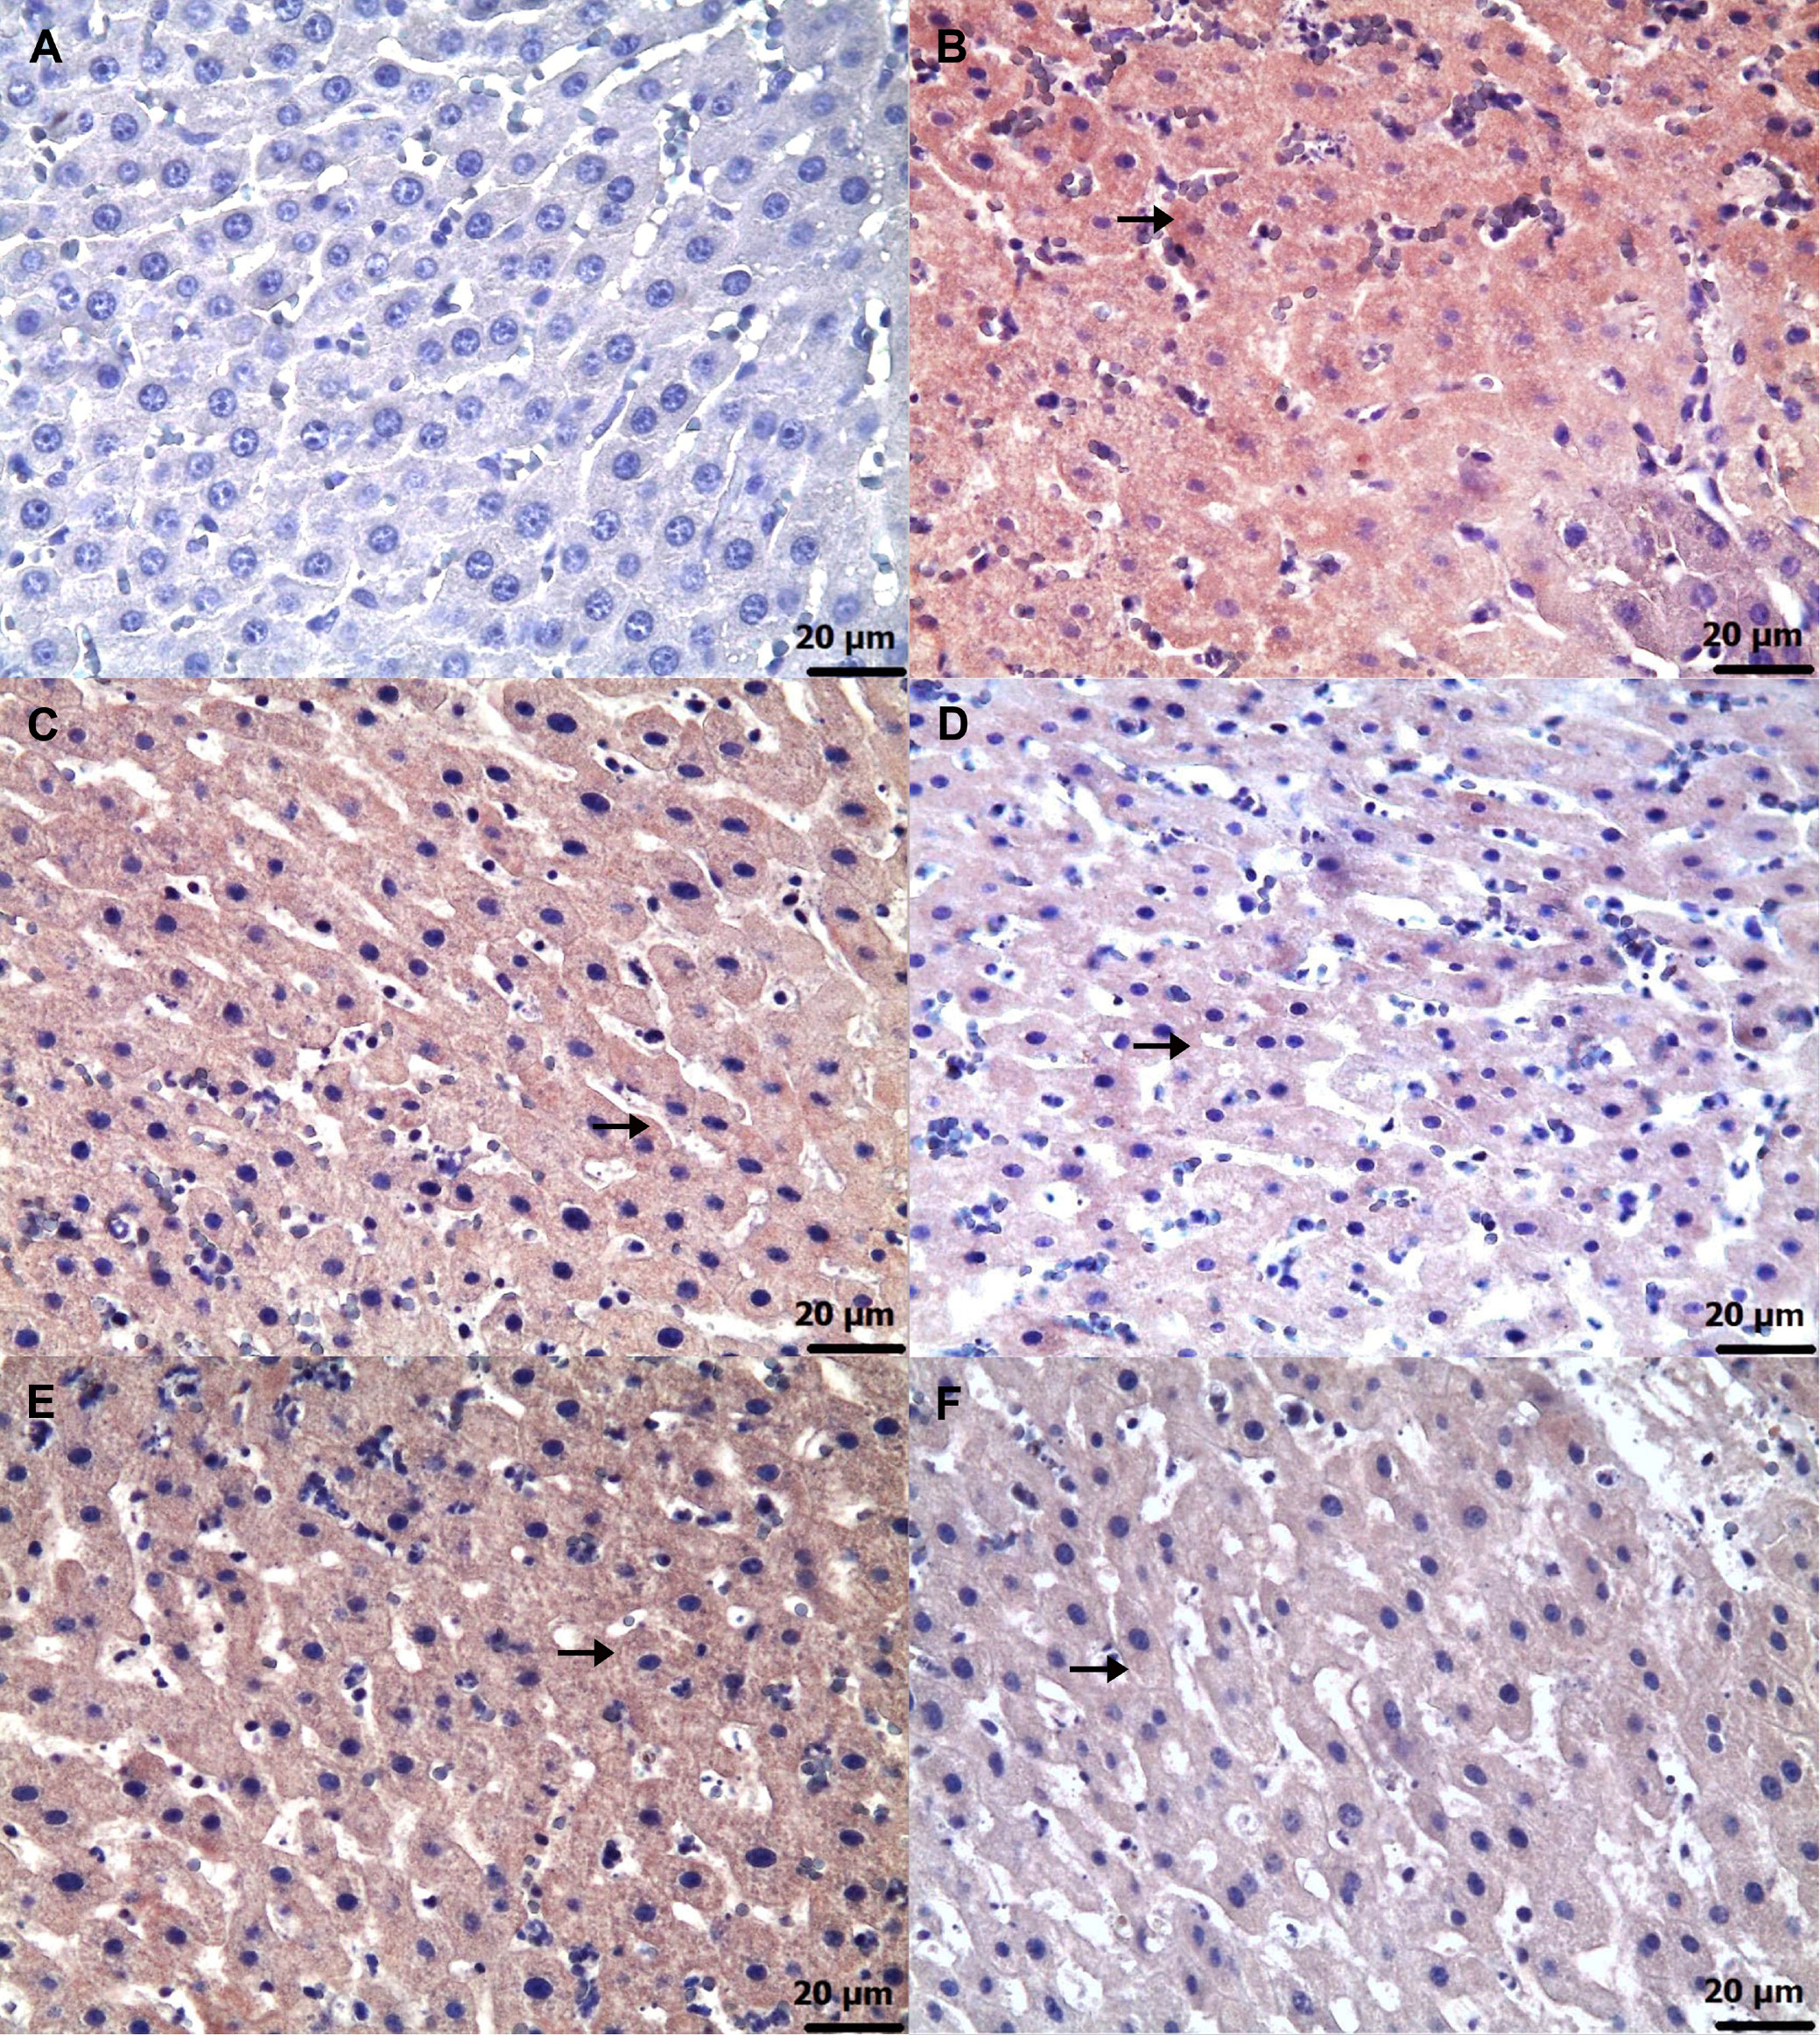
Immunohistochemical examinations for caspase-3 (Figure 6) and TNF-α (Figure 7) revealed statistically significant differences between the groups (Table 5, Table 6; p < 0.05). No significant caspase-3 and TNF-α immunopositivity was found in the HG group. Among the treatment groups, strong caspase-3 and TNF-α immunopositivity was observed in the ADG group, moderate immunopositivity in the AAG-2 and RAG groups, and mild immunopositivity in the AAG-5 and RAA-2 groups.
Discussion
This study investigates the protective effects of ATP, resveratrol and their combination (ARCs) against amiodarone-induced liver injury and dysfunction in rats, using biochemical, histopathological and immunohistochemical approaches. Previous studies have reported a decrease in ATP content in parallel with the increase in mitochondrial ROS associated with amiodarone.9 Furthermore, it has been emphasized that amiodarone causes a significant decrease in cellular ATP and cell viability.10 The results of our biochemical analyses revealed that amiodarone treatment led to an increase in MDA, tGSH, SOD, and CAT levels in liver tissue. It is well established that MDA is a byproduct of the oxidation of polyunsaturated fatty acids, including arachidonic acid.22 In simpler terms, MDA serves as a marker of LPO and is widely used as a reliable indicator of oxidative damage severity.23 Literature data and our experimental results suggest that amiodarone treatment increases ROS production and induces LPO reaction in liver tissue. Previous studies have indicated that amiodarone-induced toxicity is primarily driven by the generation of ROS, leading to oxidative stress and LPO.8
As previously stated, amiodarone has been linked to toxic effects in various organs and tissues, including the liver.6, 7 Furthermore, long-term use of amiodarone may result in life-threatening side effects.5 However, Jiang et al. reported that acute liver injury can occur due to parenteral administration of amiodarone and that antioxidant treatment was effective in relieving the hepatotoxicity.24 Akbay et al. reported a decrease in glutathione (GSH), a key endogenous antioxidant, in cases of amiodarone-induced hepatotoxicity, and demonstrated that antioxidant supplementation alleviated the resulting liver injury.25 Amiodarone hepatotoxicity has been assessed using tGSH, an endogenous antioxidant composed of 3 amino acids.26 Furthermore, GSH serves as a key marker of cellular redox status in various diseases and cell death processes, and plays a critical role in regulating numerous cellular functions.27 Similar to the findings of the literature, our study showed a significant reduction in the amount of tGSH in the liver tissue of amiodarone-treated animals.
In liver tissue treated with amiodarone, the enzymatic defense systems, including SOD and CAT, showed a decrease in their antioxidant activity. Superoxide dismutase enzymes are recognized as the first line of defense against ROS, catalyzing the dismutation of superoxide radicals into oxygen and hydrogen peroxide.28 Superoxide dismutase catalyzes the transformation of the superoxide anion free radical (O2•−) to hydrogen peroxide (H2O2) and molecular oxygen (O2). Subsequently, CAT enzyme reduces H2O2 to water.29 Therefore, SOD is used in various pathologies to neutralize ROSs. Some studies have reported that amiodarone may exhibit gastroprotective effects by mitigating the reduction of SOD activity and limiting the increase of CAT activity under certain conditions.30 However, it has also been reported that amiodarone decreases SOD and CAT activities in the optic nerve, leading to optic neuropathy.31
In this study, we found that the group administered amiodarone alone had significantly higher levels of ALT and AST in their blood serum compared to the HG group. It is important to note that in healthy individuals, the circulating levels of liver enzymes are primarily due to cytoplasmic leakage.32 While ALT is typically found in the hepatocyte cytoplasm, AST is present in both the hepatocyte cytoplasm and mitochondria.33, 34 The literature and our experimental results suggest that the amiodarone group experienced damage to both hepatocyte cytoplasm and mitochondria. These findings are consistent with the results of the study by Nagata et al. on amiodarone-induced hepatotoxicity.35 Felser et al. reported that amiodarone induced toxic effects, including a reduction in intracellular ATP levels, accumulation of ROS in hepatocyte mitochondria, and inhibition of mitochondrial function.13 Furthermore, it has been demonstrated that the amiodarone-associated increase in mitochondrial H2O2 production correlates with a reduction in ATP levels.36
As previously stated, amiodarone has been shown to increase ROS production in hepatocyte mitochondria, leading to a significant decrease in ATP content and cell viability.9, 10 The literature suggests that ATP may be a potential treatment for hepatotoxicity induced by amiodarone. The experimental results show that ATP at a dose of 5 mg/kg was more effective in inhibiting the amiodarone-induced rise in MDA and reduction in tGSH, SOD and CAT, in liver tissue compared to 2 mg/kg. No studies investigating the effect of ATP on amiodarone-induced liver damage were found in the literature. However, literature reports indicate that ATP may protect rat liver tissue from acetaminophen-induced damage by preventing an increase in oxidants and a decrease in antioxidants.37
Drug-induced hepatotoxicity is commonly caused by mitochondrial damage and dysfunction, which can lead to hepatocellular damage. As a result, ALT and AST levels are used to determine the extent of hepatocellular damage.38 In accordance with the literature, our biochemical results revealed that ATP inhibited the amiodarone-induced increase in serum ALT and AST levels in rats. Previous studies have indicated that elevated serum ALT and AST levels in liver injury are associated with decreased hepatocellular ATP content.39 Koç et al.37 reported that ATP administration prevented the elevation of serum ALT and AST levels in rats treated with paracetamol. They also found that ATP protected the normal structure of the liver from paracetamol-induced damage.
The literature suggests that not only exogenous ATP but also drugs that increase intracellular ATP production may be beneficial in the treatment of amiodarone-induced hepatotoxicity. In our study, we investigated the effect of resveratrol on amiodarone-induced hepatotoxicity. Resveratrol is a well-known antioxidant that has been shown to exert beneficial effects on various organs and tissues.16 It has also been shown to be an enhancer of intracellular ATP production.17 Consistent with previous studies, our experimental results demonstrate that resveratrol significantly attenuated amiodarone-induced increases in oxidative stress markers, as well as serum ALT and AST levels. No information investigating the effect of resveratrol on amiodarone-induced hepatotoxicity was found in recent studies. However, it has been reported that resveratrol prevents vancomycin-induced increases in oxidative stress and reductions in antioxidant levels in liver tissue, as well as elevations in serum ALT and AST levels.40
In this study, the biochemical findings in amiodarone, ATP, resveratrol, ARCs, and the healthy rat group were consistent with the histopathologic findings. In the amiodarone-only group, characterized by elevated oxidant, ALT, and AST levels and reduced antioxidant levels, liver tissue showed severely dilated and congested blood vessels, irregular hepatocytes with lipid-filled vacuoles and necrosis, as well as widespread infiltration of PMNLs. However, the histopathological damage caused by amiodarone was evaluated as grade 2 in the 2 mg/kg ATP group (AAG-2), grade 1 in the 5 mg/kg ATP group (AAG-5), grade 2 in the resveratrol group (RAG), and grade 1 in the 2 mg/kg ATP + resveratrol group (RAA-2). Previous studies have reported the presence of lipid droplets of different sizes in patients treated with amiodarone,35 supporting our histopathological findings. Furthermore, elevated oxidant levels have been reported to induce hepatocyte apoptosis and/or necrosis.13 In addition to hepatocyte necrosis, liver tissue has been reported to show signs of lymphocytic cell infiltration, hepatocyte enlargement, vacuolization, and nuclear hypertrophy.35
Furthermore, the biochemical and histopathological findings observed in the amiodarone, ATP, resveratrol, ARC, and healthy rat groups were consistent with the corresponding immunohistochemical results. Grade 3 level caspase-3 and TNF-α immunopositivity was detected in the liver of the group receiving amiodarone alone. It was observed that this caspase-3 and TNF-α immunopositivity was alleviated to grade 2 in the 2 mg/kg ATP and resveratrol groups, and to grade 1 in the 5 mg/kg ATP and 2 mg/kg ATP + resveratrol groups. A recent study reported that amiodarone induces apoptosis by causing caspase-3 activation in liver cells.41 These literature data support our immunohistochemical caspase-3 findings. Amiodarone decreases intracellular ATP and Ca2 + in hepatocytes, causing endoplasmic reticulum stress and lipid accumulation.42 The toxic effects of amiodarone on the liver consist of mitochondrial toxicity, apoptosis and necrosis. Mitochondrial damage leads to activation of caspase-9, and binding of death receptors activates caspase-8. Activation of both caspase-9 and caspase-8 leads to propagation of the cascade of downstream effector caspases, including caspase-3. In conclusion, amiodarone induces apoptosis in hepatocytes by activating the mitochondrial apoptotic pathway, involving caspase-2, -3 and -9.42, 43 It has been previously demonstrated that amiodarone causes immune dysregulation in liver tissue, which leads to an increase in the proportion of Th17 and Th1 cells and causes a significant increase in inflammatory factors such as TNF-α.44 In hepatocytes, mitochondria play a central role in linking caspase-8 activation to caspase-9, ultimately leading to the activation of effector caspases such as caspase-3 and caspase-7. Loss of mitochondrial membrane potential, generation of ROS, formation of the mitochondrial permeability transition pore and release of cytochrome C are critical for TNF-α-induced hepatocyte apoptosis.45
Limitations
The effectiveness of the combination of 5 mg/kg ATP and resveratrol against amiodarone-induced hepatotoxicity was not assessed in this study. Future research should investigate this combination to determine whether it offers enhanced protective effects compared to individual or lower-dose treatments.
Conclusions
Biochemical, histopathological and immunohistochemical evidence demonstrates that amiodarone causes severe oxidative damage to liver tissue of rats. Damage severity was graded as follows: grade 2 in the 2 mg/kg ATP + amiodarone group (AAG-2), grade 1 in the 5 mg/kg ATP + amiodarone group (AAG-5), grade 2 in the resveratrol + amiodarone group (RAG) and grade 1 in the 2 mg/kg ATP + resveratrol + amiodarone group (RAA-2). The experimental results indicate that adjusting the ATP dose or using the combination of ATP and resveratrol is necessary to minimize amiodarone-induced liver damage.
Supplementary data
The supplementary materials are available at https://doi.org/10.5281/zenodo.14881625. The package includes the following files:
Supplementary Table 1. Assumption of normality for biochemical variables assessed with Shapiro–Wilk test.
Supplementary Table 2. The assumption of homogeneity of variance was assessed for the MDA, tGSH, SOD, CAT, ALT, and AST values.
Data availability
The datasets generated and/or analyzed during the current study are available from the corresponding author on reasonable request.
Consent for publication
Not applicable.
Use of AI and AI-assisted technologies
Not applicable.