Abstract
Background. The chronic progression of viral hepatitis and the terminal stage of cirrhosis impose a long-term disease burden on patients. The assessment of liver damage can be facilitated through the measurement of liver biomarkers.
Objectives. To conduct a comprehensive analysis of the relationship between hepatitis B virus (HBV), hepatitis C virus (HCV), liver biomarkers, and cirrhosis via Mendelian randomization (MR).
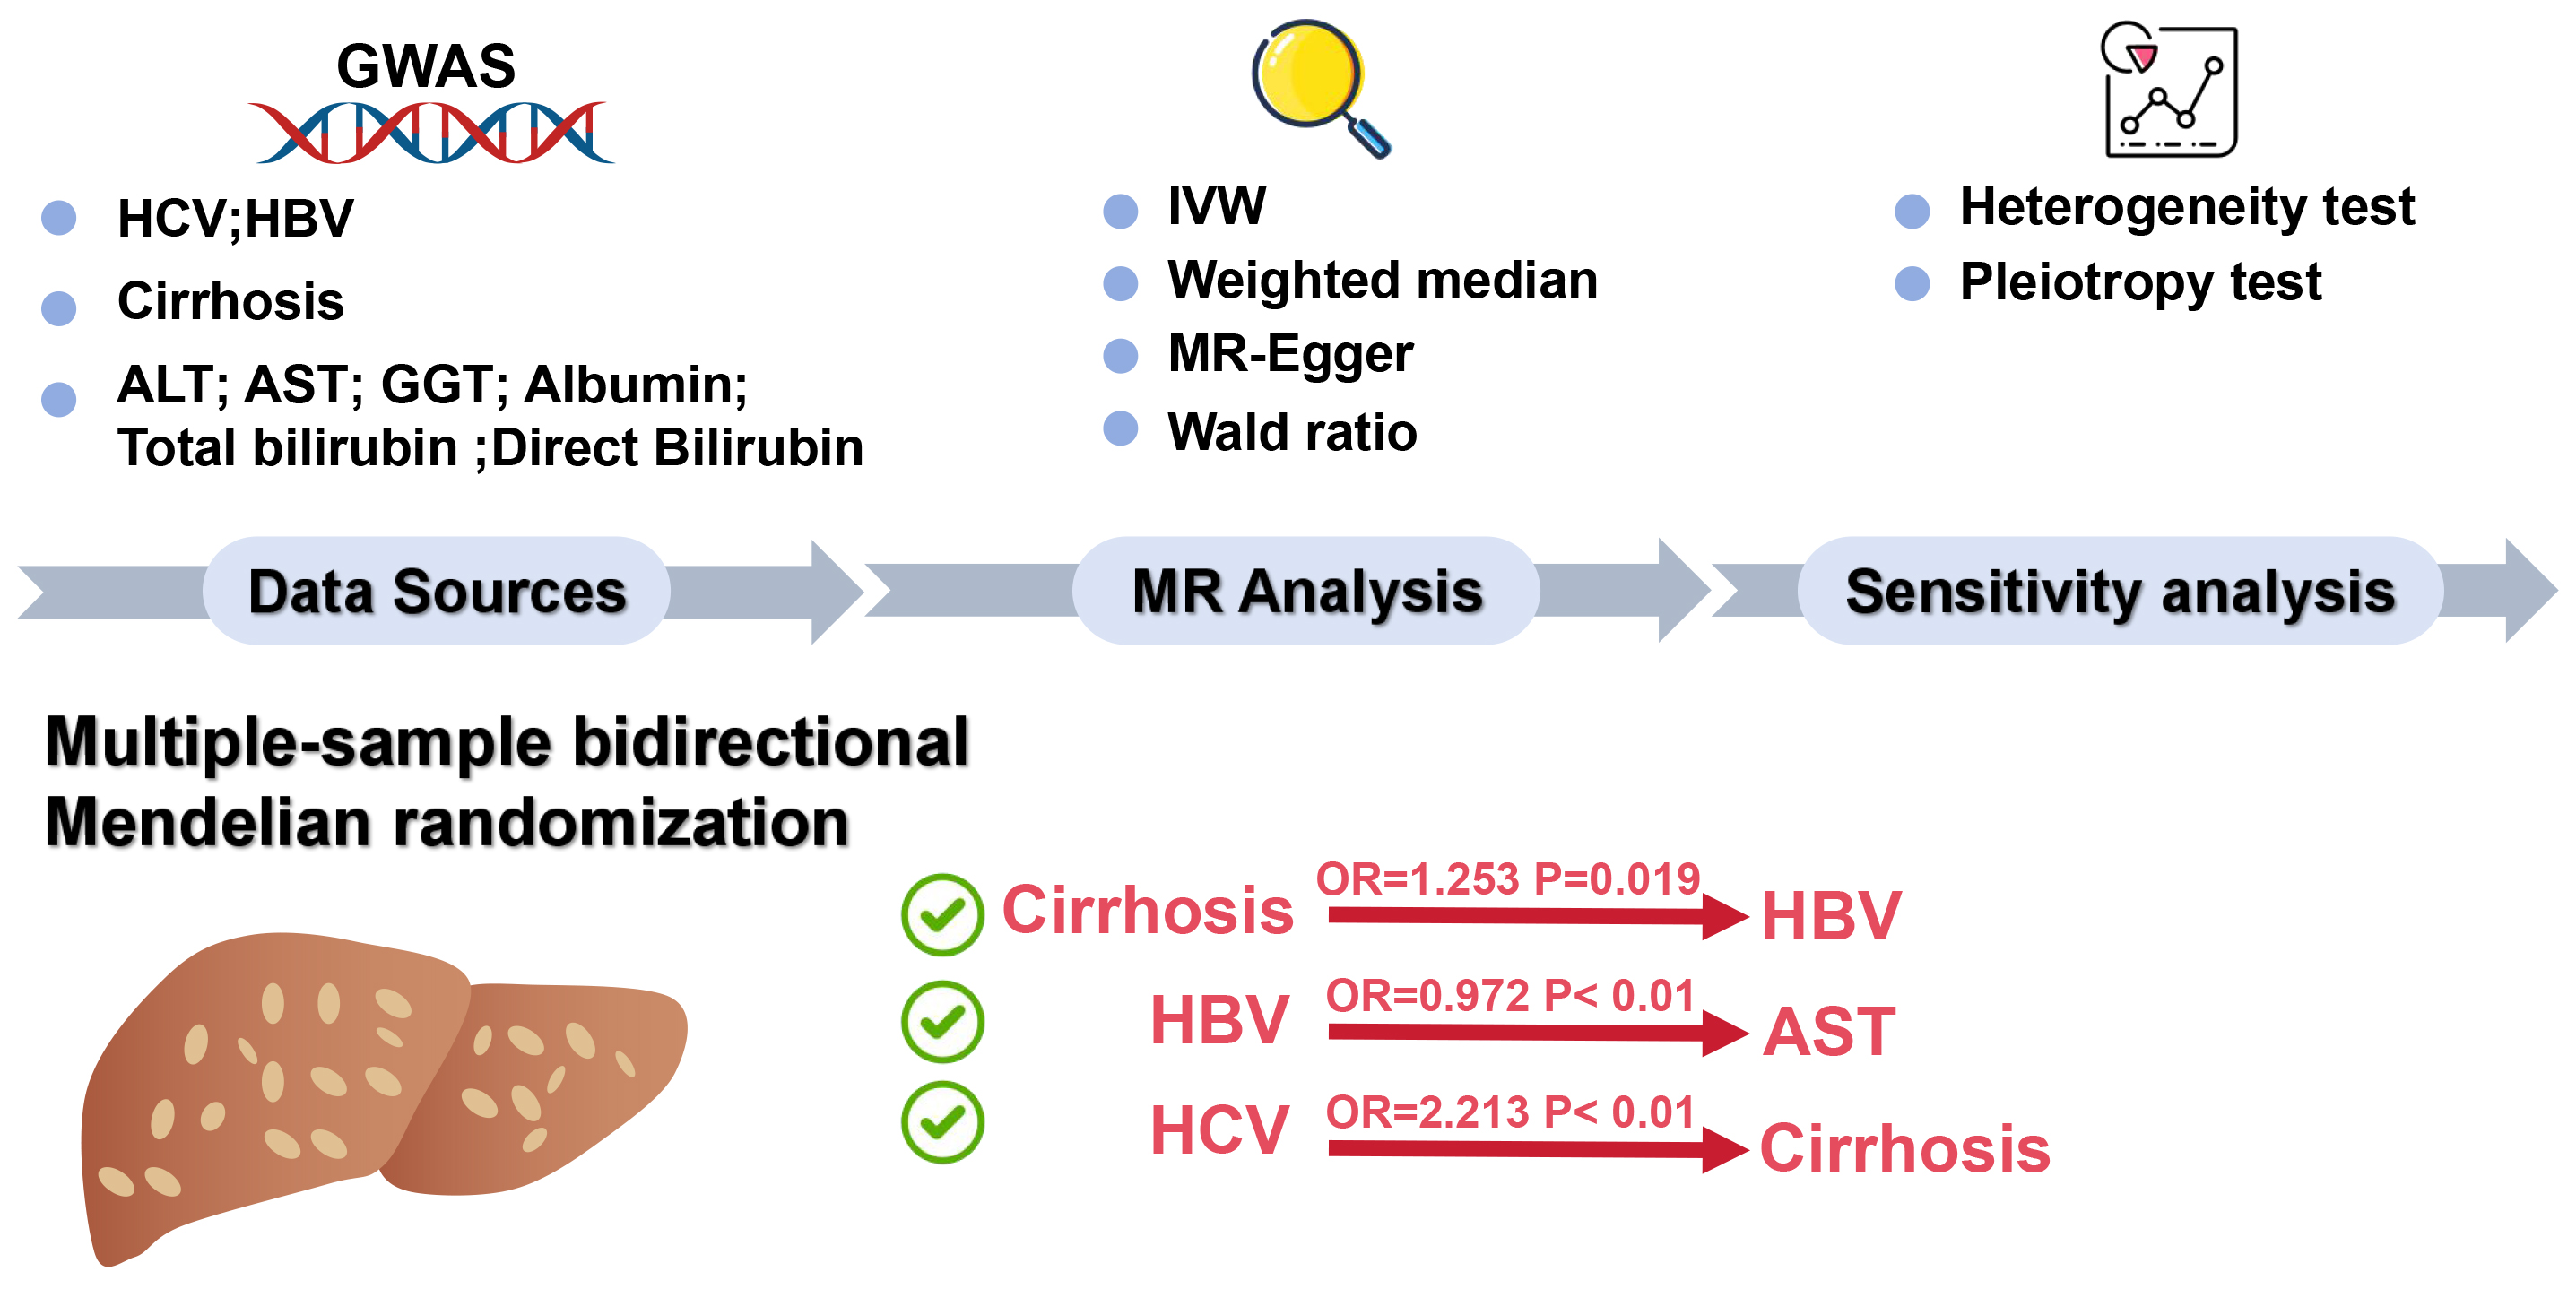
Materials and methods. A bidirectional multi-sample MR approach was used to extract data from publicly available genome-wide association studies (GWAS) databases. Information on liver biomarkers and cirrhosis, along with data from 351,885 HBV samples containing 19,079,722 single nucleotide polymorphisms (SNPs) and 176,698 HCV samples comprising 12,454,320 SNPs, were aggregated. The TwoSampleMR 0.5.7 package in R language facilitated the bidirectional MR analysis, utilizing methods such as inverse-variance weighting, weighted median and MR-Egger to investigate the causal relationships between HBV, HCV, liver biomarkers, and cirrhosis.
Results. The MR analysis revealed potential causal relationships between cirrhosis and HBV infection, indicating an increased probability of HBV as cirrhosis escalates (odds ratio (OR) = 1.253; 95% confidence interval (95% CI): 1.037–1.514; p = 0.019). Additionally, a potential causal link was observed between HBV and the level of aspartate aminotransferase (AST), with an increase in HBV leading to a gradual decrease in AST levels (OR = 0.972; 95% CI: 0.958–0.986; p < 0.01). A similar causal relationship was identified between HCV infection and cirrhosis, where the probability of cirrhosis significantly increases with rising HCV levels (OR = 2.213; 95% CI: 1.752–2.796; p < 0.01). The results demonstrated no pleiotropy or heterogeneity within the analysis.
Conclusions. This research highlights a causal relationship between HBV and AST levels, suggesting that monitoring AST levels can indicate the extent of liver damage caused by chronic HBV infection. Additionally, causal connections were established between HBV, HCV and cirrhosis, emphasizing that cirrhosis represents the terminal stage of chronic HBV and HCV infections. By managing the progression of the disease, the risk of cirrhosis can be reduced.
Key words: Mendelian randomization, cirrhosis, viral hepatitis, liver biomarkers, causal relationships
Background
Viral hepatitis, encompassing hepatitis B (HBV), hepatitis C (HCV) and hepatitis A, among others, represents a spectrum of diseases characterized by chronic inflammation of the liver. Globally, HBV and HCV infections are the predominant causes of chronic liver disease, with an estimated combined carrier population exceeding 350 million individuals.1, 2 As of 2019, an estimated 295.9 million people were living with chronic HBV infection, and HCV is responsible for an estimated 57.8 million chronic infections worldwide.3 The progression of these infections often results in liver fibrosis, cirrhosis, and ultimately liver failure or hepatocellular carcinoma (HCC), posing significant health and economic burdens. Early diagnosis remains challenging, and treatment options are often costly and limited in efficacy, particularly in low- and middle-income regions.4, 5 As such, understanding the mechanisms driving HBV and HCV progression is critical for developing more effective prevention and treatment strategies.
In the diagnosis and monitoring of hepatitis, the levels of liver biomarkers undergo substantial changes, including but not limited to aspartate aminotransferase (AST), alanine aminotransferase (ALT), alkaline phosphatase (ALP), gamma-glutamyl transferase (GGT), and total bilirubin. These markers provide critical insights into the degree of liver inflammation, extent of damage and liver function recovery, serving as key indicators for assessing liver function and disease progression. For instance, AST and ALT are sensitive indicators for detecting early stages of liver cell damage.6 As the condition progresses, elevated levels of ALP and GGT may indicate damage to the bile system, while an increase in bilirubin levels reflects compromised liver capacity to clear aged red blood cells. Although the role of liver biomarkers in monitoring liver health is widely recognized, their precise causal relationships with HBV and HCV remain to be fully elucidated. A systematic study of liver biomarkers in the progression of cirrhosis in patients with HBV and HCV is crucial for understanding the disease’s development mechanisms, improving early diagnosis and monitoring, and evaluating treatment efficacy.
In recent years, several epidemiological studies have explored the genetic and environmental determinants of HBV and HCV susceptibility, progression and treatment outcomes. Notably, genome-wide association studies (GWAS) have identified numerous genetic variants associated with the risk of chronic viral hepatitis.7, 8 However, the causal relationships between these genetic factors and disease outcomes remain largely unclear. Mendelian randomization (MR) offers a powerful tool to address this gap by using genetic variants as instrumental variables to infer causal relationships between exposures and outcomes.9 The MR method is grounded in 3 core assumptions: 1) The genetic variant must be associated with the exposure of interest; 2) The genetic variant should not be associated with confounders; and 3) The genetic variant influences the outcome only through the exposure. By leveraging these assumptions, MR provides an approach that is less prone to confounding and reverse causation compared to traditional observational studies.10, 11 Mendelian randomization provides a unique perspective by integrating large-scale cohort genetic and phenotypic data, using genetic variation as an instrumental variable to elucidate the causal links between HBV, HCV, liver biomarkers, and cirrhosis. By reducing the interference of confounding factors, this method allows for a clearer understanding of the complex interactions between genetic variations, viral infections and liver diseases, offering new insights and strategies for disease prevention and treatment.12, 13 For viral hepatitis, MR studies have mainly focused on genetic predispositions to HBV and HCV infection risks rather than exploring the progression to severe outcomes like cirrhosis.14, 15 By leveraging genetic instruments associated with liver biomarkers and disease phenotypes, MR provides a unique opportunity to investigate whether changes in these biomarkers causally impact the progression from viral hepatitis to liver cirrhosis.
Objectives
This study aims to apply a multi-sample bidirectional MR approach to assess causal relationships between HBV, HCV, liver biomarkers, and cirrhosis, providing novel insights into the genetic and phenotypic interactions underlying liver disease progression. Unlike previous MR studies that often focus on single biomarkers or outcomes, our approach integrates multiple biomarkers and examines bidirectional causality, allowing for a more comprehensive understanding of the complex pathways involved. By combining data from extensive GWAS and employing robust statistical methods such as inverse-variance weighting (IVW), weighted median and MR-Egger regression, this research seeks to enhance the accuracy and reliability of causal inferences.
Materials and methods
Study design
This study implements a bidirectional multi-sample MR design to investigate the causal relationships between the exposure (HBV, HCV and liver biomarkers, including ALT, AST, GGT, albumin, total bilirubin, and direct bilirubin) and outcomes (cirrhosis). This approach allows for the assessment of whether the exposure has a causal effect on the outcome and vice versa. In this method, 2 independent GWAS datasets were used: 1 for the exposure and 1 for the outcome. The MR analysis was conducted separately for each direction to infer the causal relationship, following the principles of IVW regression, which combines genetic variant-specific estimates into an overall causal estimate. The MR approach is predicated on 3 core assumptions: 1) The chosen genetic variants are strongly associated with the exposure; 2) The genetic variants are independent of any confounding factors that could influence the risk of HBV and HCV; 3) The genetic variants influence the risk of HBV and HCV exclusively through exposure, without any alternative pathways.
Inclusion and exclusion criteria for GWAS data
The GWAS datasets included in this study were selected based on strict inclusion and exclusion criteria to ensure the representativeness and relevance of the data. Only GWAS with large sample sizes, well-documented methods and European ancestry populations were included to minimize population stratification and enhance comparability between datasets. Specifically, studies with sample sizes exceeding 10,000 participants were prioritized to ensure statistical power.
Data were excluded if they had high levels of missingness (>10%) or low-quality control metrics, such as single nucleotide polymorphisms (SNPs) with call rates below 95%, minor allele frequencies below 1% or failure to meet Hardy–Weinberg equilibrium (p < 1 × 10⁶). In addition, datasets with limited phenotypic information or lacking detailed population descriptors were excluded to avoid introducing biases related to unmeasured confounders.
Sources and GWAS samples
The data for this study were sourced from publicly accessible GWAS databases, primarily the GWAS Catalog (https://gwas.mrcieu.ac.uk/). The selection focused on information related to liver biomarkers (ALT, AST, GGT, albumin, total bilirubin, and direct bilirubin) and cirrhosis, as well as samples from patients with HBV and HCV infections. Sample information is provided in Supplementary Table 1. The data utilized in this research are publicly available and have previously received ethical approval and informed consent within their original studies.
In this research, the samples for chronic HCV infection included 176,698 cases, covering 12,454,320 SNPs; for chronic HCV infection, there were 351,885 cases, covering 19,079,722 SNPs. Cirrhosis samples numbered 178,726, spanning 12,454,705 SNPs; ALT samples included 437,724 cases involving 4,231,965 SNPs.
Aspartate aminotransferase samples numbered 436,275, totaling 4,231,525 SNPs; GGT samples encompassed 437,651 cases, totaling 4,231,983 SNPs. Albumin samples included 357,968 cases containing 10,783,656 SNPs. Total bilirubin samples covered 342,829 cases, encompassing 19,046,135 SNPs; direct bilirubin samples included 372,420 cases, containing 4,206,076 SNPs.
Data quality control and cleaning process
To ensure the reliability of the results, we implemented a rigorous data cleaning and quality control process. First, missing data were handled using multiple imputations by chained equations (MICE), pooling results across imputed datasets to address uncertainty. Variables with over 10% missing data were excluded. Outliers were identified and removed using z-score analysis. To control for population stratification, principal component analysis (PCA) was used without rotation, selecting components to explain at least 95% of the variance and removing outliers exceeding ±3 standard deviations (SDs) on key components. Genetic variants were filtered based on stringent criteria: call rates above 95%, minor allele frequencies of at least 1% and Hardy–Weinberg equilibrium at p > 1 × 10⁻⁶. Finally, duplicate records were removed, inconsistencies resolved through cross-validation and logical checks, and continuous variables were normalized as necessary. These steps minimized bias and enhanced the robustness of our findings.
Analysis method
The selection of instrumental variables (IV) is based on genetic variants associated with cirrhosis and liver biomarkers. The filtering criterion for these variables is set at a p-value of less than 5e-08. Should no instrumental variables meet this threshold, the threshold is adjusted down to a minimum of 5e-6.16, 17 These variants are derived from multiple studies targeting specific populations, with strict linkage disequilibrium (LD) filtering applied to ensure the independence of variants, using an LD threshold of r2 < 0.001.18, 19 The MR analysis is conducted using the TwoSampleMR 0.5.7 package in R language (R Foundation for Statistical Computing, Vienna, Austria), assessing the causal relationship between cirrhosis and liver biomarkers with HBV and HCV. The analysis employs methods such as IVW, weighted median and MR-Egger, integrating various statistical models to enhance the reliability and accuracy of the results. Sensitivity analyses are conducted to assess the robustness of the results. In cases where sensitivity analyses indicate pleiotropy, the MR-PRESSO test is used to investigate horizontal gene pleiotropy, excluding outliers for reanalysis. If pleiotropy persists, such analysis is excluded.
Sensitivity analyses
We also conducted sensitivity analyses, including MR–Egger regression and the weighted median method, to account for potential pleiotropy and assess the robustness of the causal estimates. These techniques helped ensure that the results were not driven by invalid instrumental variables that might affect the outcome through pathways other than the exposure of interest. The bidirectional nature of this analysis provides a comprehensive understanding of the potential feedback loop between genetic variants and liver disease progression.
Statistical analyses
Statistical significance of study results was determined using a combination of criteria. A result was considered statistically significant if the p-value from methods such as IVW, weighted median or MR-Egger regression was less than 0.05. Additionally, positive results required beta-directional consistency across these methods, ensuring that the effect directions observed were consistent. This dual criterion of p-value threshold and beta-directional consistency helped establish the robustness of the causal inferences.20 A Q_pval > 0.05 indicated no significant heterogeneity among the included studies. In such cases, both fixed-effects and random-effects IVW models are appropriate. Conversely, when heterogeneity is present (Q_pval < 0.05), either the IVW random-effects model or the weighted median method should be applied.21 A p > 0.05 in the multivariate test means no multivariate effects. The instrumental variables used in each analysis are summarized, and the last column shows the F-value of the instrumental variable, which is usually considered a strong instrumental variable if F ≥ 10.
Results
Causal analysis of SNPs related to HBV and HCV
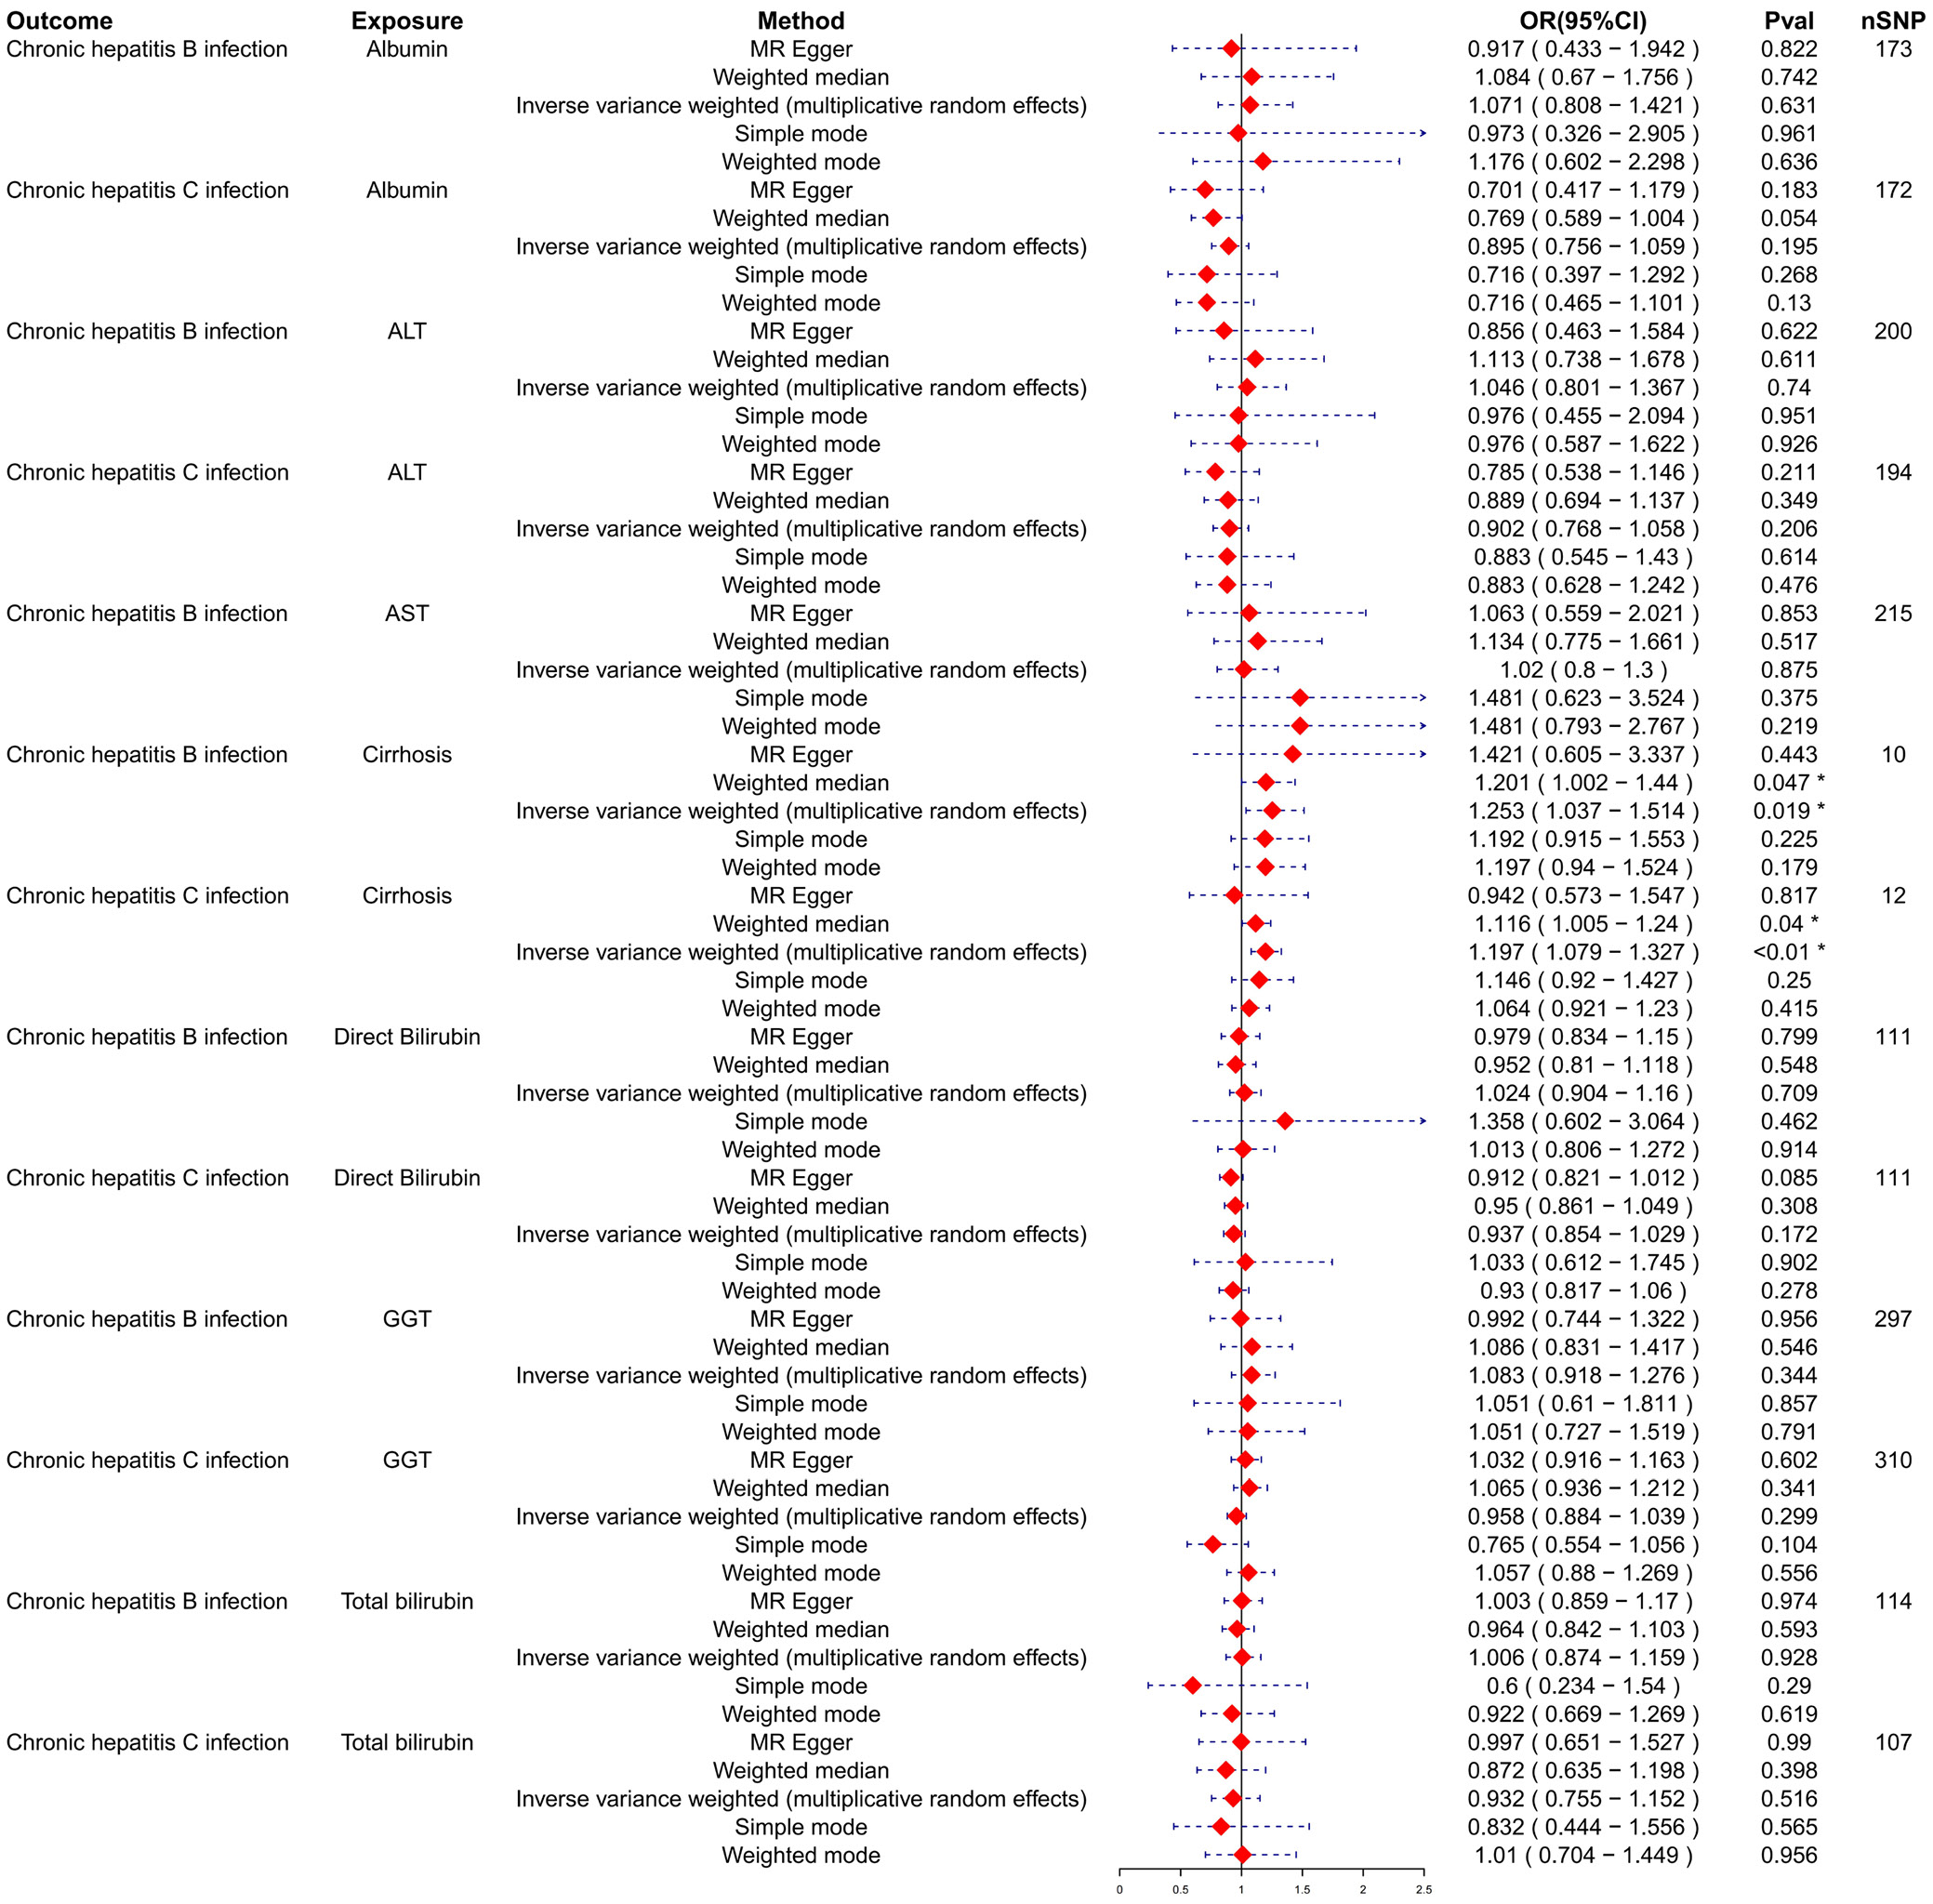
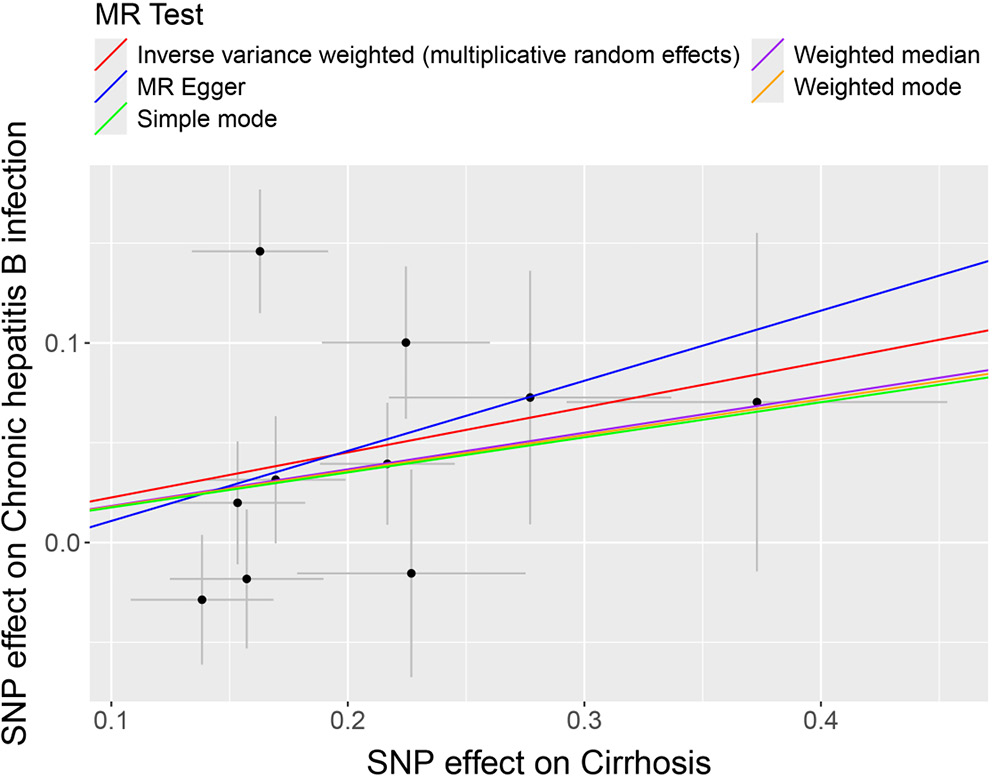
To assess the potential causal effects of cirrhosis and liver biomarkers on HBV and HCV infections, a multi-sample MR analysis was initially conducted, treating cirrhosis and liver biomarkers as the exposures and HBV and HCV infections as the outcomes. Variants demonstrating pleiotropic effects were meticulously identified and subsequently excluded to ensure the integrity and accuracy of the causal inference. The analysis using the IVW model depicted in forest plots indicated a potential causal effect of cirrhosis on HBV infection (odds ratio (OR) = 1.253; 95% confidence interval (95% CI): 1.037–1.514; p = 0.019; Figure 1). Further analysis and visualization suggested that the trends from the IVW, MR-Egger and weighted median methods were consistent and positively correlated, with an OR greater than 1, suggesting that cirrhosis acts as a potential risk factor for HBV infection (Figure 2). As the level of cirrhosis increases, so does the probability of HBV infection.
Causal analysis of SNPs related to cirrhosis and liver biomarkers
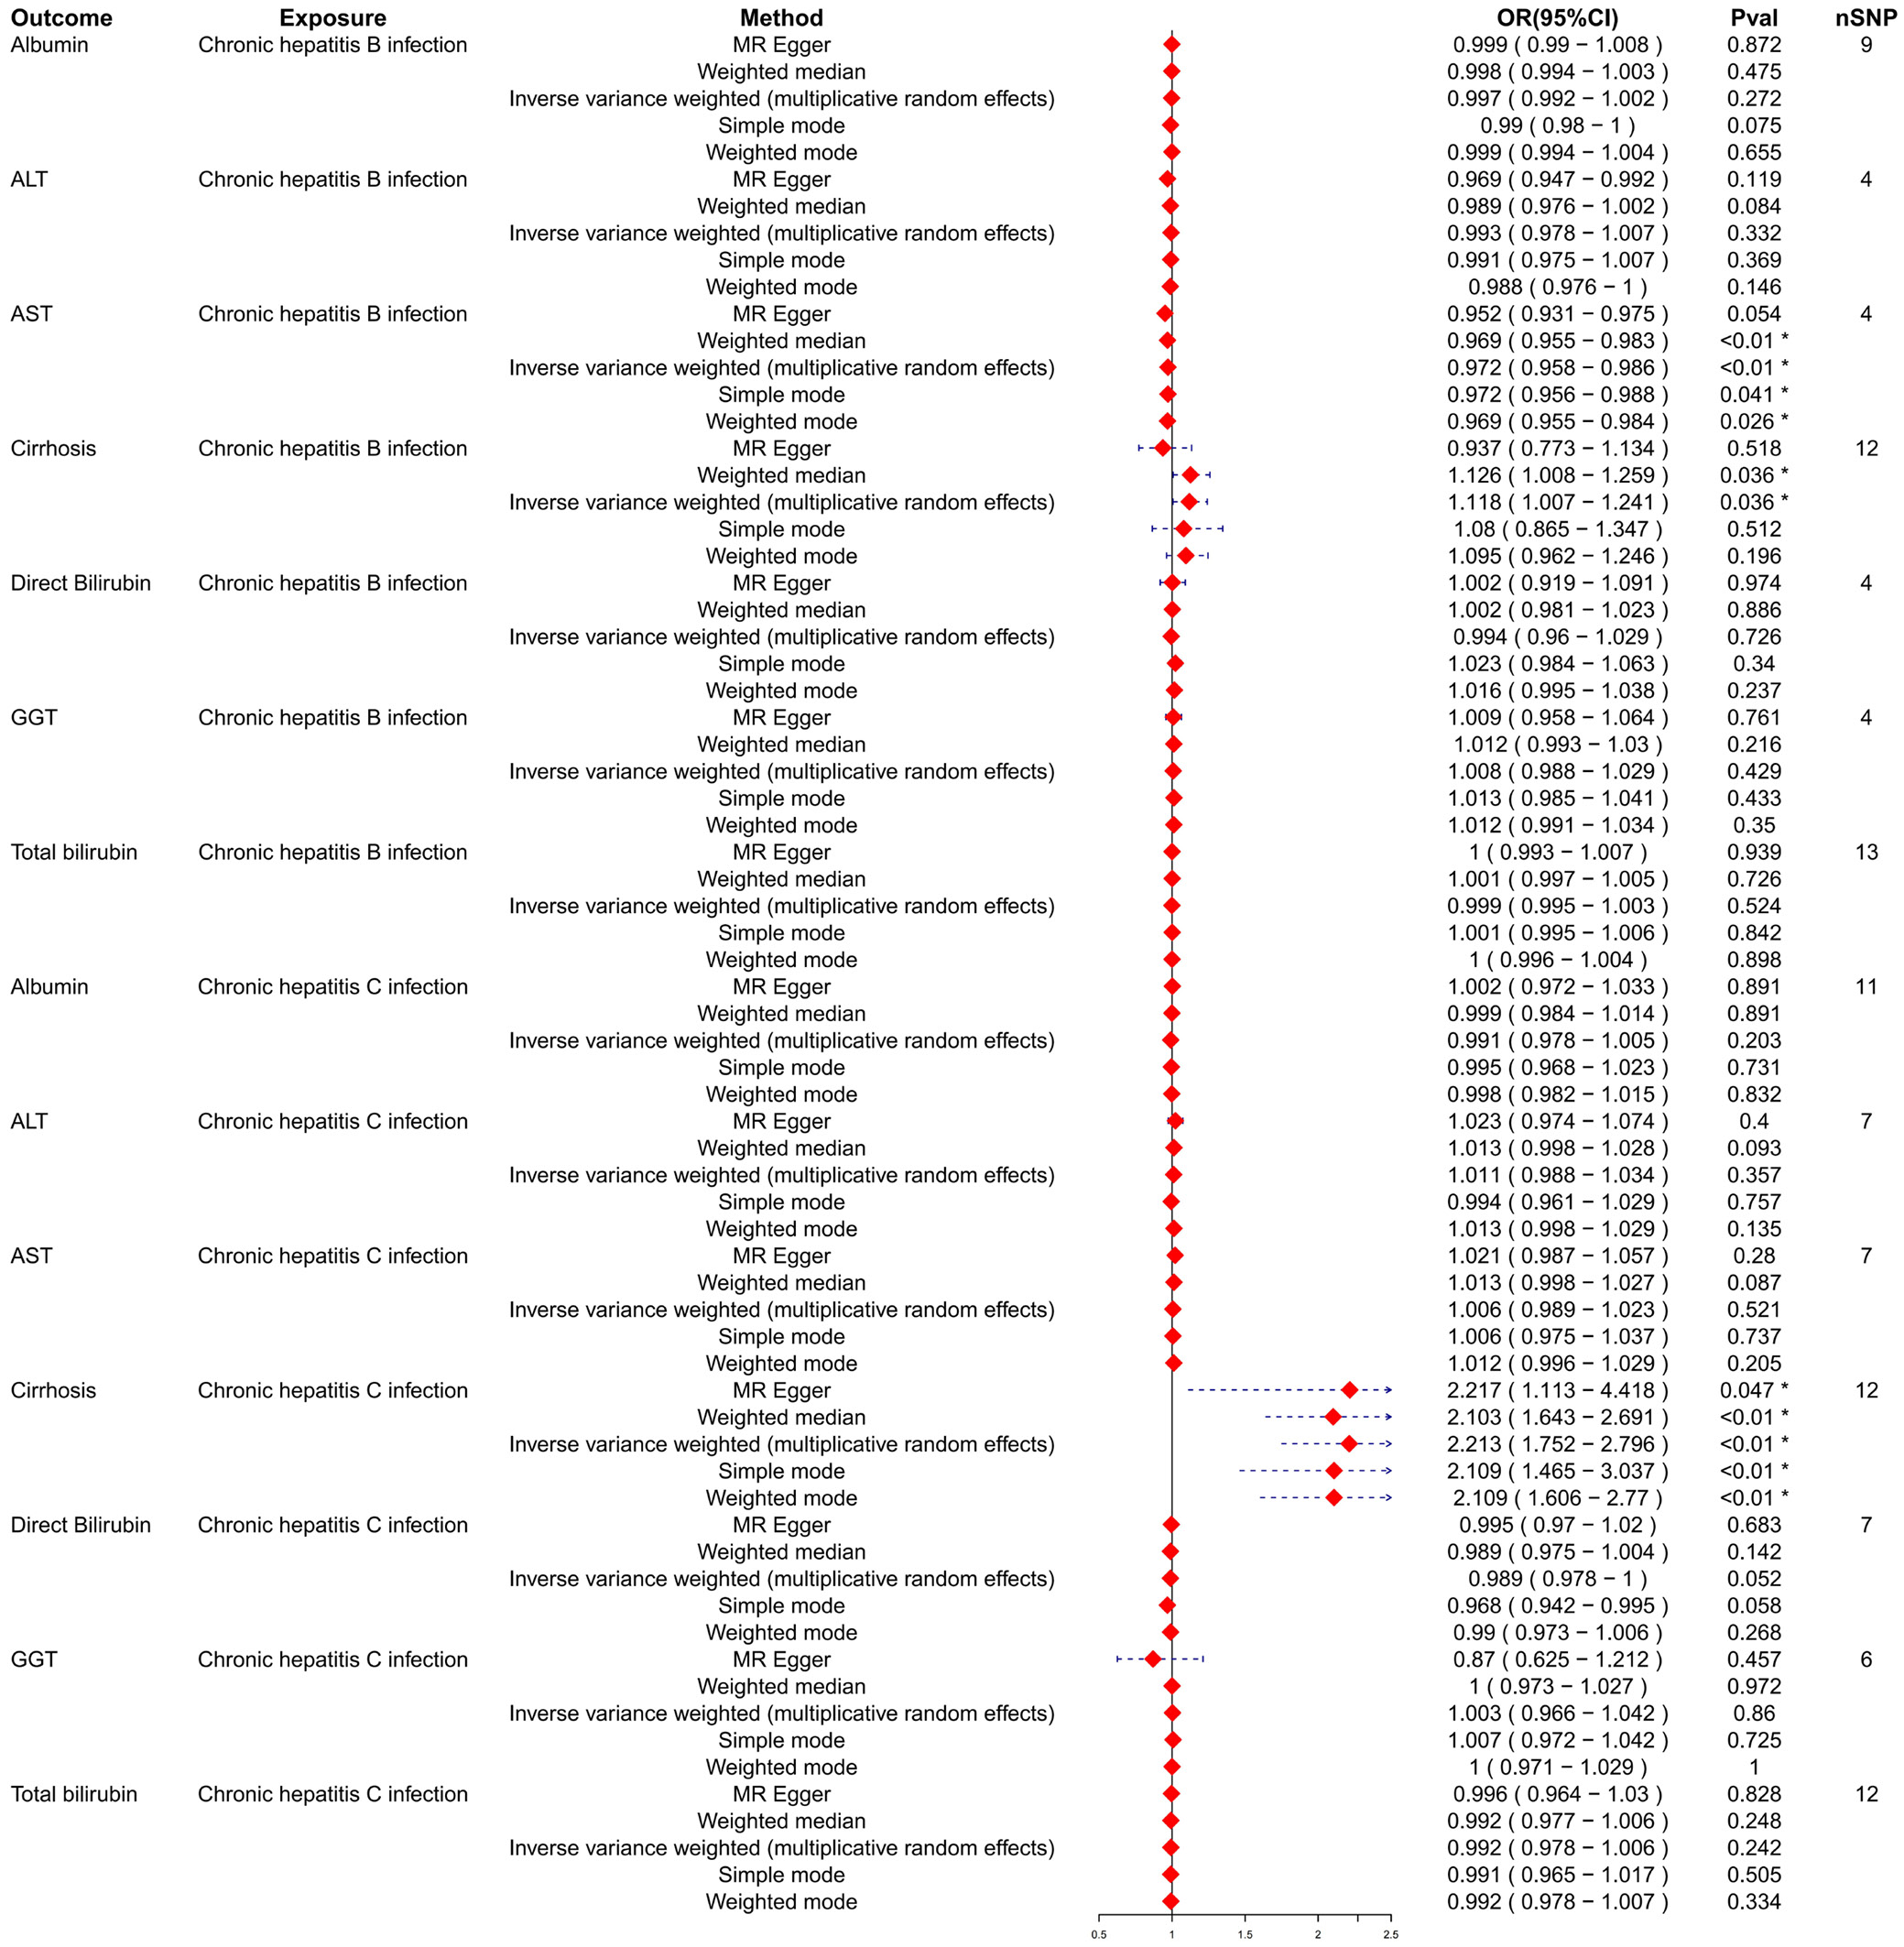
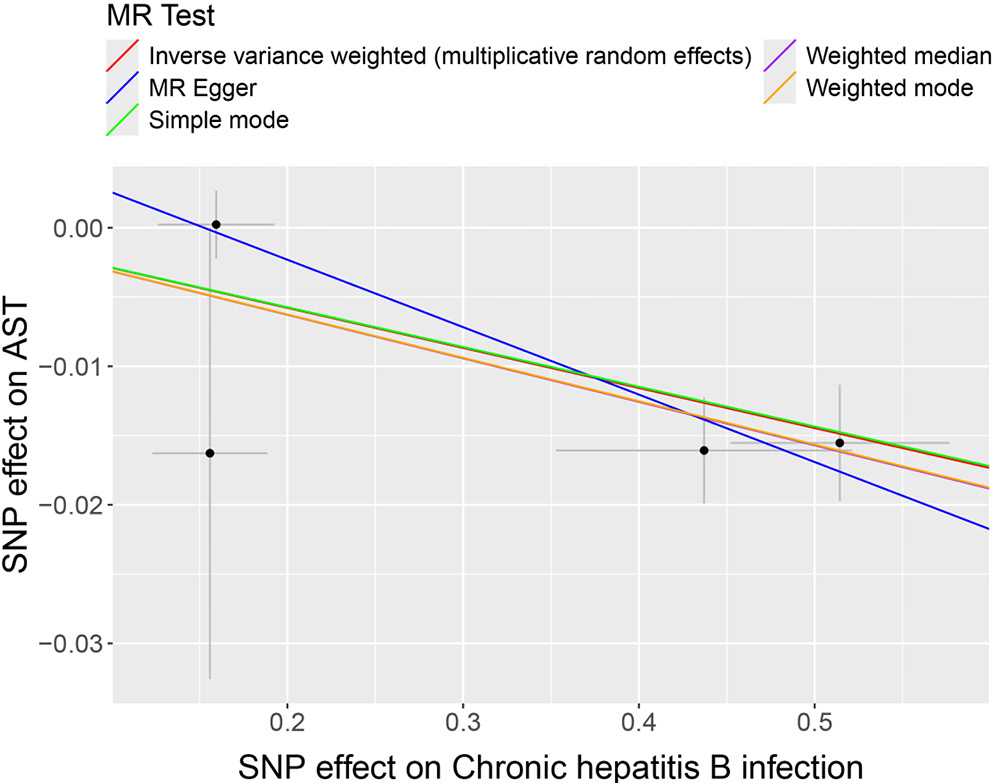
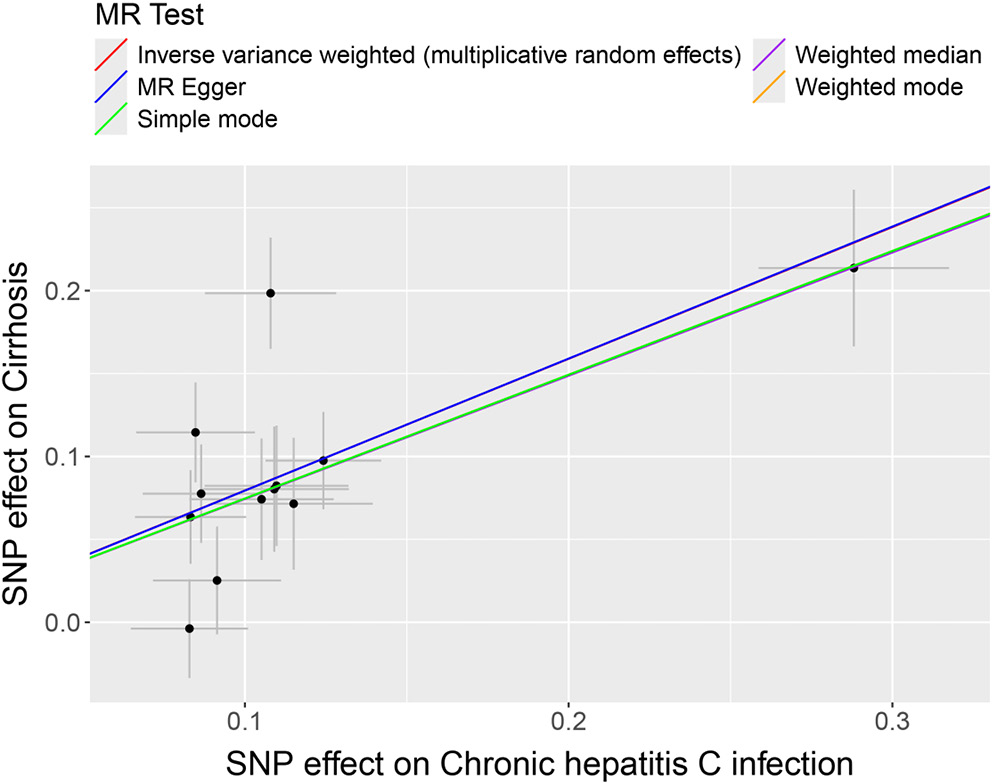
Subsequently, HBV and HCV were considered as exposures, with cirrhosis and liver biomarkers as outcomes, to conduct a reverse MR analysis. This approach further examined the causal relationships between HBV, HCV, cirrhosis, and liver biomarkers. Variants demonstrating pleiotropic effects were meticulously identified and subsequently excluded to ensure the integrity and accuracy of the causal inference. The results indicated a potential causal relationship between HBV and AST, with significant findings from the IVW model (OR = 0.972; 95% CI: 0.958–0.986; p < 0.01; Figure 3). The trends observed in MR-Egger, IVW and weighted median analyses were consistent and negatively correlated, suggesting HBV acts as a potential protective factor for AST levels, with an increasing probability of reduced AST levels as HBV increases (Figure 4). Similarly, a potential causal relationship was found between HCV and cirrhosis, with significant results from the IVW model (OR = 2.213; 95% CI: 1.752–2.796; p < 0.01; Figure 3) and consistent trends across MR-Egger, IVW and weighted median analyses, indicating a positive correlation (Figure 5). An OR greater than 1 suggests that HCV is a potential risk factor for cirrhosis, with an increasing probability of cirrhosis as HCV levels rise.
Sensitivity analysis on the relationship between hepatitis, cirrhosis and liver biomarkers
The sensitivity analysis examined the robustness of associations between hepatitis B and C infections (chronic) and various liver biomarkers. For hepatitis B, the analysis indicated significant heterogeneity in the associations with albumin (Q_pval = 0.0117) and cirrhosis (Q_pval = 0.135), but not with other biomarkers. The lack of significant pleiotropy suggests that the associations observed are likely not confounded by unmeasured variables. However, for direct bilirubin, significant heterogeneity was observed without pleiotropic effects (Table 1).
In the context of HCV, there were no significant pleiotropic effects across all biomarkers, indicating robust associations. Some heterogeneity was noted, particularly with ALT (Q_pval = 0.0014), cirrhosis (Q_pval = 0.0157) and total bilirubin (Q_pval = 0.0416), but it was not deemed substantial as the pleiotropy p-values remained high.
When reversing the analysis by considering HBV and HCV as outcomes and biomarkers as exposures, substantial heterogeneity was found across most biomarkers for both HBV and HCV, indicated by the Q statistic. The Q_pval was notably low for cirrhosis with HBV infection (Q_pval = 0.0056) and for cirrhosis with HCV infection (Q_pval = 0.001), suggesting significant variability in the results. The p-values for pleiotropy remained high, indicating no substantial pleiotropic influences (Table 2).
Discussion
The degree of liver damage in viral hepatitis can be inferred through the measurement of liver biomarkers. This study employs a bidirectional multi-sample MR approach to explore the causal relationships between HBV, HCV, cirrhosis, and liver biomarkers. Key findings include: 1) a potential causal relationship between cirrhosis and HBV, with an increasing likelihood of HBV as cirrhosis levels rise; 2) a potential causal link between HBV and AST, where higher HBV levels correspond to a gradual decrease in AST levels; and 3) a potential causal relationship between HCV and cirrhosis, with an increased probability of cirrhosis as HCV levels rise. Moreover, the MR analysis indicates no horizontal pleiotropy or heterogeneity and does not establish a causal relationship between HBV, HCV and other liver biomarkers. This study’s approach and findings contribute to understanding the genetic factors underlying the progression from viral hepatitis to liver cirrhosis, emphasizing the importance of genetic research in uncovering the mechanisms of disease progression.
During the course of viral hepatitis infections, liver biomarkers such as levels of transaminases and bilirubin, among other inflammation indicators, play a pivotal role. These markers not only serve as indicators of disease progression but may also influence the degree of viral replication and liver damage.22 Previous research into the relationship between HBV and AST has demonstrated a close association between AST levels in the blood and the extent of liver damage. HBV infection damages liver cells, triggering an immune response. This causes inflammation and the release of AST into the bloodstream, raising serum AST levels.23 In studies exploring liver biomarkers and HCC, including a two-sample MR study based on observational research, while there was no strong evidence to suggest a causal relationship between genetically predicted levels of ALP, ALP and GGT with HCC, elevated levels of AST were associated with an increased risk of HCC.24 This current study, through MR analysis, identifies a causal relationship between HBV infection and AST levels, suggesting that HBV infection acts as a potential protective factor against elevated AST levels. Considering chronic HBV infection as a significant risk factor for HCC, it is posited that during the acute phase of HBV infection, AST levels rise significantly, but as the infection transitions from acute to chronic, AST levels gradually normalize.18 This suggests that monitoring AST levels could provide insights into the extent of liver damage and progression of disease in HBV patients. However, further research is needed to corroborate the causal relationship between HBV and AST.25, 26
In the analysis of the causal relationships between HBV, HCV and cirrhosis, this study, employing cirrhosis and liver biomarkers as exposures with HBV and HCV as outcomes, identifies a causal linkage between cirrhosis and both HBV and HCV. These viruses cause persistent damage to liver cells through inflammation, leading to liver fibrosis and, eventually, cirrhosis.27 Previous research, such as the study by Kamiza et al. employing bidirectional MR to investigate individuals of East Asian descent in South Korea, revealed that chronic HBV infection is causally related to HCC and extrahepatic cancers, marking chronic HBV infection as a significant risk factor for HCC.28 Additionally, GWAS highlighted by Zeng et al. have found that genetic loci associated with higher levels of HBV surface antigen increase the risk of cirrhosis, providing a genetic foundation for the progression of liver disease in HBV-infected individuals.29 The physiological mechanism, which sees prolonged liver inflammation leading to fibrosis and cirrhosis, supports the causal relationship between cirrhosis and HBV and HCV infections. It suggests that controlling the progression of HBV and HCV infections could potentially reduce the risk of cirrhosis.
To ensure the robustness of our findings, we conducted several sensitivity analyses, including MR-Egger regression and the weighted median approach. The results were consistent with the main findings, indicating that the observed associations were reliable. MR-Egger showed no significant directional pleiotropy, suggesting that the genetic instruments did not introduce bias, while the weighted median method provided similar estimates, reinforcing the validity of the results. These findings confirm that potential biases from pleiotropy were minimal, supporting the robustness of the study’s conclusions regarding the causal effects of HBV and HCV on liver biomarkers.
Despite the robustness of our analysis, several potential sources of bias must be considered. Population stratification, where genetic differences between populations may confound the results, is a key concern, especially given the use of GWAS data from primarily European populations. Although PCA was employed to adjust for stratification, residual confounding could still be present. Additionally, pleiotropy, where genetic variants influence the outcome through pathways other than exposure, could introduce bias into MR analyses. While sensitivity analyses, including MR-Egger regression, indicated limited pleiotropy in this study, it remains a potential source of bias. Finally, measurement errors in GWAS data, such as inaccuracies in phenotype classification or exposure variables, could affect the precision of the causal estimates. Future studies with more precise phenotypic measurements and larger, more diverse populations will be necessary to validate these findings further.
The causal links between HBV and HCV infections and liver biomarkers, such as AST, observed in this study are supported by well-established physiological mechanisms. Both HBV and HCV infections are known to cause liver inflammation, which leads to elevated AST levels as a result of hepatocellular injury.30, 31 Aspartate aminotransferase is released into the bloodstream when liver cells are damaged, making it a key marker for liver function and disease progression.32 Chronic viral infections, such as HBV and HCV, can lead to sustained liver damage, cirrhosis and HCC, further contributing to elevated AST levels.33 Future research should focus on elucidating the precise biological pathways through which HBV and HCV infections affect liver biomarkers, providing deeper insights into potential therapeutic targets and enhancing the scientific basis for the observed causal relationships. Such investigations could pave the way for clinical applications aimed at monitoring and managing liver health in patients with chronic viral hepatitis.
Limitations
Despite the broad data sources used in this study, several limitations need to be acknowledged. First, the reliance on publicly available GWAS databases introduces a potential limitation due to the lack of racial and genetic diversity. As a result, the findings may not be fully generalizable to populations outside of those predominantly represented in these datasets. Future studies should aim to incorporate more diverse populations to assess whether the observed causal relationships are consistent across different genetic backgrounds.
Additionally, MR is primarily focused on genetic factors and does not fully account for the influence of environmental and lifestyle factors, which play a significant role in the development and progression of liver diseases such as HBV and HCV. Factors like alcohol consumption, diet and environmental exposures are crucial contributors to liver health, and their exclusion may limit the comprehensiveness of the findings. Future research should consider incorporating multifactorial approaches that integrate genetic, environmental and lifestyle factors to provide a more complete understanding of the risks associated with liver disease.
Moreover, MR analysis is based on key assumptions, including the strong association between genetic variants and the exposure of interest, as well as the independence of these variants from confounders. In practical applications, these assumptions may not always hold, potentially introducing bias into the results.
Finally, while this study primarily focuses on genetic factors, a more comprehensive approach involving multifactorial models could offer a deeper understanding of the interactions between genetics, environmental factors and lifestyle in the context of HBV, HCV and liver disease progression. These approaches can help identify more nuanced risk factors and inform targeted strategies for prevention and treatment. In future research, expanding the population diversity, incorporating environmental and lifestyle data and using more advanced analytical models will be important steps toward overcoming the limitations identified in this study.
Conclusions
The results from this study may help identify potential therapeutic targets for managing liver diseases in patients with chronic viral hepatitis and contribute to the growing field of precision medicine in hepatology. By employing MR to analyze the causal relationships between HBV, HCV, liver biomarkers, and cirrhosis, this research suggests that monitoring AST levels can evaluate the extent of liver damage due to HBV infection, emphasizing the importance of controlling the progression of HBV and HCV infections in preventing cirrhosis. It provides new insights into the genetic basis of liver disease progression, paving the way for future genetic research in liver diseases. Monitoring AST levels may serve as a valuable indicator of liver damage progression in chronic HBV infection and could inform treatment strategies aimed at preventing cirrhosis.
Supplementary data
The supplementary materials are available at https://doi.org/10.5281/zenodo.15086692. The package includes the following files:
Supplementary Table 1. Information on the samples used for the MR analysis.
Data availability
The datasets generated and/or analyzed during the current study are available from the corresponding author on reasonable request.
Consent for publication
Not applicable.
Use of AI and AI-assisted technologies
Not applicable.