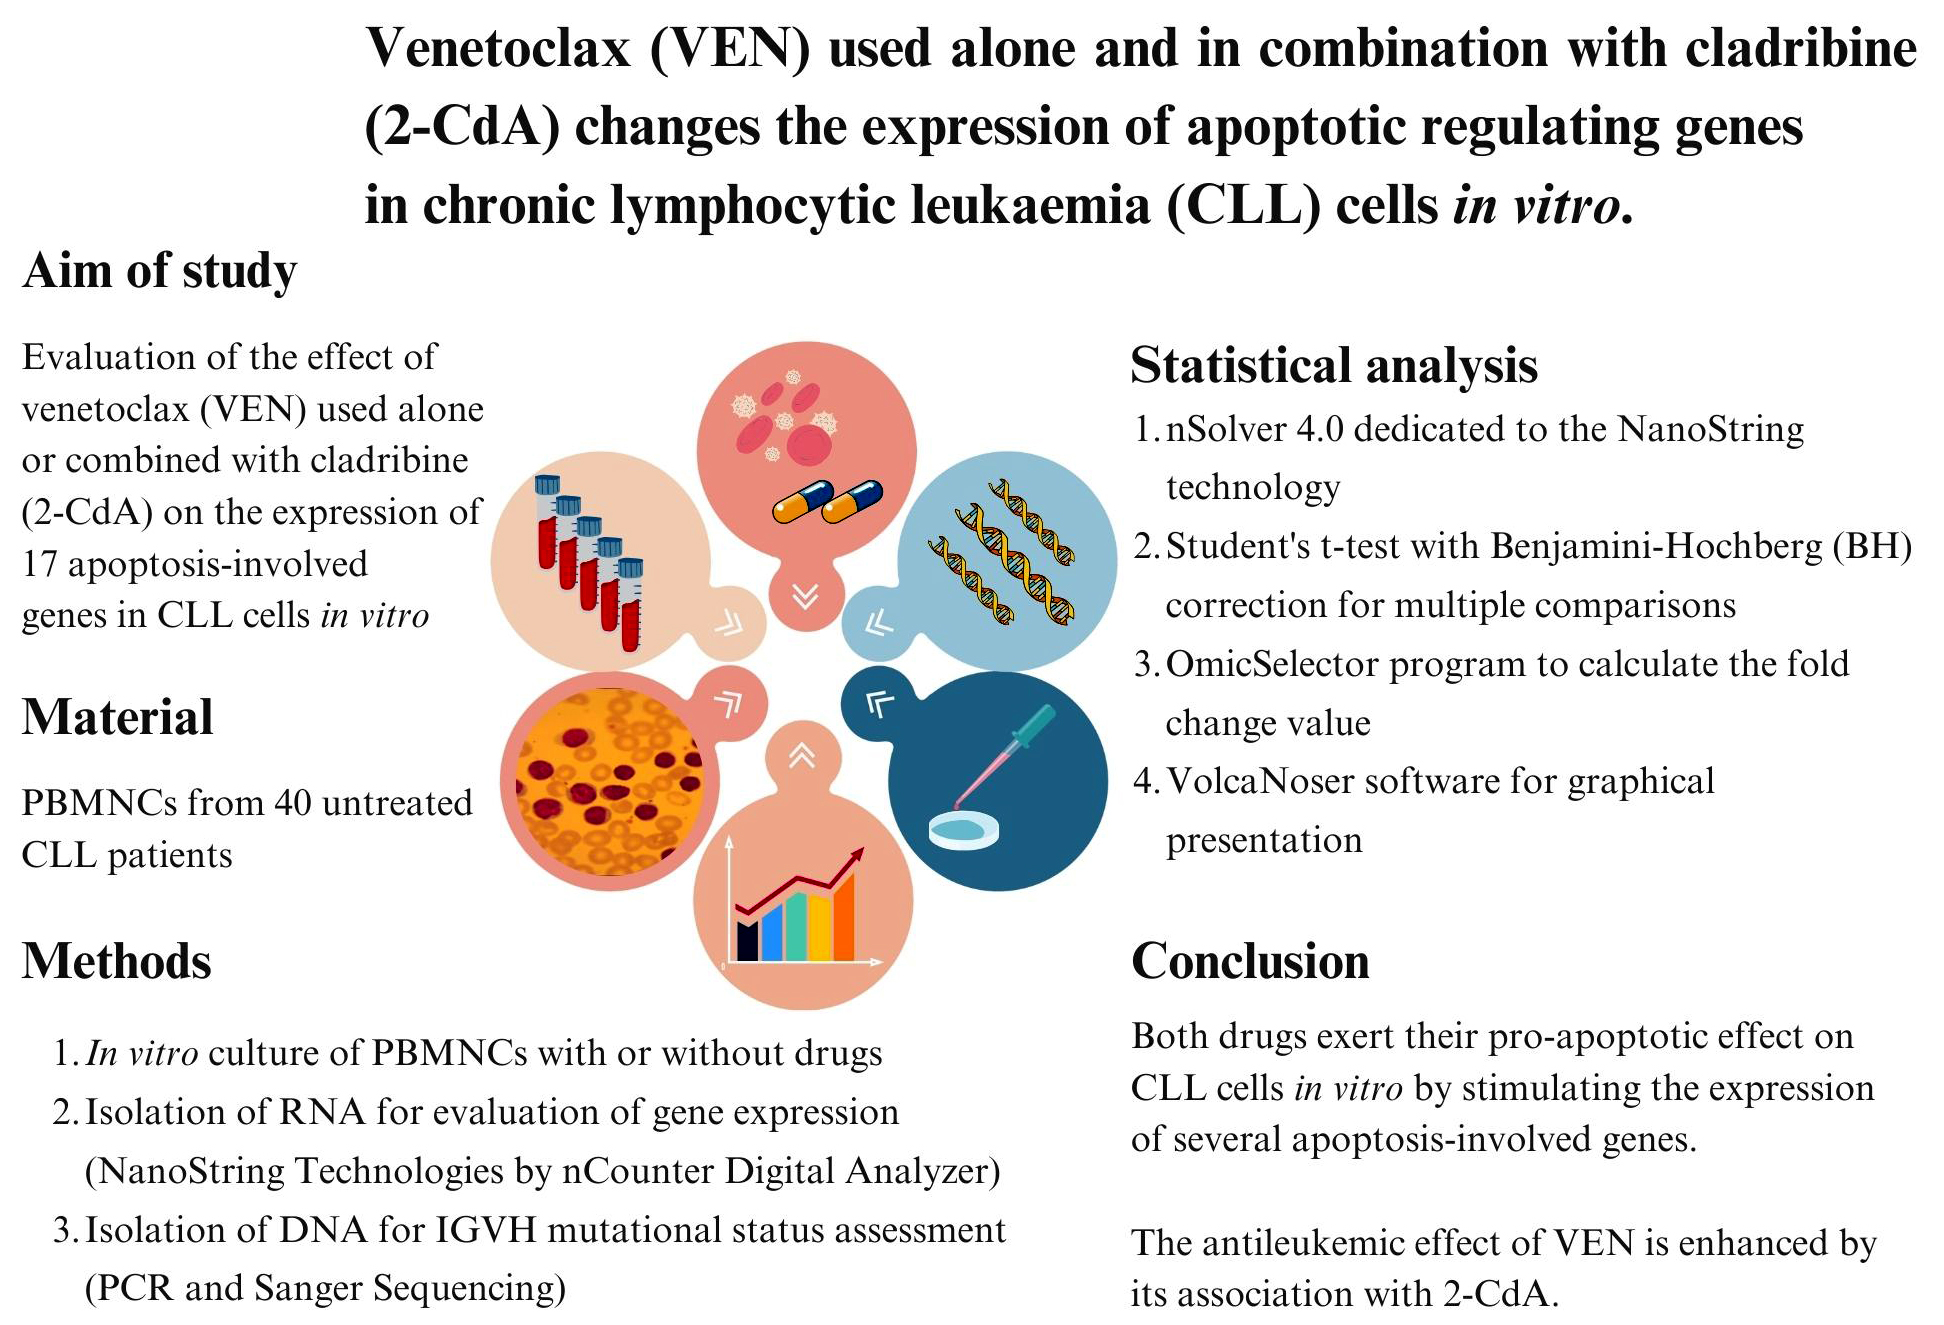
Abstract
Background. Venetoclax (VEN) and cladribine (2-CdA) are active agents in the treatment of chronic lymphocytic leukemia (CLL), although their precise pro-apoptotic mechanisms in CLL cells remain unclear. However, in vitro studies suggest that these drugs may alter the expression of several proteins involved in apoptosis.
Objectives. The aim of the study was to evaluate the effect of VEN and 2-CdA, used individually and in combination, on the expression of apoptosis-related genes in CLL cells in vitro.
Materials and methods. Mononuclear cells were collected from peripheral blood of 40 previously untreated CLL patients. The expression of 17 apoptosis-related genes was assessed using nCounter NanoString technology before and after 48-h in vitro incubation with VEN, 2-CdA or their combination (VEN + 2-CdA).
Results. Venetoclax + 2-CdA had a stronger effect on all tested genes except BCL2 and PMAIP compared to VEN alone, and on BID, BIK, FADD, P53, and SMAD3 compared to 2-CdA alone.
Conclusions. Venetoclax and 2-CdA may exert their pro-apoptotic effects on CLL cells in vitro, at least in part, by stimulating the expression of several apoptosis-related genes. The antileukemic activity of VEN is further enhanced when combined with 2-CdA.
Key words: apoptosis, cladribine (2-CdA), CLL, gene expression, venetoclax (VEN)
Background
The most common leukemia in the Northern hemisphere is chronic lymphocytic leukemia (CLL). However, despite impressive progress in treatment, resulting in a considerable prolongation of survival, the condition remains incurable. Chronic lymphocytic leukemia peripheral blood lymphocytes have low proliferative potential, with the majority being blocked in the G0/G1 phase of the cell cycle in vivo.1 Such inhibition of apoptosis prolongs their lifespan and is considered the primary reason for their accumulation in peripheral blood, lymph nodes and other organs.
For many decades, the cornerstone of CLL treatment has been the combination of alkylating agents and purine analogues with anti-CD20 antibodies. Recently, the role of immunochemotherapy has become increasingly important in many cases by the use of small molecules, i.e., oral treatments targeted at molecular phenomena involved in the inhibition of apoptosis, which are active also in cases with cytogenetic and/or molecular high-risk factors. Currently, routine treatment is based on the use of CLL inhibitors of Bruton’s tyrosine kinase (BTKi) and the mitochondrial anti-apoptotic BCL2 protein, which is hyperexpressed in CLL.2, 3
One of the most active drugs currently used in CLL is venetoclax (VEN), a highly selective BCL2 antagonist. Venetoclax is able to mimic the function of pro-apoptotic BH3-only proteins (BH3s). Its mechanism of action involves the intrinsic apoptotic pathway and it is able to directly induce the apoptosis independently of TP53, making it also active in patients with del17p/mutTP53.3 When administrated in association with anti-CD20 antibodies, VEN is efficacious in the eradication of measurable residual disease (MRD), which is correlated with improvement of survival parameters. It is also active in patients after failure of BTKi.4 However, a number of patients respond neither to BTKi nor to VEN or become resistant to both, and the management of these double-resistant patients is a challenge that has driven research into molecular-targeted drugs in CLL.5, 6 However, little is known about the possibility of combining VEN with classic chemotherapy in CLL. Such combinations were tested in acute leukemias, and the combination of VEN with azacytidine, decitabine or low-dose cytarabine is approved for the treatment of acute myeloid leukemias in frail patients.7, 8, 9 Venetoclax has also been trialed with bendamustine, a drug combining the properties of alkylating agents and purine analogue, as a treatment for CLL.10, 11, 12
Our previous in vitro studies13 examined the influence of VEN, cladribine (2-chlorodeoxyadenosine, 2-CdA) and their combination on peripheral blood lymphocyte viability and apoptosis in 103 previously-untreated patients with CLL; that study also determined the expression of some proteins involved in apoptosis. 2-CdA is a purine analogue, which has been found to be efficacious in CLL and hairy cell leukemia. It is believed to act by incorporating into newly synthesized DNA in place of deoxyadenosine, thereby disrupting the DNA helix, inhibiting its repair, and ultimately inducing apoptosis – primarily through the intrinsic pathway.14 We found a strong synergy between VEN and 2-CdA regarding their proapoptotic activity and potential to modify the cellular content of several factors involved in apoptosis. In particular, treatment increased the levels of active caspase-3, caspase-9, p53, BIM (Bcl-2-interacting mediator of cell death), BAX (Bcl-2-associated X protein), NOXA (Phorbol-12-myristate-13-acetate-induced protein 1), PUMA (p53 upregulated modulator of apoptosis), and FADD (Fas-associated death domain protein), while reducing the proportion of BCL2-expressing cells. These findings suggest that the drugs exert their effects by modulating the expression of key regulators of apoptosis.13 To further explore the effect of VEN and 2-CdA on CLL lymphocytes, the present study examines whether the 2 drugs, used alone or in combination, modify the expression of selected genes encoding apoptosis-regulating proteins.
Objectives
Building on previous research, the present study aims to determine the influence of VEN and 2-CdA, used individually or in combination, on the expression of apoptotic proteins in CLL cells in vitro. It examines the effect of the drugs on the expression of the genes encoding the previously tested proteins.
Materials and methods
Materials
Peripheral blood mononuclear cells (PBMNCs) were collected from 40 untreated CLL patients (15 women and 25 men; mean age 66 years, range 46–85 years) during routine diagnostic procedures at the Department of Hematology, Medical University of Lodz, and the Regional Multispecialistic Center of Oncology and Traumatology in Łódź, Poland (Table 1). The diagnosis was established according to the International Workshop on Chronic Lymphocytic Leukemia (iwCLL) 2018 criteria. All patients gave their written informed consent to participate in this study. The study was approved by the Ethics Committee of the Medical University of Lodz (approval No. KE/1287/18 issued October 16, 2018).
Drugs
Venetoclax was supplied by Abbvie USA (Warsaw, Poland) and was used at a concentration of 40 nM, alone or in combination with 2-CdA. 2-CdA was purchased from Institute of Biotechnology and Antibiotics (Warsaw, Poland) and used at concentration of 16 μM. These concentrations were chosen according to previous research.13
Isolation of RNA material for gene expression
The Syngen Blood/Cell RNA Maxi Kit (Syngen Biotech, Wrocław, Poland) was used to isolate total RNA from the cell pellet obtained before the culture and after 48-h incubation. RNA isolation was carried out manually, according to the instructions provided by the manufacturer’s kit. RNA purity was assessed with spectrophotometry with an acceptable purity of the material range of 1.9–2.1 at A260/A280 absorbance. This assessment was performed using the Tapestation 4200 (Perlan Technologies, Warsaw, Poland), which enables fully automatic RNA gel electrophoresis, and thus allows for the assessment of the total RNA quality. In case of several samples, it was necessary to use a kit for cleaning and concentrating of total RNA (Syngen RNA clean-up Kit; Syngen Biotech).
Isolation of DNA material for IGVH mutational status assessment
Total DNA was isolated from the cell pellet material obtained before culture using the Syngen Blood/Cell DNA Maxi Kit (Syngen Biotech) according to the manufacturer’s protocol.
Gene expression
Gene expression in the isolated mononuclear cells was tested before and after 48-h incubation. We selected 17 genes known to encode factors involved in apoptosis including those the products of which had been researched in our previous study13; BCL2, BAX, BBC3, BIM, P53, APAF1, BAK, BID, BIK, CASP3, CASP8, CASP9, CFLAR, FADD, NOTCH1, PMAIP, and SMAD3. In some cases, the gene products had been researched previously. Gene expression was quantified as RNA on the NanoString platform (NanoString Technologies, Seattle, USA) using the nCounter Digital Analyzer. Normalization for RNA loading was performed by application of 3 housekeeping genes (B2M, BUSB and GAPDH). The expression itself was determined using the NanoString method in the Laboratory of Molecular Diagnostics, First Department of Pathology and Experimental Cancer Research at Semmelweis University in Budapest, Hungary, in cooperation with Biomedica (Piaseczno, Poland).
Assessment of IGVH mutation status
The IGVH mutational status was evaluated with polymerase chain reaction (PCR) and Sanger sequencing according to manufacturer’s protocol, with our modifications. The IGVH-IGHD-IGHJ FASTA sequences were submitted to the ARResT/AssignSubsets tool (https://station3.arrest.tools/subsets/), which reports the assignment to major CLL stereotyped subsets, and to the IMGT/V-QUEST tool (https://www.imgt.org/IMGT_vquest/input), for analyzing rearranged immunoglobulin (IG) sequences and comparing the submitted IG sequences with IMGT reference directory sets. Mutational status was determined using PCR amplification and sequence analysis of IGVH-IGHD-IGHJ gene rearrangements; 98% identity cut-off to germline was used to define MUT-CLL (<98% identity) and UNMUT-CLL (≥98% identity).15
Statistical analyses
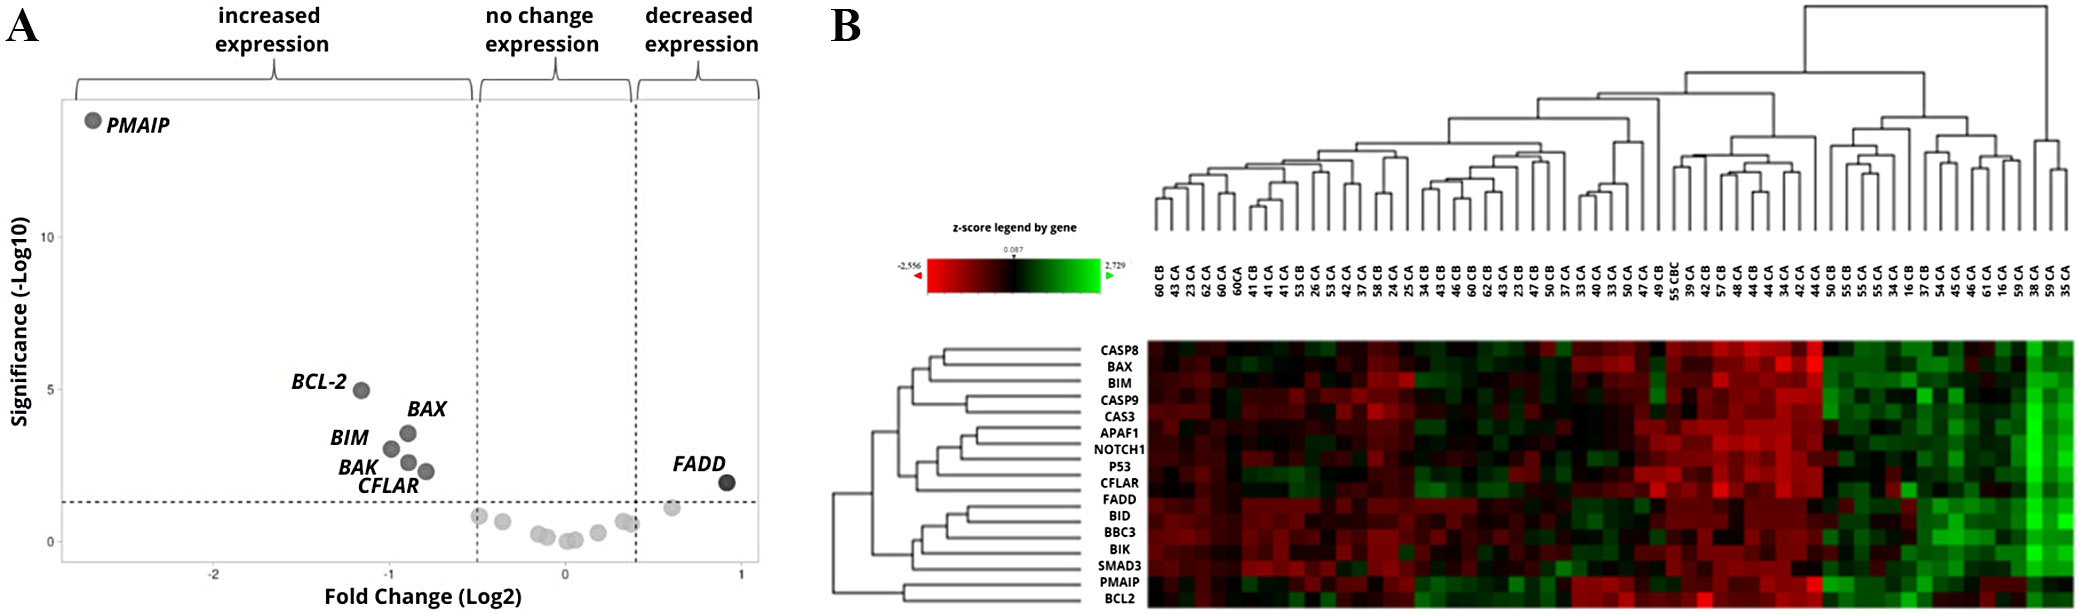
Statistical analysis of the expression levels of the 17 studied genes (n = 40) was performed using nSolver v. 4.0 software (NanoString, Seattle, USA), which is specifically designed for the NanoString platform. The program was also used to generate a graphical interpretation of the results in the form of heatmaps, based on the z-score values for individual genes. In heatmaps, the z-score presents the number of standard deviations (SDs) that the expression of a gene in a particular sample deviates from its mean expression across all samples, thus providing a standardized metric for relative comparison across different genes. The OmicSelector program was used to calculate the fold change (FC) value, estimating the fold changes in the test material relative to the reference material. A FC < 0.7 indicates reduced gene expression, FC > 1.3 indicates increased gene expression, and FC values between 0.7 and 1.3 are considered indicative of stable gene expression.
The difference between the tested genes and the housekeeping genes was evaluated using the Livak method (ΔΔCt method). This approach estimates FC in gene expression by first normalizing the expression of the target gene to a reference (housekeeping) gene within each sample (ΔCt), then comparing this normalized expression between 2 experimental conditions (ΔΔCt), and finally calculating the FC as 2−ΔΔCt. Statistical analysis of gene expression after normalization of the results was performed using the Student’s t-test (Welch’s correction for heteroscedasticity was applied) with Benjamini–Hochberg (BH) correction for multiple comparisons (n = 40, p < 0.05 was considered statistically significant).16
In the case of 1 gene (BCL2), the p-value was obtained using the Mann–Whitney U test due to the non-normal distribution of the data. It is essential to include normalization in gene expression analyses (e.g., RNA-seq and reverse transcription quantitative polymerase chain reaction (RT-qPCR)) to correct for variations in RNA input, reverse transcription efficiency and experimental conditions in general, thus ensuring that gene expression measurements reflect true biological differences.17, 18 Volcano plots were created using VolcaNoserR software (https://huygens.science.uva.nl/VolcaNoseR).
Results
Before the analysis of gene expression, the material was assessed for purity and degree of degradation. The results indicated that purity was over 90%, and the material was degraded in only 9.65%, which was sufficient for NanoString analysis.
The influence of the culture conditions on the expression of the tested genes was determined with a control group. The cells were cultured for 48 h without the addition of drugs, and the final expression levels were compared to the initial values measured prior to culture (i.e., the reference values). The culture resulted in a significant decrease in PMAIP, BCL-2, BAX, BIM, BAK, and CFLAR gene expression, and an increase in the expression of FADD. Increase in BID gene (FC > 1.3) was not significant (Table 2, Figure 1A). Changes in the expression of the genes during the control culture in individual patients are shown on the heatmap with hierarchical clustering of samples (n = 59 including duplicates) and genes (n = 17) (Figure 1B).
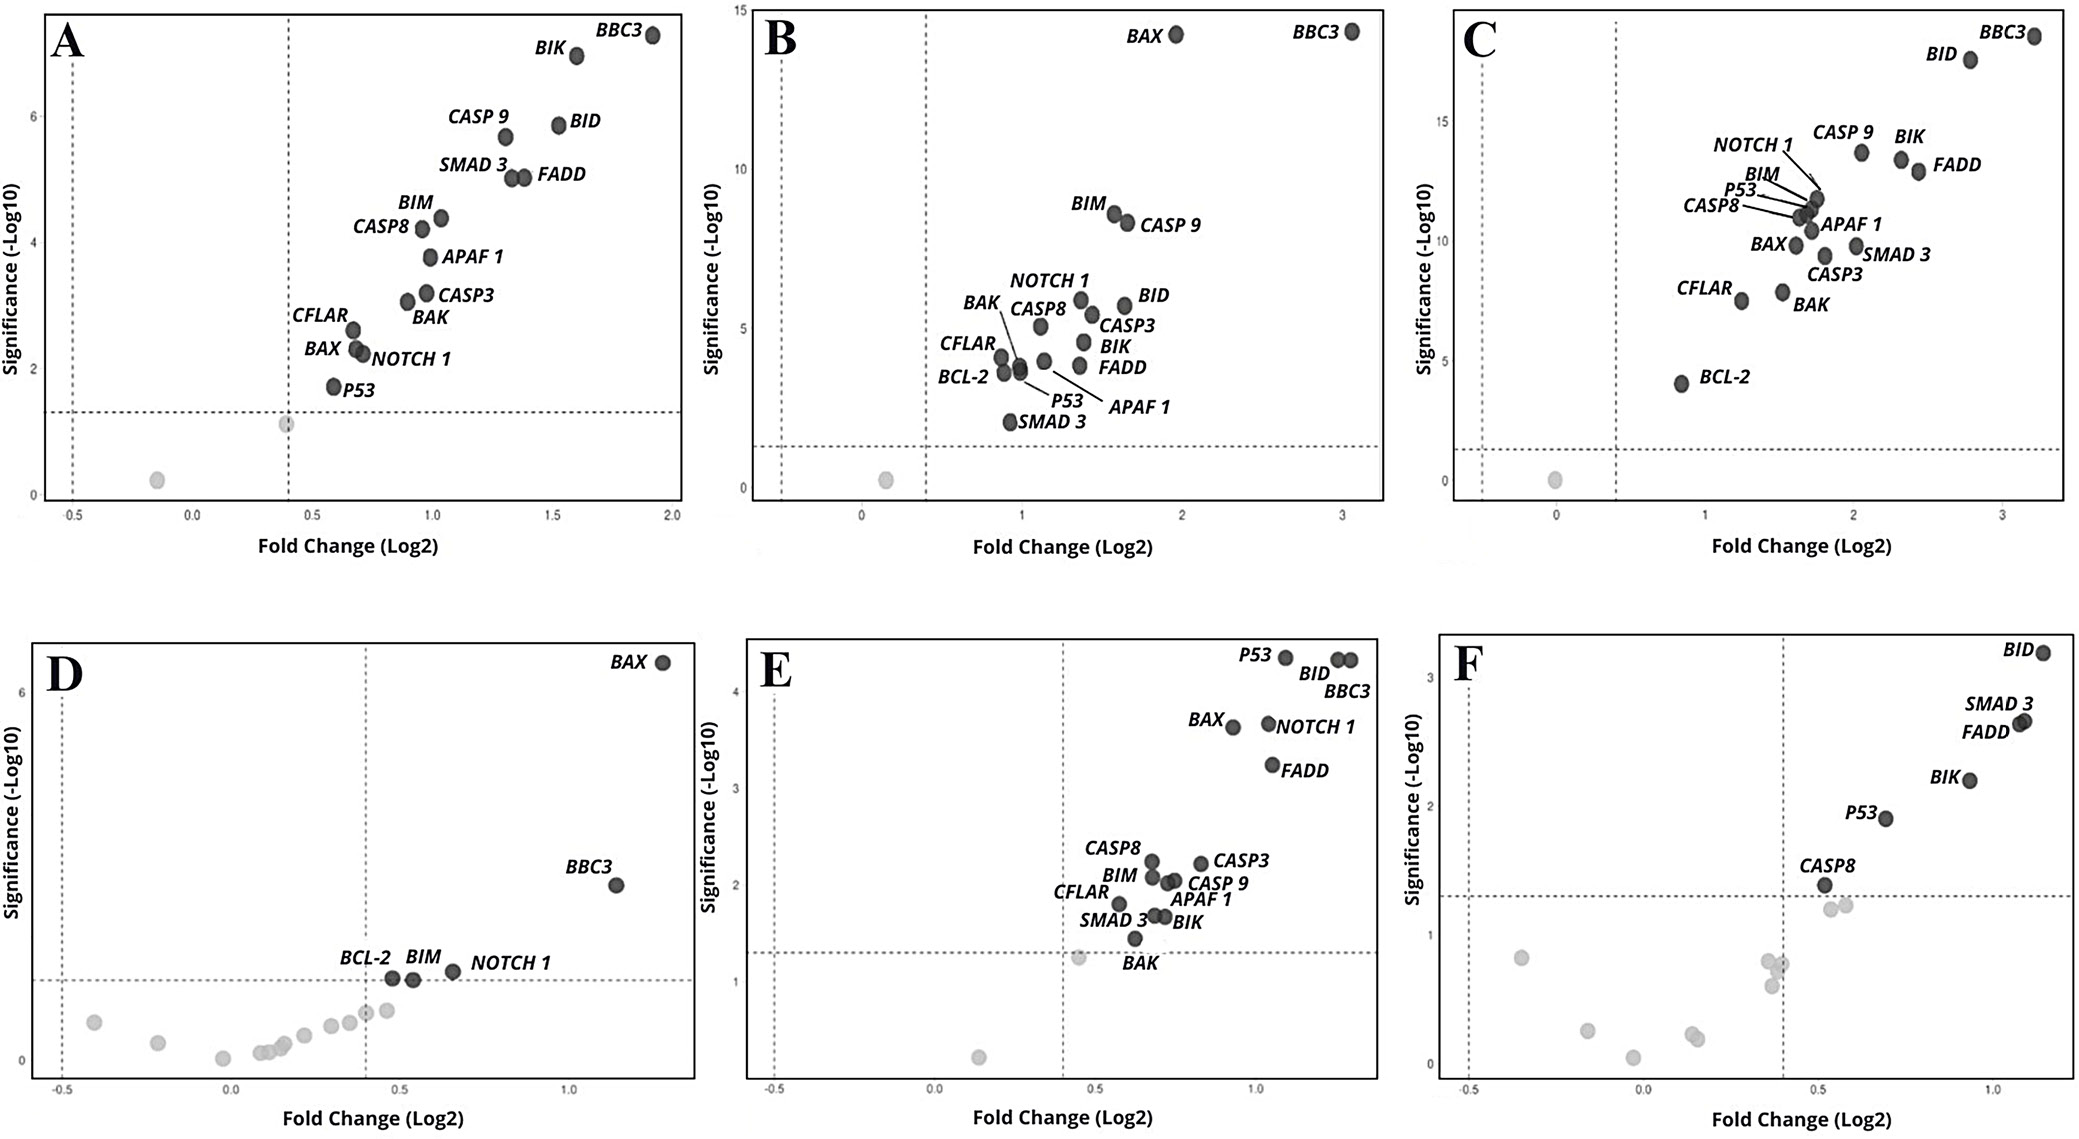
Culture with VEN (n = 65 including duplicates) resulted in a significant increase (FC > 1.3) in the expression of 7 genes: APAF1, SMAD3 (p = 0.001), NOTCH1 (p = 0.002), BBC3, BID, BIK, and FADD (p = 0.000), in relation to the corresponding values before culture. This was accompanied by a nonsignificant increase in 4 genes (TP53, CAS3, CAS8, CAS9) and a significant decrease in 2: BCL2 (FC = 0.587; p = 0.009) and PMAIP (FC = 0.141; p = 0.000). The expression of 4 genes (BAK, BAX, BIM, CFLAIR) did not change. Compared to the control culture after 48 h, VEN significantly increased the expression of all genes except BCL2 (FC = 1.312; p = 0.081), which showed a nonsignificant increase, and PMAIP1 (FC = 0.904; p = 0.595), which remained unchanged (Figure 2A, Figure 3A).
The presence of 2-CdA in the culture (n = 58, including duplicates) resulted in a significant increase in the expression of APAF1, BAX, BBC3, BID, BIK, CASP3, CASP8, CASP9, FADD, NOTCH1, TP53, and SMAD3 (FC > 1.3; p < 0.05), a nonsignificant increase in BIM (FC = 1.503; p = 0.076) and a significant decrease in PMAIP1 expression (FC = 0.173; p = 0.000), compared to pre-culture values. No change in BAK (FC = 1.067; p = 0.768), BCL2 (FC = 0.819; p = 0.324) or CFLAR (FC = 1.069; p = 0.768) was noted. Compared to the control cultures, 2-CdA significantly increased the expression of all genes apart from SMAD3 (FC = 1.901; p = 0.095), which demonstrated an insignificant increase, and PMAIP (FC = 1.1103; p = 0.589), which did not change (Figure 2B, Figure 3B). Following culture with VEN and 2-CdA (n = 68, including duplicates), all genes showed increased expression compared to pre-incubation levels, except for BCL2 (FC = 0.803; p = 0.233), which remained unchanged, and PMAIP1 (FC = 0.155; p = 0.000), which showed a significant decrease.
The increase was not significant for BAK (FC = 1.548; p = 0.055) and CFLAIR (FC = 1.369; p = 0.129). The addition of both drugs resulted in a significant increase in all genes compared to controls, except PMAIP (FC = 3.209; p = 0.975), which was insignificantly higher, and SMAD3 (FC = 0.994; p = 0.000) which did not differ (Figure 2C, Figure 3C).
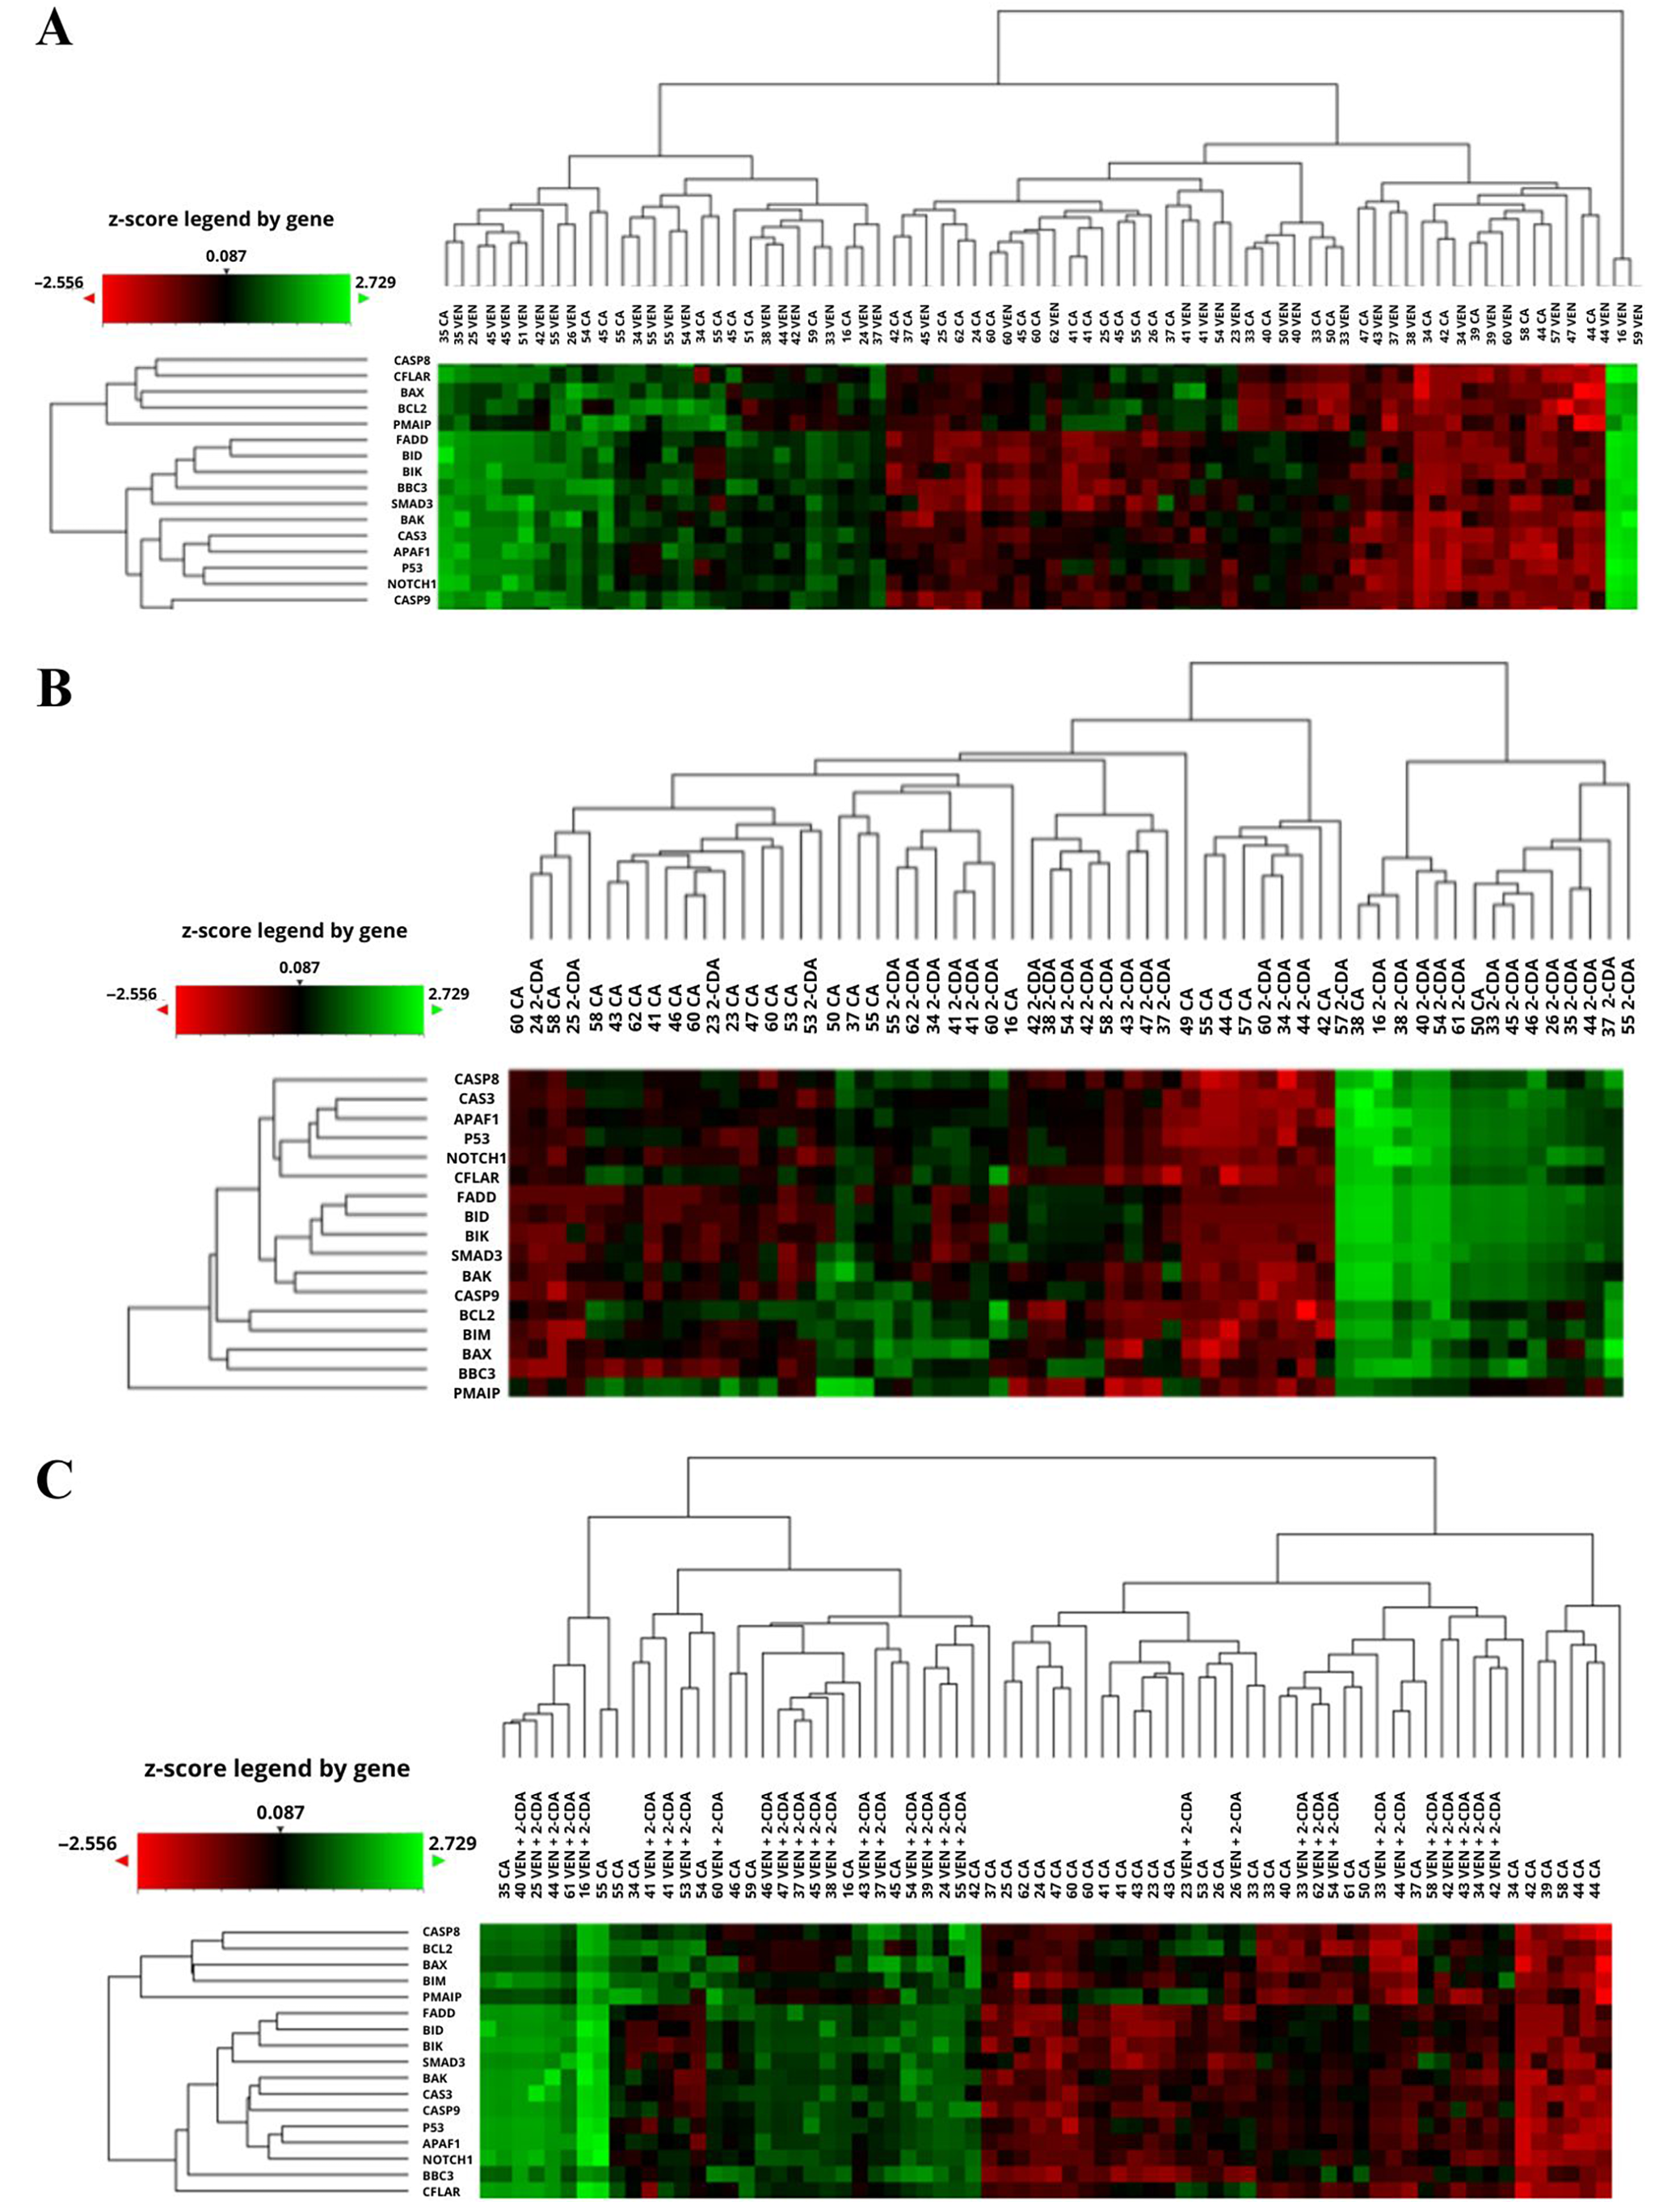
To assess the impact of various drugs or drug combinations on gene expression, FC values were calculated relative to the expression levels observed under treatment with the comparator drug. Cultures treated with 2-CdA, BAX (FC = 2.427; p = 0.000) and BBC3 (FC = 2.206; p = 0.012) showed significantly higher expression compared to cultures with VEN. Additionally, BCL2, BIM, CASP3, NOTCH1, and TP53 exhibited nonsignificantly higher expression levels than those observed in the VEN-treated cultures (n = 75 including duplicates; FC > 1.3; p > 0.050) (Figure 2D, Figure 4A).
Similar changes in gene expression were observed under the influence of both drugs. All genes demonstrated significantly stronger stimulation under 2-CdA+VEN compared to VEN alone (n = 73 including duplicates), with the exceptions of BCL2 (nonsignificant increase, FC = 1.3654, p > 0.050) and PMAIP (no changes, FC = 1.100) (Figure 2E, Figure 4B). In addition, BID (FC = 2.300, p = 0.011), BIK (FC = 1.911, p = 0.026), FADD (FC = 2.109; p = 0.013), P53 (FC = 1.617; p = 0.043), and SMAD3 (FC = 2.129; p = 0.013) demonstrated significantly higher expression under the influence of 2-CdA+VEN, compared to 2-CdA alone; only insignificant increases were noted for APAF1, BAK, CAS 8, CAS 9, and NOTCH1 (p > 0.050).
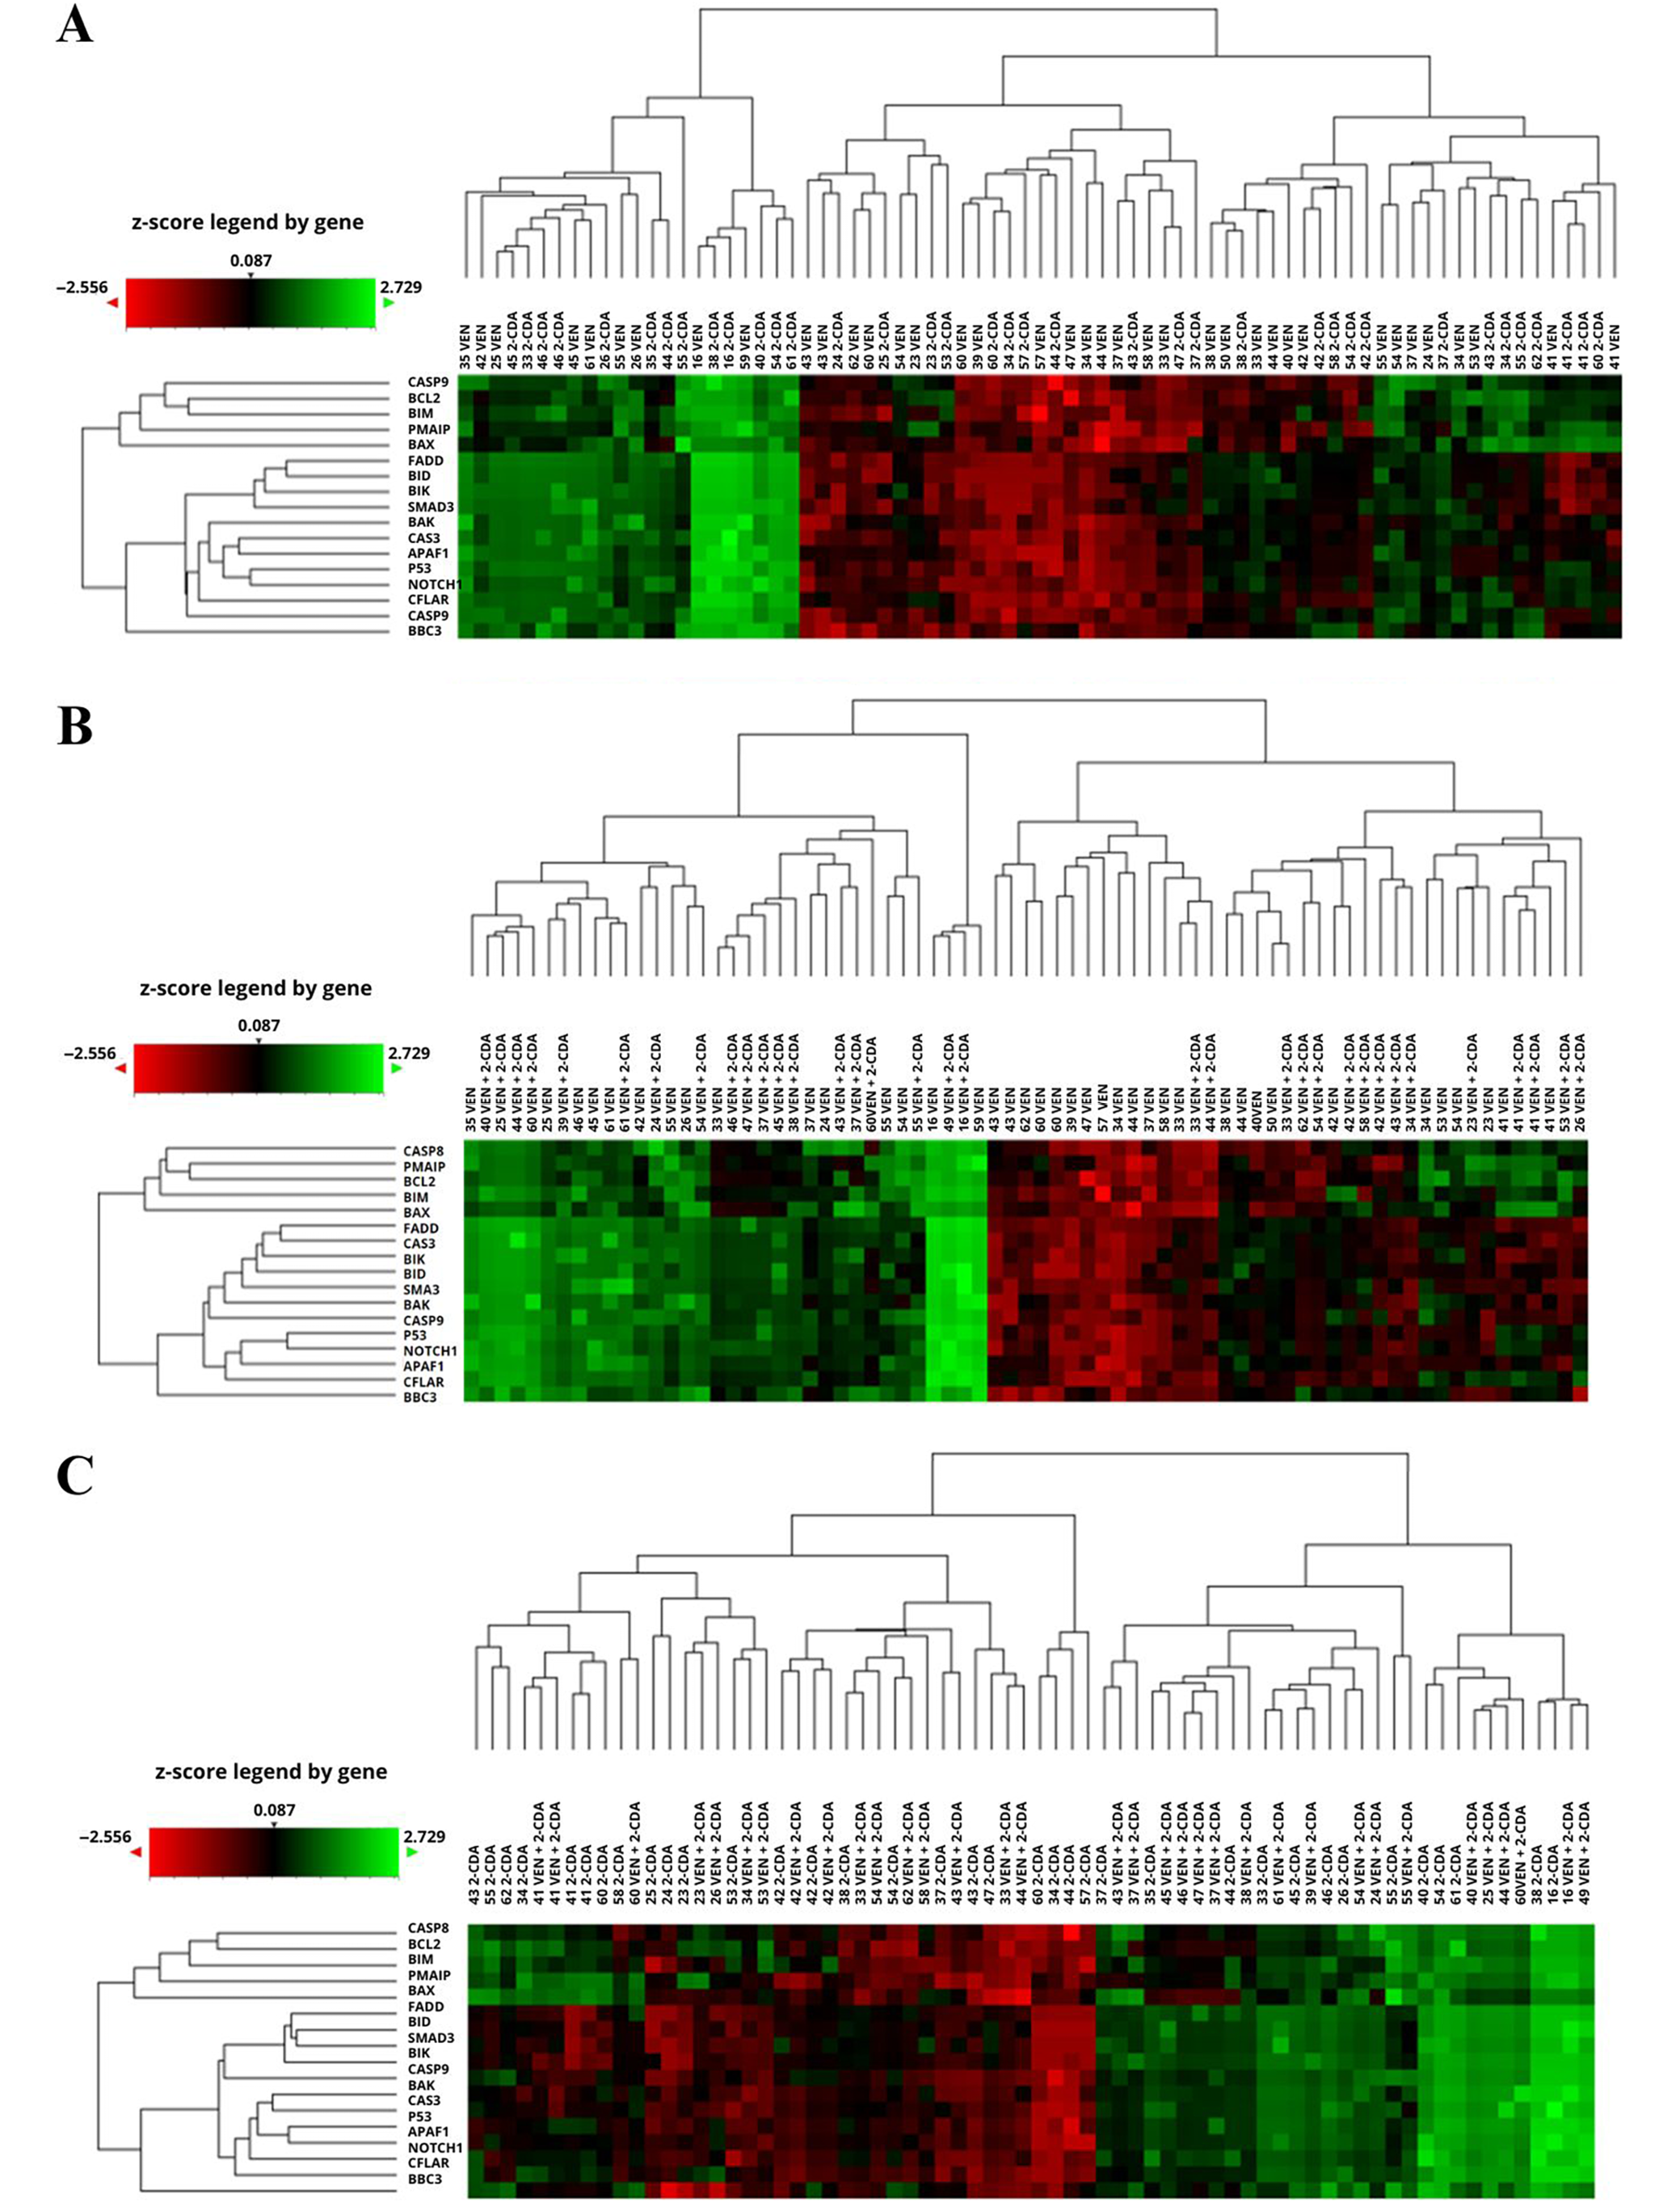
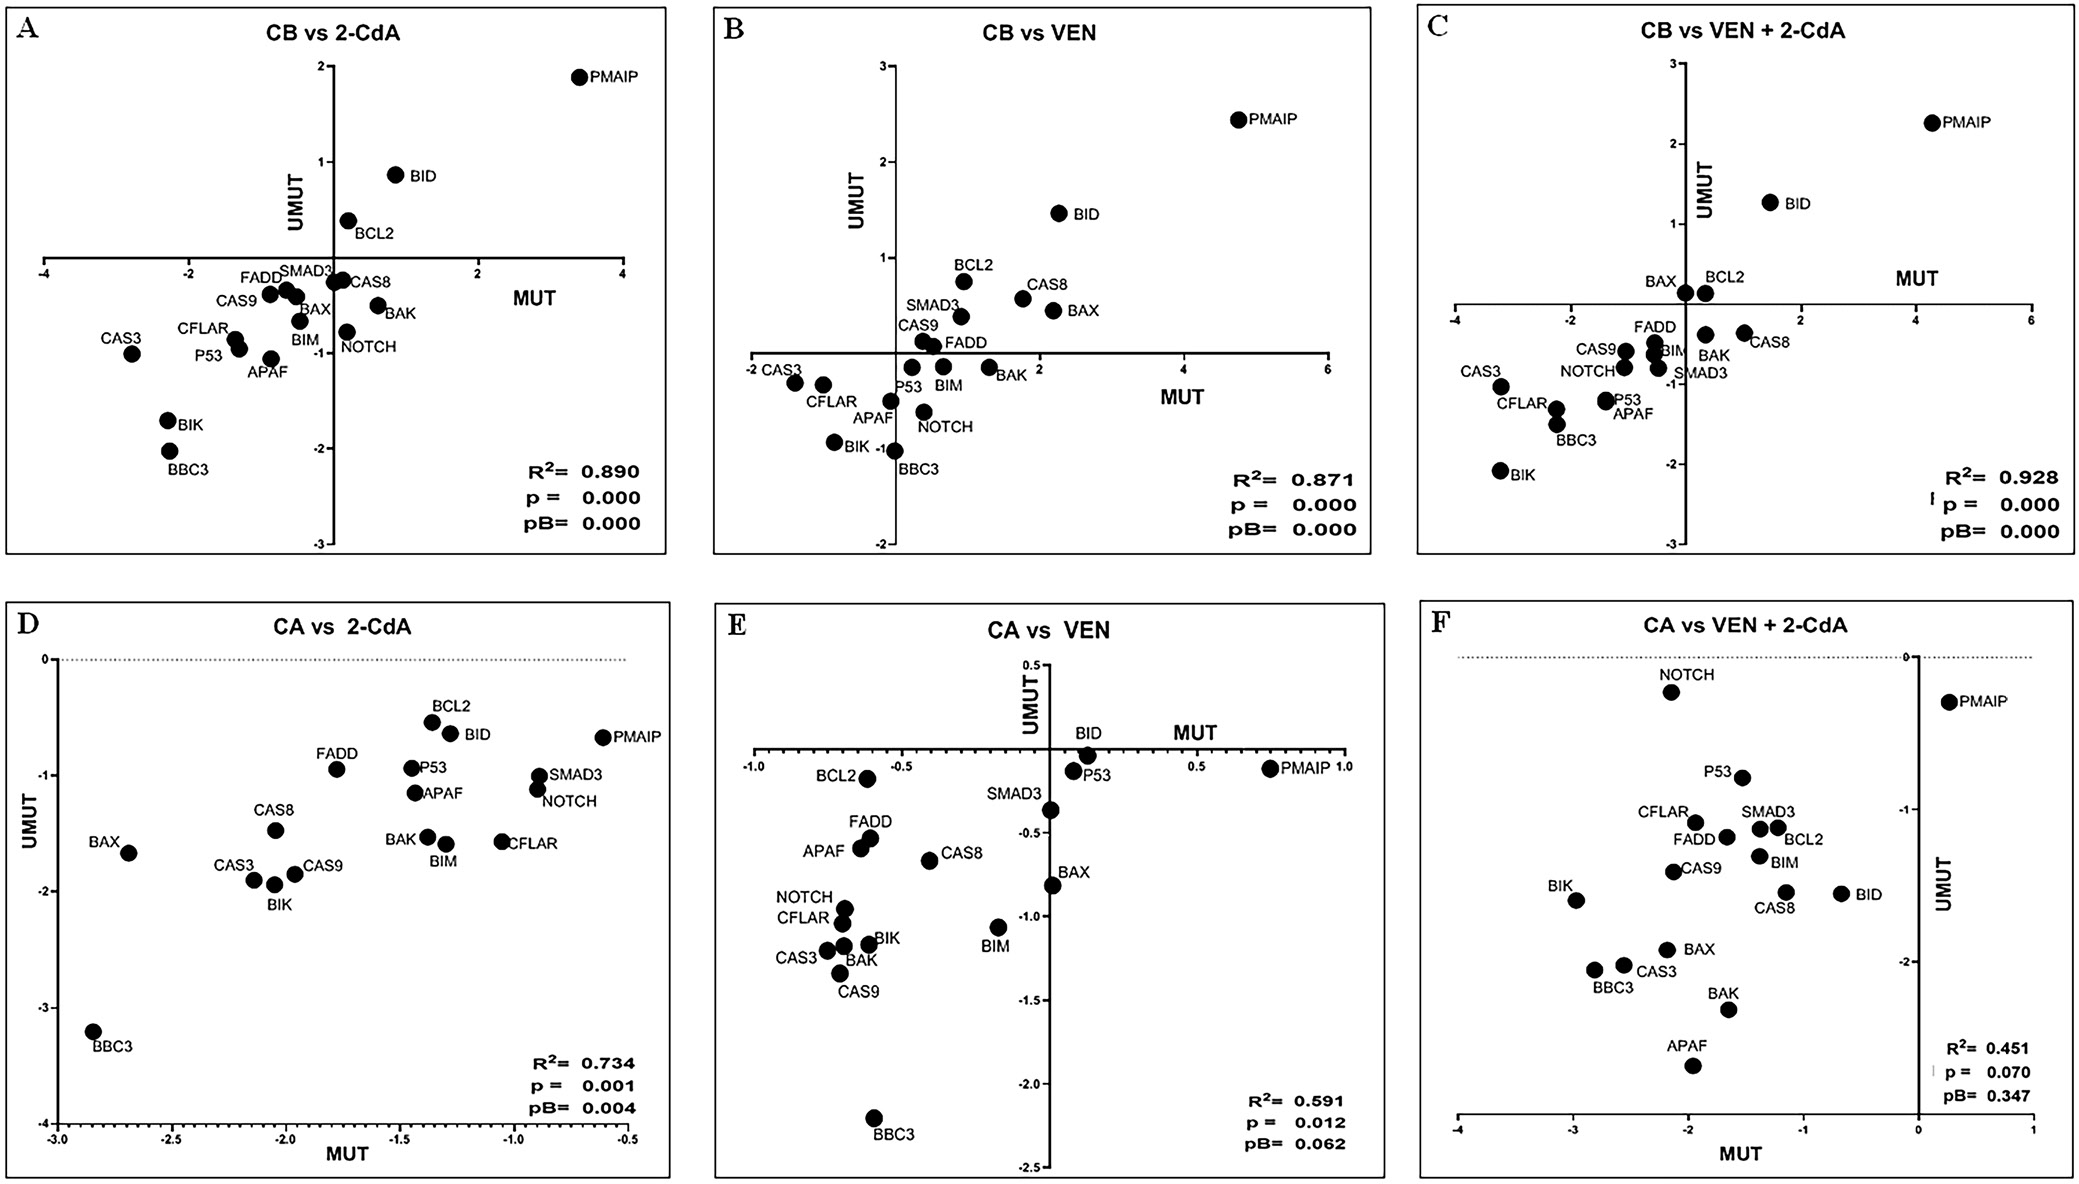
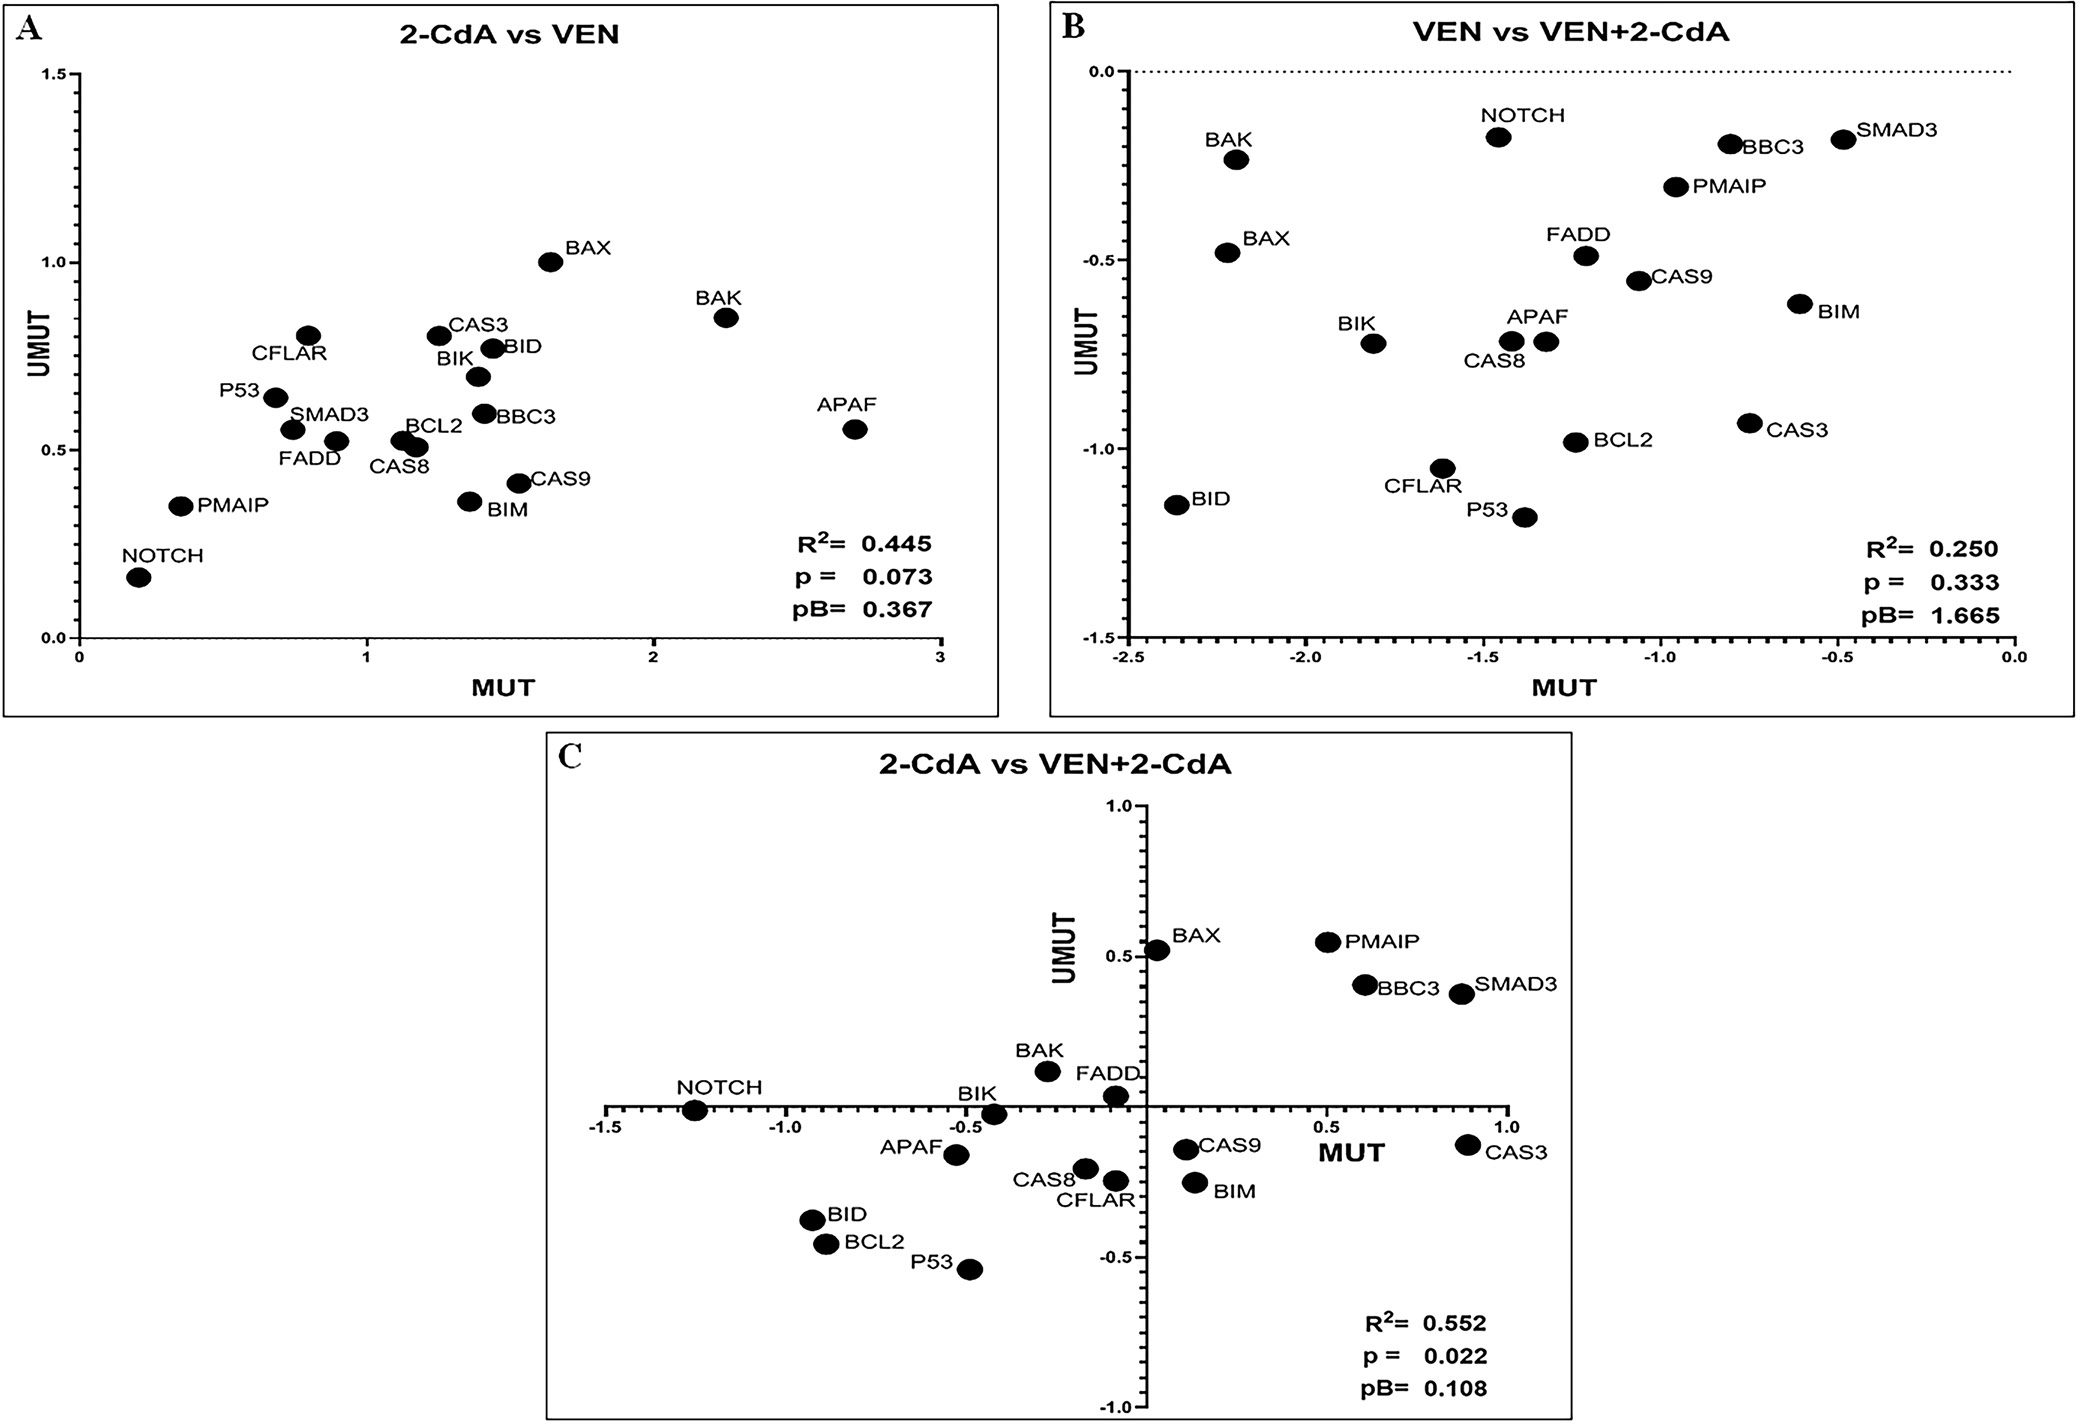
To confirm whether IGVH mutational status influences the effect of the drugs on the expression of the genes tested, a graph was generated for each drug/drugs combination, and Spearman’s correlation coefficient (r) was calculated for each experimental condition (n = 21). An r-value significantly different from 0 indicated that gene expression varied similarly under the experimental conditions in both mutated and unmutated cases – that is, IGHV mutational status did not appear to influence the genes’ responses to the drugs (Table 3). As shown in Figure 5 and Figure 6, r was found to be statistically significant in all experimental conditions except for the relationship between VEN+2-CdA and VEN. Statistical analysis included Bonferroni correction for multiple comparisons (5 comparisons).
Discussion
The inhibition of apoptosis is a central feature of CLL pathogenesis, leading to the abnormal prolongation of leukemic lymphocyte survival. One of the causes of this phenomenon is believed to be the overexpression of the antiapoptotic mitochondrial protein BCL2. The BCL2 family of proteins play a central role in the regulation of the mitochondrial pathway of apoptosis, thus exerting pro- or antiapoptotic activity. The family encompasses anti-apoptotic agents (BCL-2, BCL-XL, MCL-1, BCL-W, BFL-1), as well as BH3-only sensitizers (BAD, BIK, NOXA, HRK, BMF) proposed to sensitize the mitochondrial outer membrane (MOM) for permeabilization by opposing anti-apoptotic family members, BH3-only activators (BID, PUMA, BIM), which induce the MOM via BAX/BAK, and pro-apoptotic effectors (BAX, BAK).19, 20
Venetoclax has been found to be highly efficacious in CLL by inhibiting the anti-apoptotic protein BCL2. The mechanism of its action consists on direct binding to BCL-2 and displacing BIM from BCL2, which results in BAX/BAK homooligomerization. The BAX/BAK complex is responsible for the permeabilization of the mitochondrial outer membrane (MOM), the release of cytochrome c into the cytoplasm and the activation of caspase-mediated apoptosis.4, 13, 21, 22 Venetoclax is also effective in patients with a defective TP53 gene, and when combined with an anti-CD20 antibody or BTKi, it enables the eradication of MRD in a significant proportion of patients, an outcome associated with prolonged progression-free survival and overall survival.23
However, a number of patients eventually develop resistance to drugs targeting pro-survival intracellular pathways, including VEN. Therefore, there is a need to determine the optimal use of molecular targeted drugs, which may include their combination with other antileukemic agents. 2-CdA belongs to a class of purine analogues, such as fludarabine and pentostatin, which until recently were widely used in both frontline therapy and in relapsed/refractory CLL patients. It acts by incorporating into newly synthesized DNA and inhibiting its repair, thereby triggering the intrinsic, p53-dependent apoptotic pathway. The induction of BAX protein expression leads to the translocation of cytochrome c from the mitochondria to the cytoplasm, formation of the apoptosome and initiation of the caspase cascade. 2-CdA may also act independently of P53 by interacting directly with mitochondrial proteins, thus leading to the release of cytochrome c and formation of apoptosome or apoptosis-inducing factor (AIF). In such cases, chromatin condensation and DNA fragmentation are triggered without caspase activation.24, 25, 26 It has also been postulated to play a role in the extrinsic apoptosis pathway, but this remains controversial.27, 28
In our previous study involving 103 treatment-naïve CLL patients,13 we found that VEN, 2-CdA and their combination exhibited cytotoxicity and the ability to induce apoptosis. In addition, VEN and 2-CdA appeared to act synergistically, leading to an increased proportion of cells expressing proteins involved in both the intrinsic (BAX, PUMA, BIM, NOXA) and extrinsic (FADD) apoptotic pathways. We also observed a decrease of BCL-2 and increase of TP53 expression under the action of both drugs alone and in combination. To further investigate the mechanisms of action of VEN, 2-CdA and their combination on CLL cells, the present study examines their effects on a panel of genes known to be involved in the apoptosis of peripheral blood lymphocytes, using samples from 40 patients included in the previous study.13 The influence of VEN and 2-CdA alone and in combination on the expression of these genes was tested. We analyzed the genes encoding the proteins analyzed in the previous study, as well as 7 others encoding other factors playing a part in apoptosis. Thus, the present analysis included genes encoding the proteins positively involved in intrinsic (BAX, BBC3, BIM, P53, APAF-1, BAK, BID, BIK, caspase-3 and -9, PMAIP, SMAD3) and extrinsic (caspase-8 and FADD) pathways of apoptosis, as well as having antiapoptotic activity (BCL2, CFLAIR, NOTCH-1).
First, we assessed the expression of these genes in a 48-h drug-free culture and found that the culture conditions alone modulated gene expression in various ways, depending on the gene: The expression of 2 genes (BIDD and FADD) increased, 6 (BCL2, BAX, BIM, BAK, CFLAIR, PMAIP) decreased, and the others remained stable. To account for the effect of the culture itself, the values obtained after the 48-hour control culture were compared to those obtained from the 48-hour cultures with the drug treatments.
Incubation of CLL lymphocytes with VEN or 2-CdA led to increased expression of all tested genes except PMAIP1, which encodes the protein NOXA. All changes were statistically significant, except for BCL2 following VEN treatment and SMAD3 following 2-CdA treatment. Similarly, the combination of both drugs brought about a significant rise in the expression of all genes tested except SMAD3 (expression stable) and PMAIP (nonsignificant increase).
Therefore, it appears that both VEN and 2-CdA act on leukemic cells by stimulating the expression of genes encoding pro-apoptotic proteins. This may account for, at least partially, a rise in the percentage of leukemic cells expressing BAX, PUMA, BIM, P53, caspase-3, -8 and -9, and FADD, reported in our previous study.13 Among the proteins reported in that study, only NOXA demonstrated increased expression after exposure to VEN and/or 2-CdA, without any simultaneous rise in the expression of its corresponding gene. NOXA is a BH3-only member of the BCL-2 family, containing only the BH3 domain (i.e., neither BH1 nor BH2). Ectopically expressed NOXA localizes to mitochondria and interacts with antiapoptotic factors of BCL-2 family, which leads to the activation of caspase-9. It has been found to demonstrate P53-dependent induction in primary mouse cells after exposure to X-ray irradiation29; however, NOXA expression can also be independent of TP53. In contrast to BIM and PUMA, which can form complexes non-selectively with all pro-survival BCL-2 family proteins, NOXA binds selectively to Mcl-1 and to Bfl1/A1.30 The increase in the percentage of lymphocytes expressing NOXA observed following exposure to VEN and 2-CdA may be due to post-transcriptional regulation of its synthesis.
However, our previous observation that the percentage of BCL-2-expressing cells decreased, while BCL2 gene expression increased following treatment with 2-CdA and the 2-CdA+VEN combination, remains unexplained. Venetoclax alone also led to an increase in BCL2 expression, though this change was not statistically significant. First, it is important to note that only a weak correlation may exist between the previously obtained protein data and the current gene expression findings. The expression of the studied proteins was given only as a percentage of positive cells, without any estimation of their intracellular content. It seems then possible that increased expression of BCL-2 gene may be accompanied by a lower percentage of cells positive for that protein. It is all the more possible that BCL-2 is hyperexpressed in CLL, and that the median percentage of BCL-2-expressing cells in all samples, i.e., in both controls and treated cultures, was higher than 70%. In this setting, the estimation of intracellular BCL-2 content would have probably been a more accurate estimate of total BCL-2 protein expression than the percentage of BCL-2-positive cells.
It is also important to consider the complex nature of BCL2 gene regulation in CLL, as the underlying causes of its overexpression remain unclear. Both transcriptional and post-transcriptional mechanisms have been proposed to explain BCL2 overexpression, including promoter hypomethylation, loss of miR-15a and miR-16-1 due to 13q14 deletion, and overexpression of nucleolin, which promotes BCL2 mRNA stabilization.31, 32, 33, 34 Additionally, BCL2 expression is negatively regulated by TP53.35, 36, 37
The observed stimulation of the antiapoptotic gene BCL-2 expression by cytostatic drug 2-CdA, both alone and in combination with VEN, is probably a multifactorial phenomenon and one that is counter-balanced by the simultaneous stimulation of almost all the tested anti-survival genes. Notably, BCL2 expression was found to significantly decrease in the control culture (i.e., without drug treatment); therefore, its upregulation in response to all investigated drugs is unlikely to be a laboratory artifact.
Regarding the influence of different combinations of drugs on the expression of the genes tested, 2-CdA brought about a significantly higher rise in BAX and BBC3 expression compared to VEN. Of note, the 2-CdA+VEN combination significantly enhanced the expression of all genes except BCL2 and PMAIP1 compared to VEN alone. However, only 5 genes (TP53, BID, BIK, FADD, and SMAD3) were more strongly upregulated by 2-CdA+VEN than by 2-CdA alone. The combined drugs hence seem to potentialize VEN to a greater degree than 2-CdA with regard to its effect on apoptosis-involved gene expression.
Unfortunately, it was not possible to perform any direct comparison between the changes in gene expression between patients with mutated compared to non-mutated IGVH. Therefore, a series of graphs was generated, with 1 for each experimental condition (drug/drug combinations) (Figure 5, Figure 6). On each graph 1 gene was represented by a dot having the coordinates: X axis: log(FC) for mutated cases; and Y axis: log(FC) for unmutated cases. Spearman’s correlation coefficient (r) was then calculated for each experimental condition.
Therefore, our findings do not support the hypothesis that the impact of VEN and 2-CdA on the expression of the genes involved in the regulation of apoptosis is dependent on IGVH mutational status. However, it should be noted that although clinical trials have shown the VEN + anti-CD20 antibody combination to be effective in both patients with mutated and unmutated IGHV genes, those with the mutated form tend to exhibit more favorable survival outcomes.4, 38, 39 The impact of IGHV mutational status on the outcomes of CLL patients treated with 2-CdA-containing regimens has not been assessed.40, 41 The relationship between the effects of VEN and cytostatic drugs and IGHV mutational status should be further investigated in a larger patient cohort using more robust statistical methods.
Limitations
A key limitation of the study was the inability to perform statistical analysis comparing the expression levels of previously tested proteins with those of their corresponding genes.
Conclusions
To the best of our knowledge, this study is the first to evaluate the effects of 2-CdA and VEN on the expression of apoptosis-related genes in peripheral blood lymphocytes from patients with CLL. Our findings suggest that these drugs, whether used individually or in combination, exert their antileukemic effects not only by impairing DNA synthesis (2-CdA) or inhibiting BCL2 (VEN), but also by upregulating the expression of several genes encoding proteins essential for the execution of apoptosis. This effect of VEN is enhanced by its association with 2-CdA, which may justify further preclinical and clinical studies on its potential in the treatment of CLL.
Supplementary data
The supplementary materials are available at https://doi.org/10.5281/zenodo.14535775. The package includes the following files:
Supplementary Fig. 1. Results of the normality tests (Shapiro–Wilk test) regarding the expression of the studied genes in the individual research groups: in the control group (A), in the VEN group (B), in the 2-CdA group (C), and in the VEN + 2-CdA group (D).
Data availability
The datasets generated and/or analyzed during the current study are available from the corresponding author on reasonable request.
Consent for publication
Not applicable.
Use of AI and AI-assisted technologies
Not applicable.