Abstract
Background. Non-alcoholic fatty liver disease (NAFLD) is currently a public health problem that affects many people worldwide. New-generation dietary agents can contribute to disease control. Also, prediction of liver disease activity with serum markers is an important factor to reduce the need for liver biopsies.
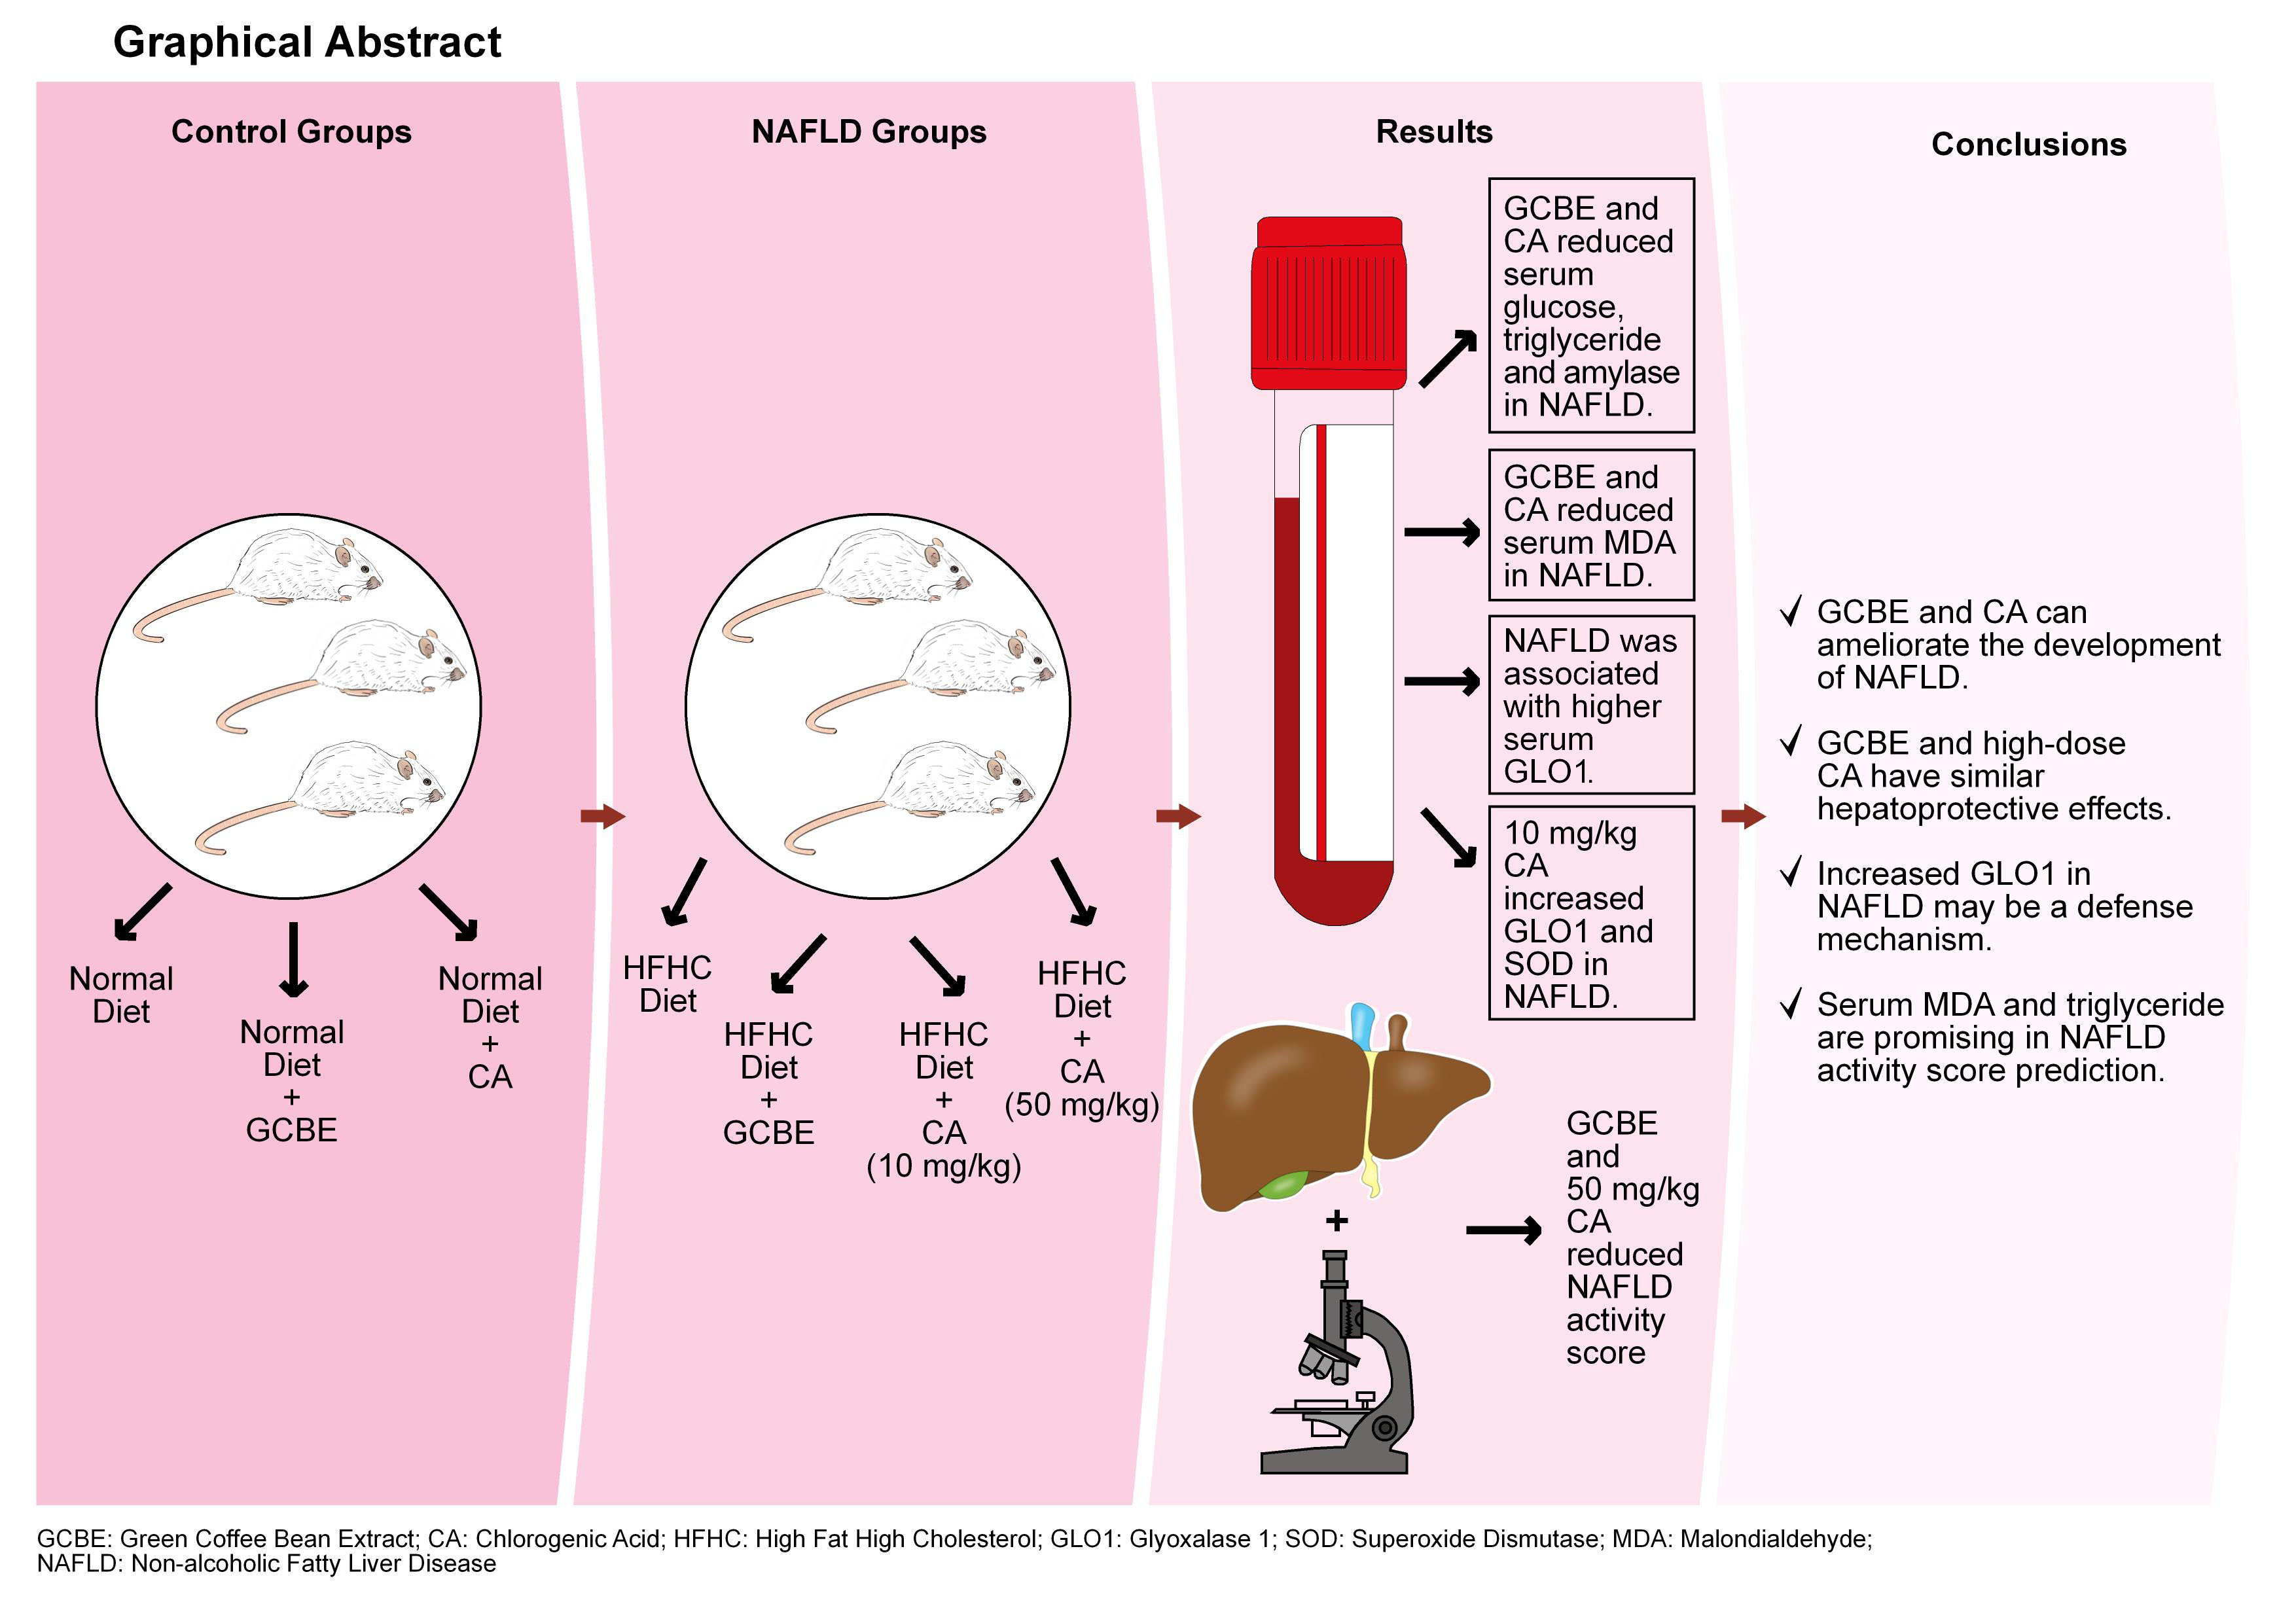
Objectives. The aim of this study was to compare the effects of 20 mg/kg green coffee bean extract (GCBE, standardized to 10 mg/kg chlorogenic acid), 10 mg/kg chlorogenic acid (CA) and 50 mg/kg CA on NAFLD activity score (NAS). We also aimed to create a NAS prediction model as an alternative to liver biopsies.
Materials and methods. Male Wistar rats were fed either a high-fat high-cholesterol (HFHC) diet (NAFLD groups, n = 32) or a normal diet (control groups, n = 24). Green coffee bean extract (20 mg/kg) and CA (10 mg/kg and 50 mg/kg) were given by daily oral gavage. At the end of the study, blood samples and liver tissues were collected. Biochemical parameters, glyoxalase 1 (GLO1) and oxidative stress parameters were analyzed. An experienced histopathologist graded NAS.
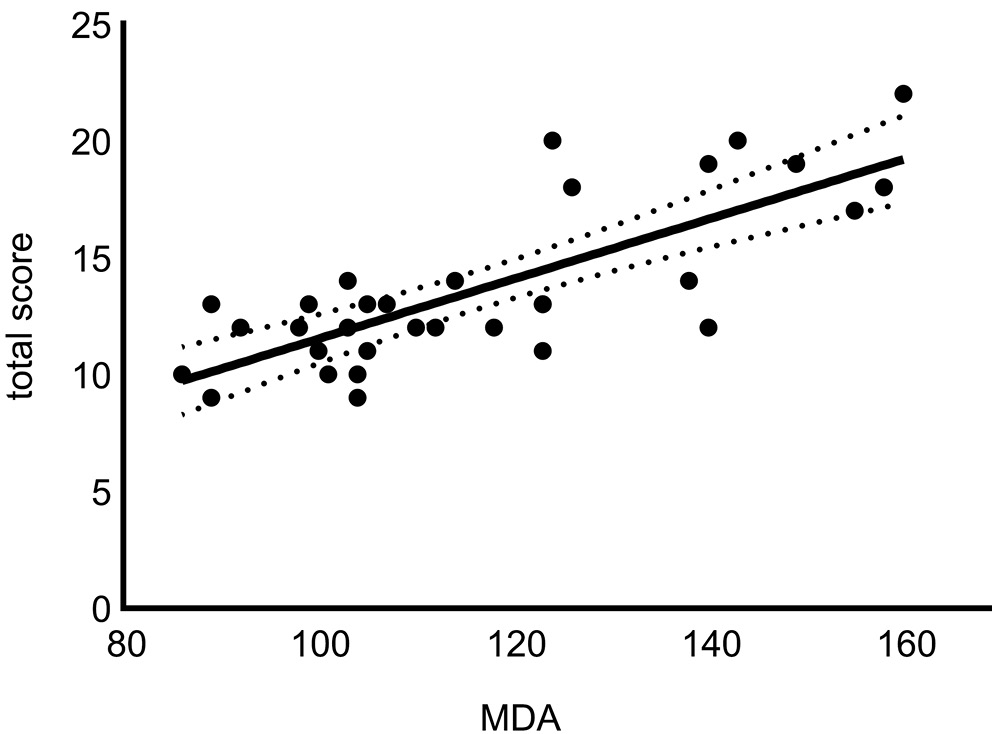
Results. Green coffee bean extract and 50 mg/kg CA significantly reduced NAS (p < 0.01 and p < 0.001, respectively). HFHC-diet induced NAFLD was associated with higher serum GLO1 levels (p < 0.001). Serum malondialdehyde (MDA) levels were positively correlated with NAS while GLO1 was negatively correlated with NAS (p < 0.001, r = 0.698; p < 0.05, r = –0.367, respectively). Serum MDA and triglyceride were found to be statistically significant in predicting NAS (p < 0.001).
Conclusions. Our study suggests that GCBE and CA can both ameliorate the development of NAFLD. Also, low-dose GCBE and high-dose CA showed similar hepatoprotective effects. Increased GLO1 in NAFLD may be a defense mechanism which is enhanced by GCBE and CA. Moreover, serum MDA and triglyceride levels are promising in NAS prediction.
Key words: malondialdehyde, oxidative stress, non-alcoholic fatty liver disease, chlorogenic acid
Background
Non-alcoholic fatty liver disease (NAFLD) is the most common chronic liver disease with a global prevalence of 25%.1 This high prevalence rate parallels the increased prevalence of obesity, type 2 diabetes and metabolic syndrome.2 Thus, current alarming state of NAFLD has raised the interest in hepatoprotective dietary agents for disease prevention.
In order to emphasize the importance of nutrition and metabolic risk factors in NAFLD, the terms “metabolic associated fatty liver disease” or “nutrition associated fatty liver disease” are also recommended instead of the term “non-alcoholic fatty liver disease”.3, 4 Nutrition modulates liver lipid metabolism through different epigenetic pathways. A high-fat diet is found to downregulate the expression of silent information regulator 2 homologue 1 protein (SIRT1).5 This downregulation increases the release of free fatty acids from mesenteric adipose tissue, which results in increased uptake of free fatty acids into the liver.5
Dicarbonyl stress is characterized by the excessive accumulation of reactive dicarbonyl metabolites.6, 7 These metabolites can easily interact with cellular proteins and DNA. Methylglyoxal is the most abundant dicarbonyl metabolite in humans.8 Glyoxalase 1 (GLO1) is the primary enzyme of the dicarbonyl stress pathway and plays an essential role in methylglyoxal detoxification.8 However, little is known about the role of GLO1 in NAFLD.
Screening patients with diabetes and metabolic syndrome who are at high risk of non-alcoholic steatohepatitis (NASH) is a key factor in NAFLD management. Predicting histological disease activity with serum parameters can decrease the number of liver biopsies. However, reliable serum markers are needed to detect early NASH.
Chlorogenic acid (CA) is the most abundant polyphenolic compound in green coffee beans.9 The roasting process, which is necessary to produce brown coffee beans, was found to reduce chlorogenic acid content of green coffee beans by up to 95%.9 Both chlorogenic acid and green coffee bean extract (GCBE) are well documented for their antidiabetic and hypolipidemic properties.10, 11
However, comparison of the effects of GCBE and CA on NAFLD is crucial to determine which one should be preferred primarily for disease prevention. Due to the lower cost and easier production methods of GCBE, the use of GCBE is more cost-effective than of CA.
Objectives
The aim of our study was to compare the effects of 20 mg/kg GCBE (standardized to 10 mg/kg chlorogenic acid) and 10 mg/kg CA on NAFLD activity score (NAS). In the literature, different doses of CA (ranging from 10 mg/kg to 50 mg/kg) are used in different rat models.12, 13 We also aimed to compare the effects of low-dose (10 mg/kg) and high-dose (50 mg/kg) CA on NAS in NAFLD. Additionally, we developed a regression model for the prediction of NAS with serum parameters to address the need for reliable serum markers to detect early NASH.
Materials and methods
Animals
All animal experiments were performed in accordance with the Animal Research: Reporting of In Vivo Experiments (ARRIVE) guidelines. Kobay Technology Co. Ltd. (Ankara, Turkey) provided 56 healthy male Wistar rats (13-week-old, 300–380 g).
Animal maintenance with 4 animals per cage was conducted in Experimental Animals Research Laboratory of Ankara University. Animals were maintained on a 12-h light–dark cycle at room temperature (22–24°C) with free access to food and water. No animals died during experimental protocols. At the end of the study, rats were anesthetized with ketamine (90 mg/kg) and xylazine (10 mg/kg). Intracardiac blood was collected under anesthesia prior to the removal of organs and tissues. Animals were sacrificed by cervical dislocation. Blood samples and liver tissues were collected after 12 h of fasting.
The study was approved by the Animal Ethics Committee of Ankara University to ensure ethical and humane treatment of the animals (ethical approval ID: 2019-19-77, issued on October 16, 2019).
Grouping and modeling
Animals were divided into 7 groups (n = 8). Sample size was decided according to previous studies.14 Simple randomization (table of random numbers) was used for group allocation. Groups 1, 2 and 3 were fed a normal diet for 10 weeks. Normal diet was composed of 64 g carbohydrates (70% of total calories), 4 g fat (10 % of total calories) and 23 g protein (20 % of total calories) per 100 g of diet (Table 1). Group 1 was given no dietary agent. Groups 2 and 3 were given 20 mg/kg GCBE and 10 mg/kg CA, respectively.
Groups 4, 5, 6, and 7 were fed a high-fat high cholesterol (HFHC) diet (cat. No. D09052204; Research Diets, New Brunswick, USA) to induce NASH.12 The HFHC diet was composed of 19 g carbohydrates (15% of total calories), 39 g fat (65% of total calories), 27 g protein (20% of total calories), 2 g cholesterol, and 0.5 g cholic acid per 100 g of diet. Group 4 was given no dietary agent. Groups 5, 6 and 7 were given 20 mg/kg GCBE, 10 mg/kg CA and 50 mg/kg CA, respectively. All dietary agents were given by daily oral gavage.
Reagents
Green coffee bean extract was obtained from Sepe Natural Organic Products Co. Ltd (İzmir, Turkey). It was extracted from Coffea arabica L. beans. Ethanol and water were used as solvents in the extraction procedure. The GCBE in our study was standardized to 50% chlorogenic acid using high performance liquid chromatography method (a dose of 20 mg/kg GCBE contained 10 mg/kg CA). Chlorogenic acid (purity ≥97.5%) was obtained from Acros Organics (Geel, Belgium). Other chemicals were obtained from Sigma–Aldrich (St. Louis, USA).
Serum biochemistry
Serum glucose, alanine aminotransferase (ALT), aspartate aminotransferase (AST), amylase, lipase, total cholesterol, triglyceride, and high-density lipoprotein cholesterol (HDL-C) were analyzed with Beckman Coulter AU5800 autoanalyzer (Beckman Coulter, Inc., Hialeah, USA).
Serum superoxide dismutase (SOD) activity assay was based on the principle of inhibition of nitroblue tetrazolium reduction.15 Malondialdehyde (MDA) levels were analyzed via thiobarbituric acid reaction.16 The method developed by Aebi et al. was used for the measurement of catalase activity.17 Glutathione peroxidase (GSH-PX) activity was measured using the method of Paglia et al.18
Histopathological analysis
Liver tissue samples were fixed and embedded in paraffin blocks. Four-micrometer sections were prepared using a Leica RM 2125 RT microtome (Leica Biosystems, Richmond, USA). After deparaffinization, samples were assessed using both hematoxylin & eosin (H&E) and Masson trichrome staining. An experienced histopathologist graded the NAS using the scoring system designed and validated by Kleiner et al.19
For electron microscopic analysis, liver tissues of rats from each group were fixed in phosphate-buffered glutaraldehyde (4%) (pH 7.4) at 4°C for 24 h and post-fixed in phosphate-buffered osmium tetroxide (1%) for 4 h, dehydrated through an ethanol series, and embedded in araldite-epoxy resin. Ultrathin sections were cut using diamond knives and a Leica Reichert Ultracut S ultramicrotome (Leica Biosystems). An 800-nm semithin section was prepared through the liver and stained with toluidine blue dye. Then, 80-nm thin sections were obtained from a selected area of the tissue samples defined as the semithin section, and these sections were stained with uranyl acetate and lead citrate. The ultrastructure of the liver was examined under a Hitachi HT7800 transmission electron microscope (Hitachi Corp., Tokyo, Japan).
Statistical analyses
All experiments were performed in duplicate, and statistical analysis was performed using IBM SPSS v. 21.0 software (IBM Corp., Armonk, USA). Since n = 8 per group nonparametric tests were used. Mann–Whitney (M–W) U test was used to analyze NASH model characteristics (group 1 vs group 4). Kruskal–Wallis (K–W) test followed by Dunn’s multiple comparison test was used to compare animal characteristics, serum parameters and NAS within normal rat chow groups and within NAFLD groups. Spearman’s test was used for correlation analysis between serum parameters and NAS. Also, a linear regression analysis was performed for NAS prediction in NAFLD groups (n = 32). Statistical significance was assumed at p < 0.05.
Results
Animal characteristics and serum biochemistry
Initial and final body weights were similar in normal rat chow and NAFLD groups. Both terminal body weight and weight gain during the study were higher in group 4 compared to group 1 (Table 2; M–W U test; p = 0.038, U = 52; p = 0.050, U = 51, respectively). Group 4 had higher terminal liver weight than group 1 (Table 2; M–W U test; p < 0.001, U = 64). Also, both group 2 and group 4 had a higher final liver weight/final body weight ratio than group 1 (Table 2; K–W test followed by Dunn’s multiple comparison, H (2.00) = 8.07, p = 0.016; M–W U test; p < 0.001, U = 64, respectively).
As seen in Table 3, a comparison between group 1 and group 4 showed that HFHC diet-induced NASH caused an increase in serum glucose, ALT, AST, amylase, lipase, triglyceride, total cholesterol, and HDL-C (M–W U test; p = 0.002, U = 60 for triglyceride and p < 0.001, U = 64 for others). In the NAFLD groups, GCBE was linked to a substantial decrease in serum glucose, triglyceride and amylase levels (Table 3; K–W test followed by Dunn’s multiple comparison, H (3.00) = 14.76, p = 0.003, H (3.00) = 16.87, p = 0.001, H (3.00) = 18.30, p < 0.001, respectively). Furthermore, the administration of 10 mg/kg of CA reduced serum glucose, triglyceride and amylase levels (Table 3; K–W test followed by Dunn’s multiple comparison, H (3.00) = 14.76, p = 0.009, H (3.00) = 16.87, p = 0.009, H (3.00) = 18.30, p < 0.001, respectively). Also, 50 mg/kg chlorogenic acid reduced serum triglyceride levels in NAFLD (Table 3; K–W test followed by Dunn’s multiple comparison, H (3.00) = 16.87, p = 0.037).
Due to more advanced cirrhosis, group 4 had lower ALT levels compared to groups 6 and 7 (Table 3; K–W test followed by Dunn’s multiple comparison, H (3.00) = 13.17, p = 0.007, p = 0.016, respectively) and lower AST levels compared to groups 6 and 7 (Table 3; K–W test followed by Dunn’s multiple comparison, H (3.00) = 11.57, p = 0.010, p = 0.043, respectively).
In contrast to NAFLD groups, GCBE and CA administrations resulted in significantly higher serum glucose in normal diet-fed groups (Table 3; K–W test followed by Dunn’s multiple comparison, H (2.00) = 13.69, p = 0.002, p = 0.009, respectively). Chlorogenic acid also caused higher serum total cholesterol levels (Table 3; K–W test followed by Dunn’s multiple comparison, H (2.00) = 9.48, p = 0.012).
Furthermore, GCBE administration increased ALT and amylase levels in normal rat chow groups (Table 3; K–W test followed by Dunn’s multiple comparison, H (2.00) = 8.14, p = 0.013, H (2.00) = 12.06, p = 0.002, respectively).
Glyoxalase 1 and oxidative stress
As shown in Table 4; NAFLD was associated with higher serum GLO1 levels (group 4 vs group 1, M–W U test; p < 0.001, U = 64). In normal rat chow groups, GCBE administration reduced GLO1 levels (Table 4; K–W test followed by Dunn’s multiple comparison, H (2.00) = 6.48, p = 0.036). In NAFLD groups, 10 mg/kg CA increased GLO1 levels (Table 4; K–W test followed by Dunn’s multiple comparison, H (3.00) = 8.30, p = 0.036).
Serum catalase activity was suppressed in group 4 compared to group 1 (Table 4; M–W U test; p = 0.022, U = 11) Also, NAFLD was associated with a reduction in serum MDA levels (group 4 vs group 1, M–W U test; p < 0.001, U = 64).
Administrations of both GCBE and 50 mg/kg CA caused a reduction in MDA levels in NAFLD groups (Table 4; K–W test followed by Dunn’s multiple comparison, H (3.00) = 19.58, p = 0.017, p < 0.001, respectively). In addition, GCBE administration significantly reduced MDA level in normal rat chow groups (Table 4; K–W test followed by Dunn’s multiple comparison, H (2.00) = 20.48, p < 0.001).
Non-alcoholic fatty liver disease resulted in a significant decrease in serum superoxide SOD levels, as demonstrated in Table 4 (group 4 vs group 1). In NAFLD groups 10 mg/kg CA significantly increased SOD (Table 4; K–W test followed by Dunn’s multiple comparison, H (3.00) = 17.57, p = 0.004). In normal rat chow groups, both GCBE and CA decreased SOD (Table 4; K–W test followed by Dunn’s multiple comparison, H (2.00) = 9.35, p = 0.007).
Liver histopathology
The NAFLD activity score groups histological features into 5 categories: steatosis, fibrosis, inflammation, hepatocellular injury, and other findings (Mallory’s hyaline and glycogenated nuclei). The NAFLD activity score was 0 for all normal rat chow-fed groups and NAFLD was excluded for all. However, all animals fed the HFHC diet were diagnosed with NAFLD (total NAS ranged from 9 to 22; Table 5). Both GCBE and 50 mg/kg CA significantly reduced total NAS (Table 5; K–W test followed by Dunn’s multiple comparison, H (3.00) = 20.49, p = 0.002, p < 0.001, respectively). We observed a significant reduction in inflammation score with 10 mg/kg CA and 50 mg/kg CA (Table 5; K–W test followed by Dunn’s multiple comparison, H (3.00) = 9.65, p = 0.005, p = 0.038, respectively). The administration of GCBE, 10 mg/kg CA, and 50 mg/kg CA resulted in a decrease in liver cell injury scores (Table 5; K–W test followed by Dunn’s multiple comparison, H (3.00) = 19.84, p = 0.001, p = 0.004, p = 0.001, respectively). It was determined that GCBE, 10 mg/kg CA and 50 mg/kg CA all led to a decrease in other findings scores (Table 5; K–W test followed by Dunn’s multiple comparison, H (3.00) = 31.00, p < 0.001 for all).
As shown in Figure 1, light microscopic analysis showed that GCBE and 50 mg/kg CA both reduced hepatocyte ballooning. Additionally, 50 mg/kg CA reduced steatosis and inflammation. The presence of structurally normal hepatocytes was also noteworthy in both groups.
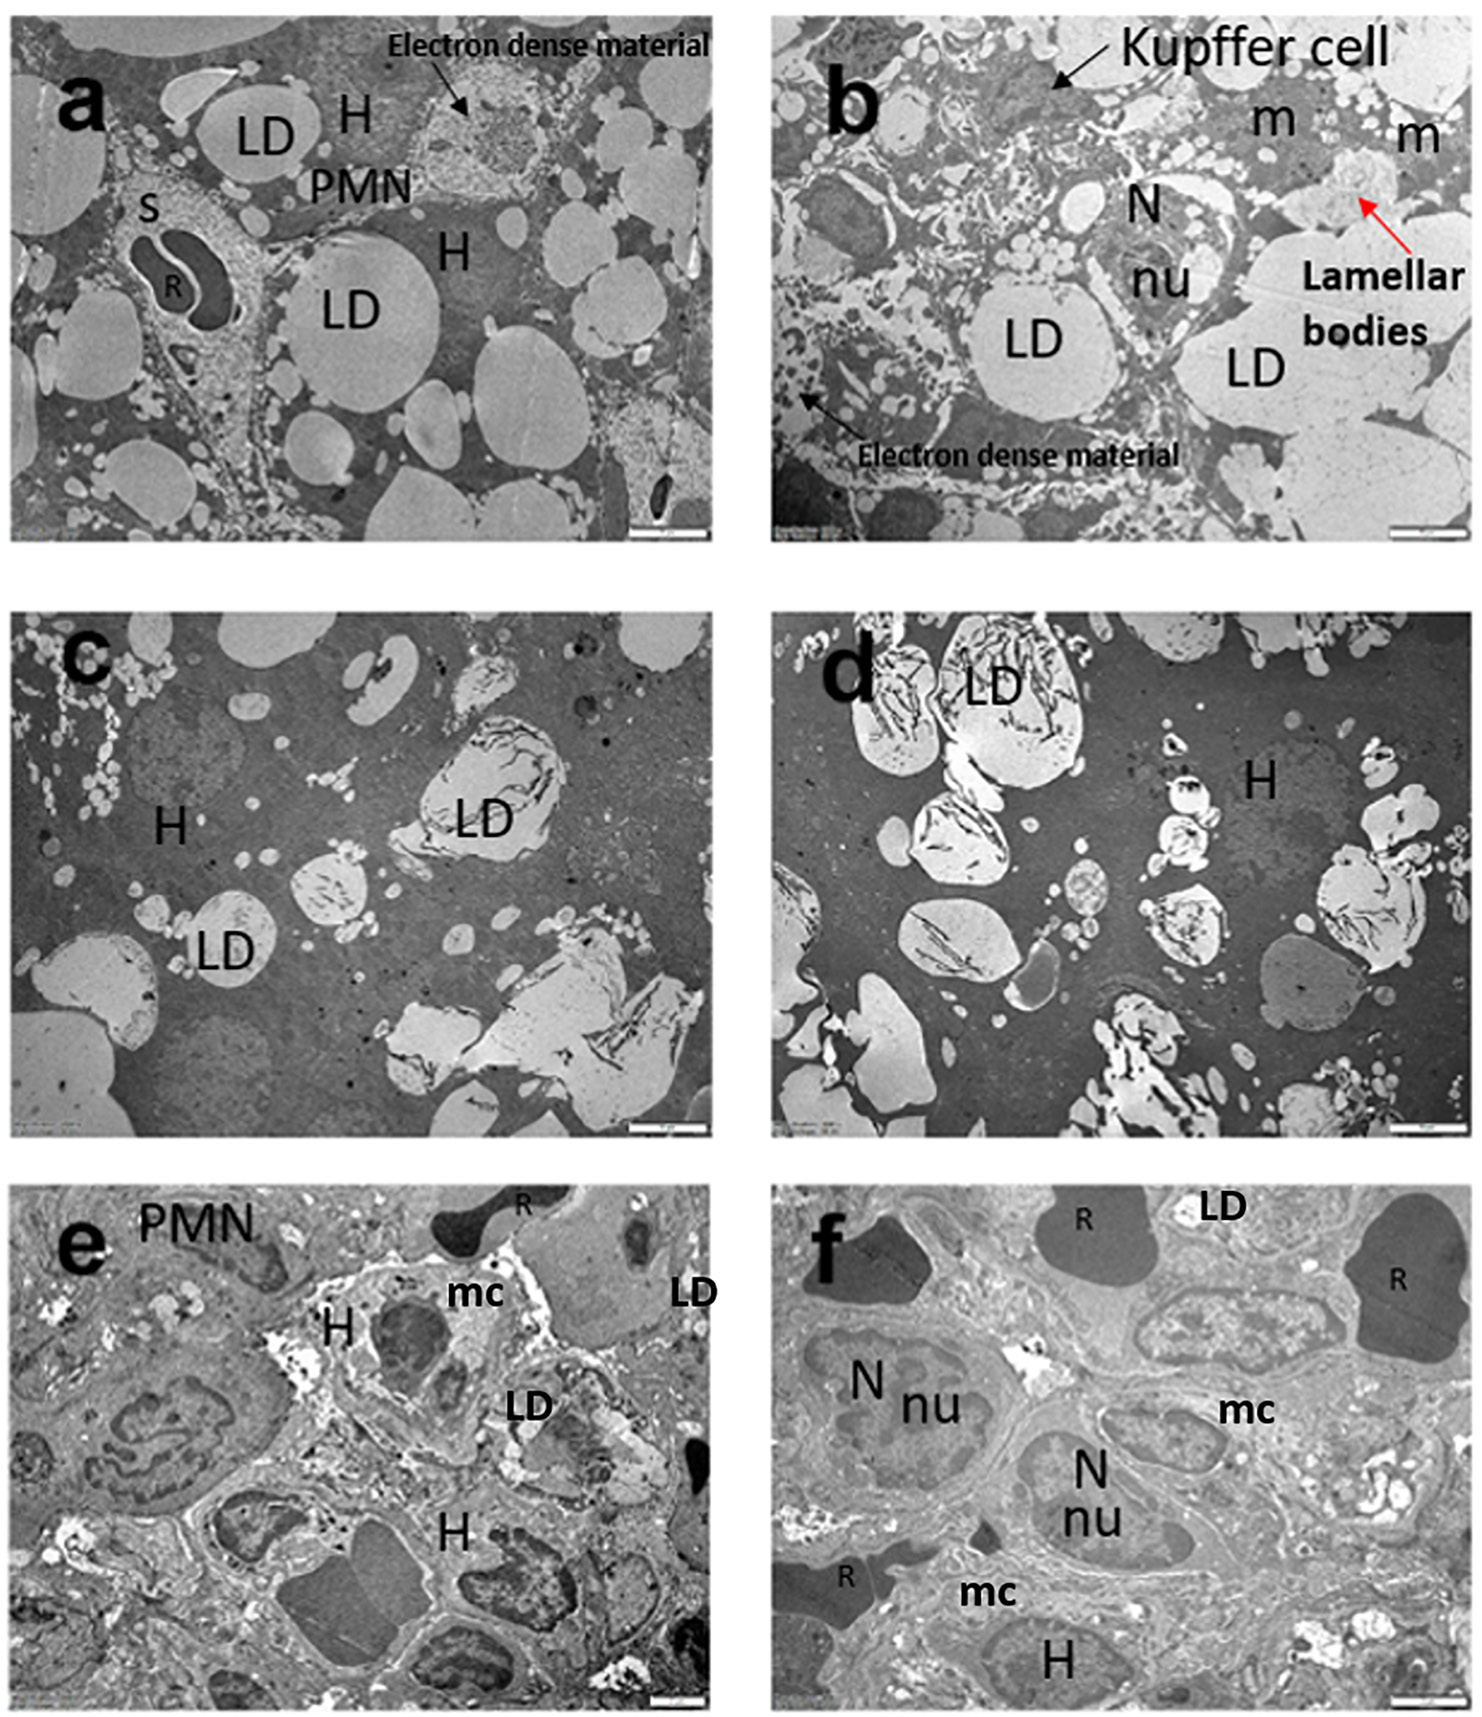
As shown in Figure 2, ultrastructural micrographs of liver tissue belonging to the control group demonstrated normal hepatic cells. Sections of NASH groups showed macrovesicular and microvesicular lipid droplets, electron-dense bodies and irregular cell morphology, indicating the disruption of the cellular structure. In addition, inflammatory cells, particularly polymorphonuclear granulocytes and erythrocytes, were present around large oil droplets. It was observed that hepatocyte degeneration was similar in GCBE and 10 mg/kg CA groups, but the diameters of lipid droplets were smaller in both groups than in the NASH group.
Administration of 50 mg/kg CA was associated with NASH amelioration in terms of cell morphology and cytoplasmic structure in electron microscopic examination. Moreover, the number of lipid droplets decreased in this group compared to group 4 (Figure 2). Additionally, the cell morphology and mitochondrial cristae inner contours were more regular.
Predicting NAS
As shown in Table 6, glucose, triglyceride, amylase, and MDA were positively correlated while ALT, AST and GLO1 were negatively correlated with NAS. According to linear regression analysis, serum MDA and serum triglyceride were found to be statistically significant in predicting NAS (R2: 0.758, p < 0.001) (linear regression curves are shown in Figure 3, Figure 4)
Discussion
In our study, the administration of GCBE and CA was associated with reductions in serum glucose, triglyceride and amylase levels in the NAFLD groups. The hypoglycemic and lipid-lowering effects of GCBE and CA have been shown in several studies.10, 11 However, the decrease in amylase levels is surprising because little is known about the protective effect of these dietary agents on the pancreas.
In the normal rat chow groups administrations of GCBE and CA (10 mg/kg) increased serum glucose levels compared to the control. Furthermore, GCBE administration increased ALT and amylase levels. These observations raise intriguing questions about the risks associated with the administration of GCBE and CA by healthy individuals without NAFLD.
In HFHC diet-fed groups, intestinal absorption of polyphenols is expected to be more than in normal diet-fed groups, as the absorption of polyphenols increases in the lipid medium of the intestine.20 Also, polyphenols can bind metal ions, which causes a risk of micromineral deficiency.21 Micromineral deficiency was found to be related to a decrease in antioxidant enzyme activity.22 The increased amount of unabsorbed intestinal polyphenols and increased oxidative stress can help understand the adverse effects of GCBE and CA in the normal diet-fed groups.
In our study, HFHC diet induced NASH was associated with higher serum GLO1 levels. In NAFLD groups, the administration of both GCBE and CA increased GLO1 but it was statistically significant only in 10 mg/kg chlorogenic acid administration. Earlier observations suggest that increased GLO1 in obese individuals may be a defense mechanism against increased dicarbonyl stress.7 Therefore, GLO1 may be one of the possible mechanisms by which GCBE and CA can ameliorate NAFLD.
The present study demonstrated a decrease in serum catalase and SOD activities as a consequence of NAFLD. Our finding aligns with the study by Swiderska et al.,23 who found that serum catalase activity was statistically lower in the NAFLD group compared to the control. In our study administration of 10 mg/kg CA in the NAFLD groups led to increased serum SOD levels. In a study by Wang et al., CA was found to increase plasma SOD activity in rats, too.24
It has been established that there is a correlation between NAFLD and a decrease in serum MDA levels. Anti-MDA antibodies in the serum of advanced NAFLD patients were reported in earlier studies.25 In our study, lower serum MDA levels in NAFLD groups may be caused by anti-MDA antibodies, which can bind to serum MDA and interfere with our MDA measurement. The administrations of both GCBE and CA decreased serum MDA in NAFLD groups. The suppression of serum MDA with CA and GCBE can refer to a peroxidation inhibitory effect of these dietary agents.
In our study, GCBE and 2 different doses of chlorogenic acid all reduced NAS. However, only GCBE and 50 mg/kg CA administrations caused a significant reduction. Hence, the hepatoprotective effect of 20 mg/kg GCBE containing 50% chlorogenic acid was more significant than 10 mg/kg purified chlorogenic acid. Green coffee also contains different polyphenols such as feruloylquinic acids, dicaffeoylquinic acids and cinnamoylquinic acids.9 These different polyphenols may play a role in making GCBE more effective than pure chlorogenic acid.
Additionally, serum MDA and triglyceride were found to be statistically significant for NAS prediction. In an earlier study it was shown that the majority of fatty acids used for triacylglycerol synthesis in the liver of NAFLD patients originated from the blood circulation.26 Hence, serum dyslipidemia markers are promising in NAS prediction.
Limitations
Our study had some limitations. Several differences between humans and animals, in terms of physiology, anatomy and metabolism, make it difficult to apply data derived from animal studies to human conditions. However, the findings of our study provide important insight into human studies. Another limitation is that, as a result of our study design, we were only able to evaluate the disease-preventive effects of CA and GCBE. Additional studies investigating the therapeutic effect can also contribute to our knowledge.
Conclusions
The effects of GCBE and CA on the NAFLD population and on healthy individuals are different; especially their effect on healthy individuals is not clearly understood, necessitating further studies. Green coffee bean extract and CA can reduce amylase levels in NAFLD. This finding may indicate their ameliorative effect on pancreatic damage in NAFLD. Green coffee bean extract and CA increase GLO1 in NAFLD. Increased GLO1 may be one of the possible mechanisms to explain their hepatoprotective effect. Both 20 mg/kg GCBE and 50 mg/kg CA can be used in the prevention of NAFLD. Since they have similar hepatoprotective effects, GCBE can be preferred primarily as a more cost-effective dietary agent. Serum MDA and triglyceride are promising in NAS prediction. The use of dyslipidemia markers can reduce the need for liver biopsies.
Supplementary data
The supplementary materials are available at https://doi.org/10.5281/zenodo.13954275. The package includes the following files:
Supplementary Table 1. Dunn’s test results for Table 2.
Supplementary Table 2. Dunn’s test results for Table 3.
Supplementary Table 3. Dunn’s test results for Table 4.
Supplementary Table 4. Dunn’s test results for Table 5.
Data availability
The datasets generated and/or analyzed during the current study are available from the corresponding author on reasonable request.
Consent for publication
Not applicable.
Use of AI and AI-assisted technologies
Not applicable.