Abstract
Background. Turmeric and boswellia supplements have gained popularity for their anti-inflammatory and antioxidant properties. It is important to critically assess the safety of such supplements for prolonged use.
Objectives. To assess the safety and tolerability of turmeric-boswellia-sesame oil formulation (TBSF) in healthy human volunteers.
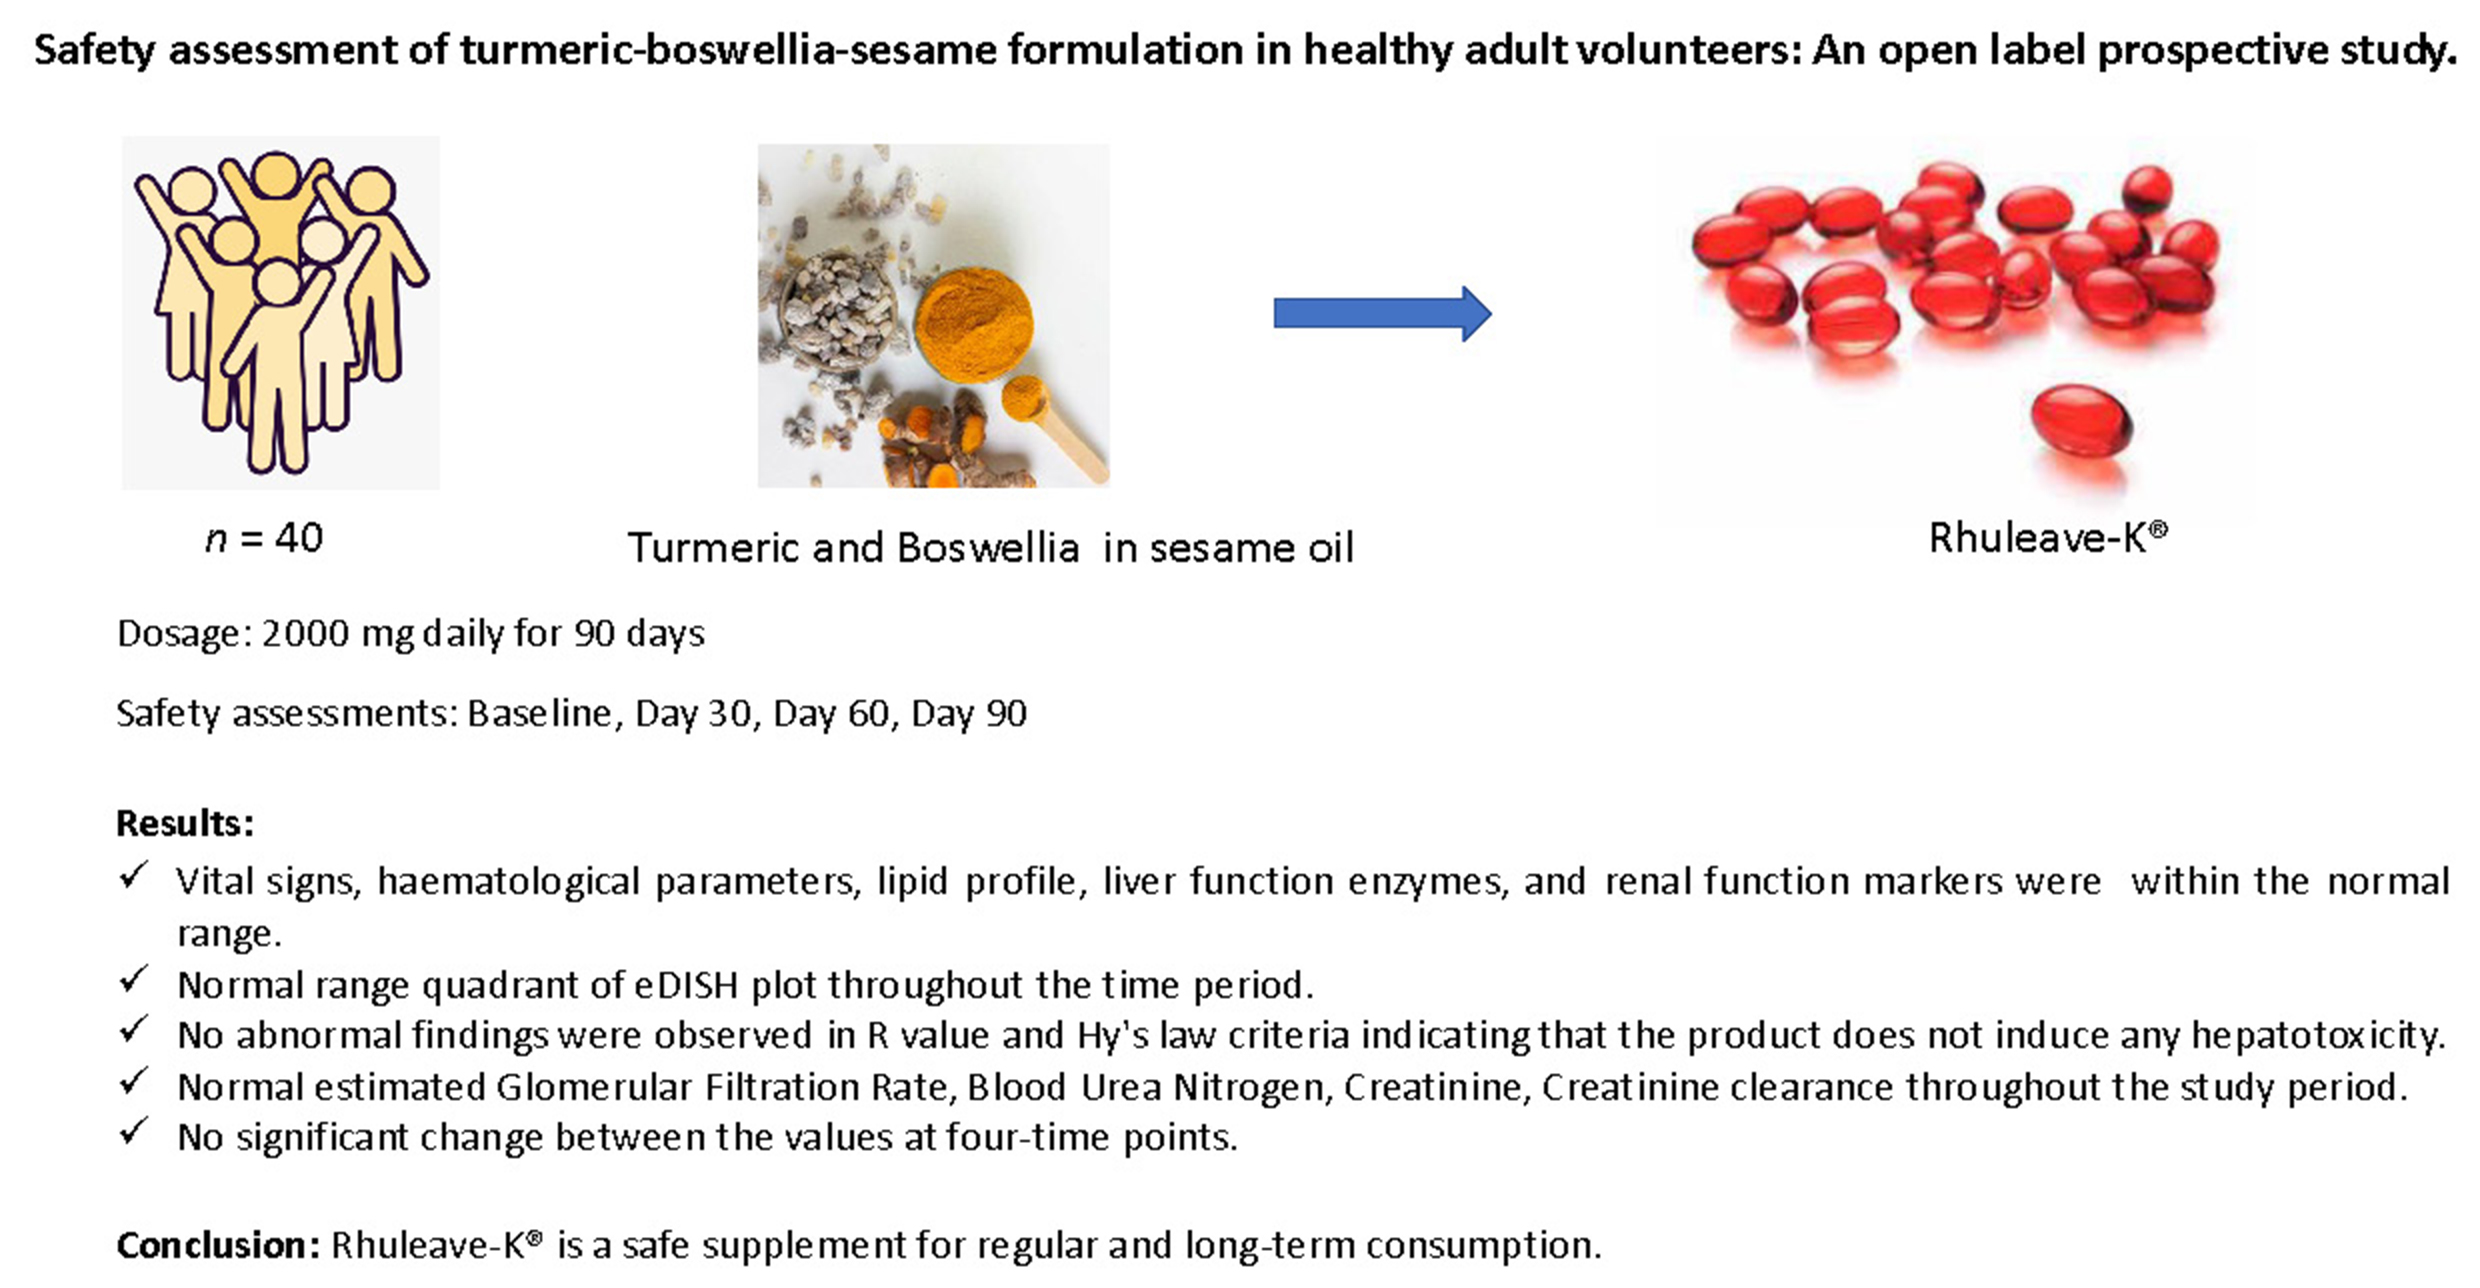
Materials and methods. Forty participants were supplemented with TBSF at a dose of 2,000 mg daily for 90 days. Safety assessments were performed at baseline, as well as on day 30, 60 and 90. Adverse events were monitored throughout the study period. Any evidence of hepatotoxicity injury or drug induced liver injury (DILI) was assessed using R value (R ratio/R factor), which is a relative pattern of liver enzymes. Additionally, Hy’s law criteria, based on liver enzymes and bilirubin levels, were employed, along with an evaluation of drug-induced serious hepatotoxicity (eDISH) plot. The neutrophil-to-lymphocyte ratio (NLR) and platelet-to-lymphocyte ratio (PLR) were calculated, as these values are relevant to the safety of the intervention.
Results. The study found that TBSF supplementation did not cause any adverse effects or clinically significant variations in vital signs, hematological parameters, lipid profile, liver function enzymes, and renal function markers, and all were within the normal range after 90 days of TBSF supplementation. Platelet-to-lymphocyte ratio and NLR did not change significantly and were within the normal range. All the participants when plotted were in the normal range quadrant of the eDISH plot throughout the study period. No abnormal findings were observed in R value and Hy’s law criteria, indicating that TBSF does not induce any hepatotoxicity. The present study showed a normal estimated glomerular filtration rate (eGFR), blood urea nitrogen (BUN), creatinine (Cr), Cr clearance, and BUN/Cr ratio throughout the study period. There was no significant change between these values at 4 abovementioned time points.
Conclusions. The study findings suggest that TBSF is a safe supplement for regular and long-term consumption.
Key words: safety, turmeric, dietary supplement, sesame, boswellia
Background
Nutraceuticals are bioactive compounds derived from plant sources that provide nutritional and medicinal benefits. The growing consciousness among consumers regarding potential health benefits and the necessity for enhanced wellness, especially in the post-pandemic era, highlights the importance of nutraceuticals. Furthermore, their safety, effectiveness and affordability contribute to their growing popularity. Nutraceuticals are easily accessible and widely available, making them attractive to a broad range of consumers. However, concerns regarding their safety and efficacy remain a topic of significant interest and investigation.
The use of natural products, such as turmeric and boswellia, for their anti-inflammatory properties has gained significant attention in musculoskeletal health.1 While turmeric and boswellia have exhibited effectiveness in addressing these concerns over time, the challenge lies in the scarcity of natural products capable of delivering swift pain relief.2, 3 The experience of joint pain or muscle soreness is distressing and has a significant impact on a person’s quality of life. Therefore, timely management and alleviation of inflammation is crucial to improving the overall wellbeing and quality of life of those affected. Promptly addressing the muscle or joint discomfort can minimize suffering, enable individuals to perform daily activities, and result a sense of comfort and wellbeing. Despite the growing popularity of natural products, more research and investigation is needed in this area. The unique formulation (Rhuleave-K) presented in this study combines turmeric, boswellia and sesame seed oil, and its integration with innovative technology represents a remarkable breakthrough in the field of natural products.
Turmeric and boswellia extract have been extensively researched for their effectiveness in managing inflammation, but the time required to see noticeable effects can be a challenge. However, the solubilization of turmeric and boswellia extracts in sesame seed oil sets Rhuleave-K apart from conventional physical blends. Given the significantly enhanced efficacy of Rhuleave-K, it is important to thoroughly evaluate its safety in humans, and this study is the first of its kind to address this aspect.
Objectives
The objective of the study was to assess the safety and tolerability of a novel formulation consisting of turmeric, boswellia and sesame oil (TBSF) integrated using SPEEDTECH technology (Rhuleave-K, Arjuna Natural Pvt. Ltd., Kochi, India), administered at a dosage of 2,000 mg per day over a 90-day period, in healthy adult volunteers. This objective of this study was to conduct comprehensive safety evaluations, including hematological, biochemical, radiological, and urine analyses, to provide a valuable insight into the potential for long-term clinical use of TBSF.
Materials and methods
The research protocol and associated documents underwent review and were approved by Royal Pune Independent Ethics Committee, Pune, India (date of approval: February 7, 2022; Drugs Controller General of India (DCGI) registration No. ECR/45/Indt/MH/2013/RR-19). The study was conducted in accordance with the declaration of Helsinki (52nd World Medical Association (WMA) General Assembly, Edinburgh, Scotland, October 2000) and the International Conference on Harmonization guidelines on Good Clinical Practice (GCP).
Study participants
The study population comprised healthy adult individuals of either gender, aged 18–55 years, without any clinically significant abnormalities as determined by the principal investigator based on the medical history, physical examination, chest X-ray, electrocardiogram (ECG), and routine laboratory evaluations. Additionally, all participants were required to demonstrate a willingness and ability to fully comply with the study procedures.
Individuals who tested positive for SARS-CoV-2 infection using reverse transcription quantitative polymerase chain reaction (RT-qPCR) or who had a history of comorbid medical conditions, including cardiovascular, endocrine, renal, hepatic, or other chronic diseases that may affect stress/anxiety levels, were excluded from participation in the study. Those with a history of anxiety disorders or other mental health conditions that may impact normal functioning, as well as those with a history of serious complications from diseases or any condition, including laboratory abnormalities, that in the opinion of the investigator posed an unacceptable risk or rendered the volunteer unfit to participate in the study, were excluded. Written informed consent was obtained from the participants by the investigator before initiating the screening process. There was no coercion of any kind and only those who voluntarily signed the consent form were included in the study.
Investigational product
The participants were instructed to take orally vegetarian reddish-brown soft gel capsules of TBSF 2,000 mg (500 mg × 2 soft gels, twice daily), containing 532 mg curcuminoids and 20 mg acetyl keto-boswellic acids, for a period of 90 days.
The TBSF contains turmeric extract (Curcuma longa L.), boswellia serrata extract and black sesame seed oil (Sesamum indicum). Cultivated variety of turmeric rhizomes from India were extracted with ethyl acetate and standardized to contain 26.6% curcuminoids. Wild variety of Boswellia serrata gum resin sourced from India was extracted using ethyl acetate and standardized to contain 1% acetyl-11-keto-β-boswellic acid (AKBA). The active components from Curcuma longa and Boswellia serrata were uniformly solubilized in sesame seed oil sourced from India using proprietary technology. The investigational product was manufactured in compliance with applicable Good Manufacturing Practice (GMP) and Food Safety and Standards Authority of India (FSSAI) regulations, labelled and supplied by Arjuna Natural Pvt Ltd.
Participants received 3 bottles, each containing 128 “size 0” TBSF soft gel capsules. Bottle 1 was given at enrollment, bottle 2 at the 30-day follow-up visit and bottle 3 at the 60-day follow-up visit. Participants were instructed to take only 120 capsules from each bottle for 30 days (2 capsules twice daily), with 8 extra capsules for emergencies. Participants returned the bottles at the subsequent visit. The study coordinator maintained accurate records of the dates and amounts of capsules dispensed and consumed, and the percentage of treatment adherence was calculated.
Study procedure
This open-label study evaluated the safety and tolerability of TBSF in healthy adult volunteers. A total of 40 healthy volunteers were recruited in a single arm of the study. All the eligible participants were instructed to take TBSF at dose of 2 capsules (500 mg each) twice daily, in the morning and evening, for 90 days. The capsules could be ingested with or without food, according to the preferences of the participants, as instructed. The follow-up visits were at day 30, day 60 and day 90. Change in the safety parameters from baseline to endpoint compared at different time points were the primary outcomes of the study. The tolerability of the test product was determined by observing and evaluating the occurrence of adverse events throughout the treatment period up to the last dose. Averse events and serious adverse events reported by the participants were evaluated as secondary outcomes of the study.
Study assessments
Primary safety assessments of the repeated dose of TBSF included hematological and biochemical parameters. Hematological parameters included complete blood count (CBC) (hemoglobin (Hb), white blood cells count (WBC), platelet count (PLT), red blood cells count (RBC), hematocrit (HCT), neutrophil, eosinophil, lymphocytes, monocytes, basophil, and erythrocyte sedimentation rate (ESR)). Biochemical parameters included liver function test (total bilirubin, serum glutamate pyruvate transaminase (SGPT), serum glutamic oxaloacetic transaminase (SGOT)), renal function test (serum creatinine (CR), blood urea), lipid profile (low-density lipoprotein cholesterol (LDL-C), high-density lipoprotein cholesterol (HDL-C), very-low-density lipoprotein (VLDL), total cholesterol (TC), and triglycerides (TG)), fasting blood sugar, and urine analysis.
Glomerular filtration rate (GFR) is considered as an important test to determine the level of kidney function. It describes the flow rate of filtered fluid through the kidney and identifies the stage of renal disease. The GFR was estimated based on the Chronic Kidney Disease Epidemiology Collaboration (CKD-EPI) formula,4 as detailed below:
For women with Cr <62 μmol/L:
eGFR (mL/min/1.73 m2) =
144 × (Cr/61.6)–0.329 × (0.993)age
1. For women with Cr >62 μmol/L:
eGFR (mL/min/1.73 m2) =
144 × (Cr/61.6)–1.209 × (0.993)age
2. For men with Cr <80 μmol/L:
eGFR (mL/min/1.73 m2)
= 141 × (Cr/79.2)–0.411 × (0.993)age
3. For men with Cr >80 μmol/L:
eGFR (mL/min/1.73 m2) =
141 × (Cr/79.2)–1.209 × (0.993)age
where, “eGFR” is estimated glomerular filtration rate.
Hematology and biochemistry parameters were assessed at screening and on days 30, 60 and 90. Radiological parameters (ECG and X-ray) were assessed at screening and at the end of the study. Overall tolerability of the study medication was assessed by observing and evaluating the occurrence of adverse events and grading them as poor, fair, good, or excellent. Secondary safety assessments included vital signs and physical examination results at all visits and treatment-emergent adverse events reported by study participants throughout the treatment period. Participants were instructed to monitor themselves daily for any signs of adverse reactions throughout the study period. The investigator provided detailed guidelines for self-assessment of adverse reactions to ensure their consistent and accurate reporting, and each participant was provided with a standardized observation form that included sections to provide information on the date and time of the observation, the nature of the adverse event, and any other comments. Each participant’s forms and responses were reviewed at each visit to assess for any adverse reactions during the study period.
Statistical analyses
As this research was conducted as a pilot study, an arbitrary sample size of 40 participants was selected for inclusion. Prior to statistical analysis, normality of the variables was assessed using the Shapiro–Wilk test (Supplementary Tables 1–5). Additionally, the assumption of sphericity was tested using Mauchly’s sphericity test (Supplementary Table 6). The study data set was analyzed using repeated measures analysis of variance (rm-ANOVA) when normality and sphericity assumptions were met, as rm-ANOVA has greater statistical power. If the sphericity assumption was violated, the Greenhouse–Geisser correction was applied. When the data did not meet the normality assumption, the nonparametric Friedman’s rank test was used as the nonparametric analog of the one-way rm-ANOVA, with α = 0.05. Pairwise multiple comparison of Hy’s criteria was done using the McNemar’s test, and Bonferroni correction was applied to account for multiple comparisons. To test for the differences in the binary R function outcomes, Cochran’s Q test was used. All statistical tests were conducted using NCSS v. 20 (NCSS LLC, Kaysville, USA).
Results
Study participants and recruitment
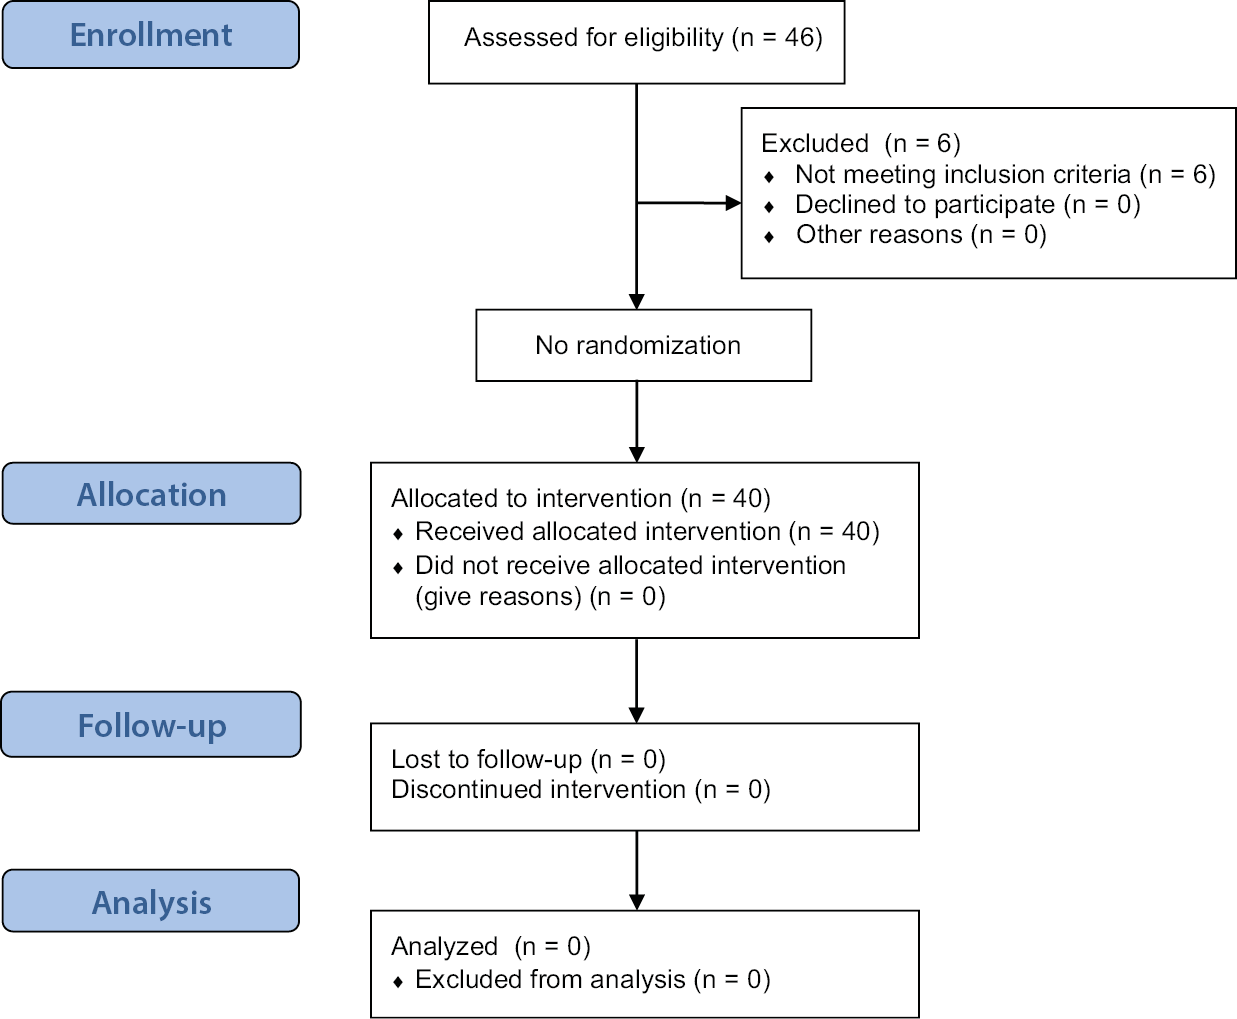
Forty-six participants were screened after obtaining their written informed consent. Six participants were excluded from the study because they did not meet the eligibility criteria. Consequently, 40 study participants were enrolled according to the approved protocol and completed the study (Figure 1). No amendments were made to the protocol and no instances of non-adherence to the protocol were observed during the study. The study had no missing data or dropouts. No adverse events or serious adverse events were reported.
Demographic characteristics and vital signs
The study participants were 22 men and 18 women with an average age of 32.38 years (Table 1). No significant variation was observed in the vital signs and weight of the participants over the course of the study (Table 2).
Safety assessment
Hematology
Complete blood count is an important tool in the safety assessment of a drug or substance. It count includes the measurement of several parameters, such as WBCs, PLT, RBCs, Hb, and HCT as well as RBC indices like mean corpuscular hemoglobin (MCH), mean corpuscular volume (MCV) and mean corpuscular hemoglobin concentration (MCHC). The neutrophil-to-lymphocyte ratio (NLR) is the ratio of absolute neutrophil count to the absolute lymphocyte count. The platelet-to-lymphocyte ratio (PLR) is the ratio of absolute platelet count to the absolute lymphocyte count. The study results showed that RBC indices, WBC, PLT, and differential count did not show any significant change at any time point. However, MCH and basophil absolute levels showed an increase at day 30 compared to baseline, which was not clinically significant. Furthermore, ESR values at day 60 and day 90 were decreased compared to the baseline. There were no significant changes in PLR and NLR, which remained within the normal range (Table 3).
Lipid profile
The lipid profile is an important component of safety assessment, particularly when evaluating the safety of an intervention that may affect lipid metabolism. The lipid profile typically includes measurements of LDL-C, HDL-C, TC, and TG. In this study, HDL-C increased significantly with nonsignificant decrease in TG and LDL-C, confirming no deterioration of renal function. The lipid profile data are shown in Table 4.
Liver function test
Liver function tests (LFTs) are a group of blood tests that are commonly used in safety assessment to evaluate liver function and to detect liver damage or disease. They typically include tests for liver enzymes such as aspartate aminotransferase (AST), alanine aminotransferase (ALT), alkaline phosphatase (ALP), and bilirubin levels. The study results showed that there was no significant difference in liver function test responses at baseline, day 30, day 60, and day 90 (Table 5).
The R value, also known as the R ratio or R factor, is a measure of the ratio of serum concentrations of 2 liver enzymes: ALP and ALT. It is used to define hepatotoxicity injury patterns. The R value can provide additional information about liver function and damage beyond individual enzyme levels. The relative pattern of ALT and/or ALP elevation indicates the type of drug-induced liver injury (DILI). A relatively elevated ALT compared to the ALP level indicates a hepatocellular pattern of DILI, whereas the opposite indicates a cholestatic pattern. In this study, none of the study participants experienced a hepatocellular injury or cholestasis or mixed injury at any time point (Table 6).
Hy’s law criteria is a set of clinical criteria used to assess the likelihood of severe liver injury or liver failure in patients taking potentially hepatotoxic drugs. They are defined as the occurrence of elevated liver enzymes (ALT or AST greater than 3 times the upper limit of normal) and elevated bilirubin levels (greater than 2 times the upper limit of normal) without initial findings of cholestasis and absence of other explanation of liver injury (e.g., viral hepatitis, alcoholic hepatitis).5 Meeting Hy’s law criteria is associated with a high risk of severe liver injury or failure and can be an indication to discontinue the use of the potentially hepatotoxic drug. Therefore, Hy’s law criteria are an important component of safety assessment for drugs that may potentially cause liver injury.
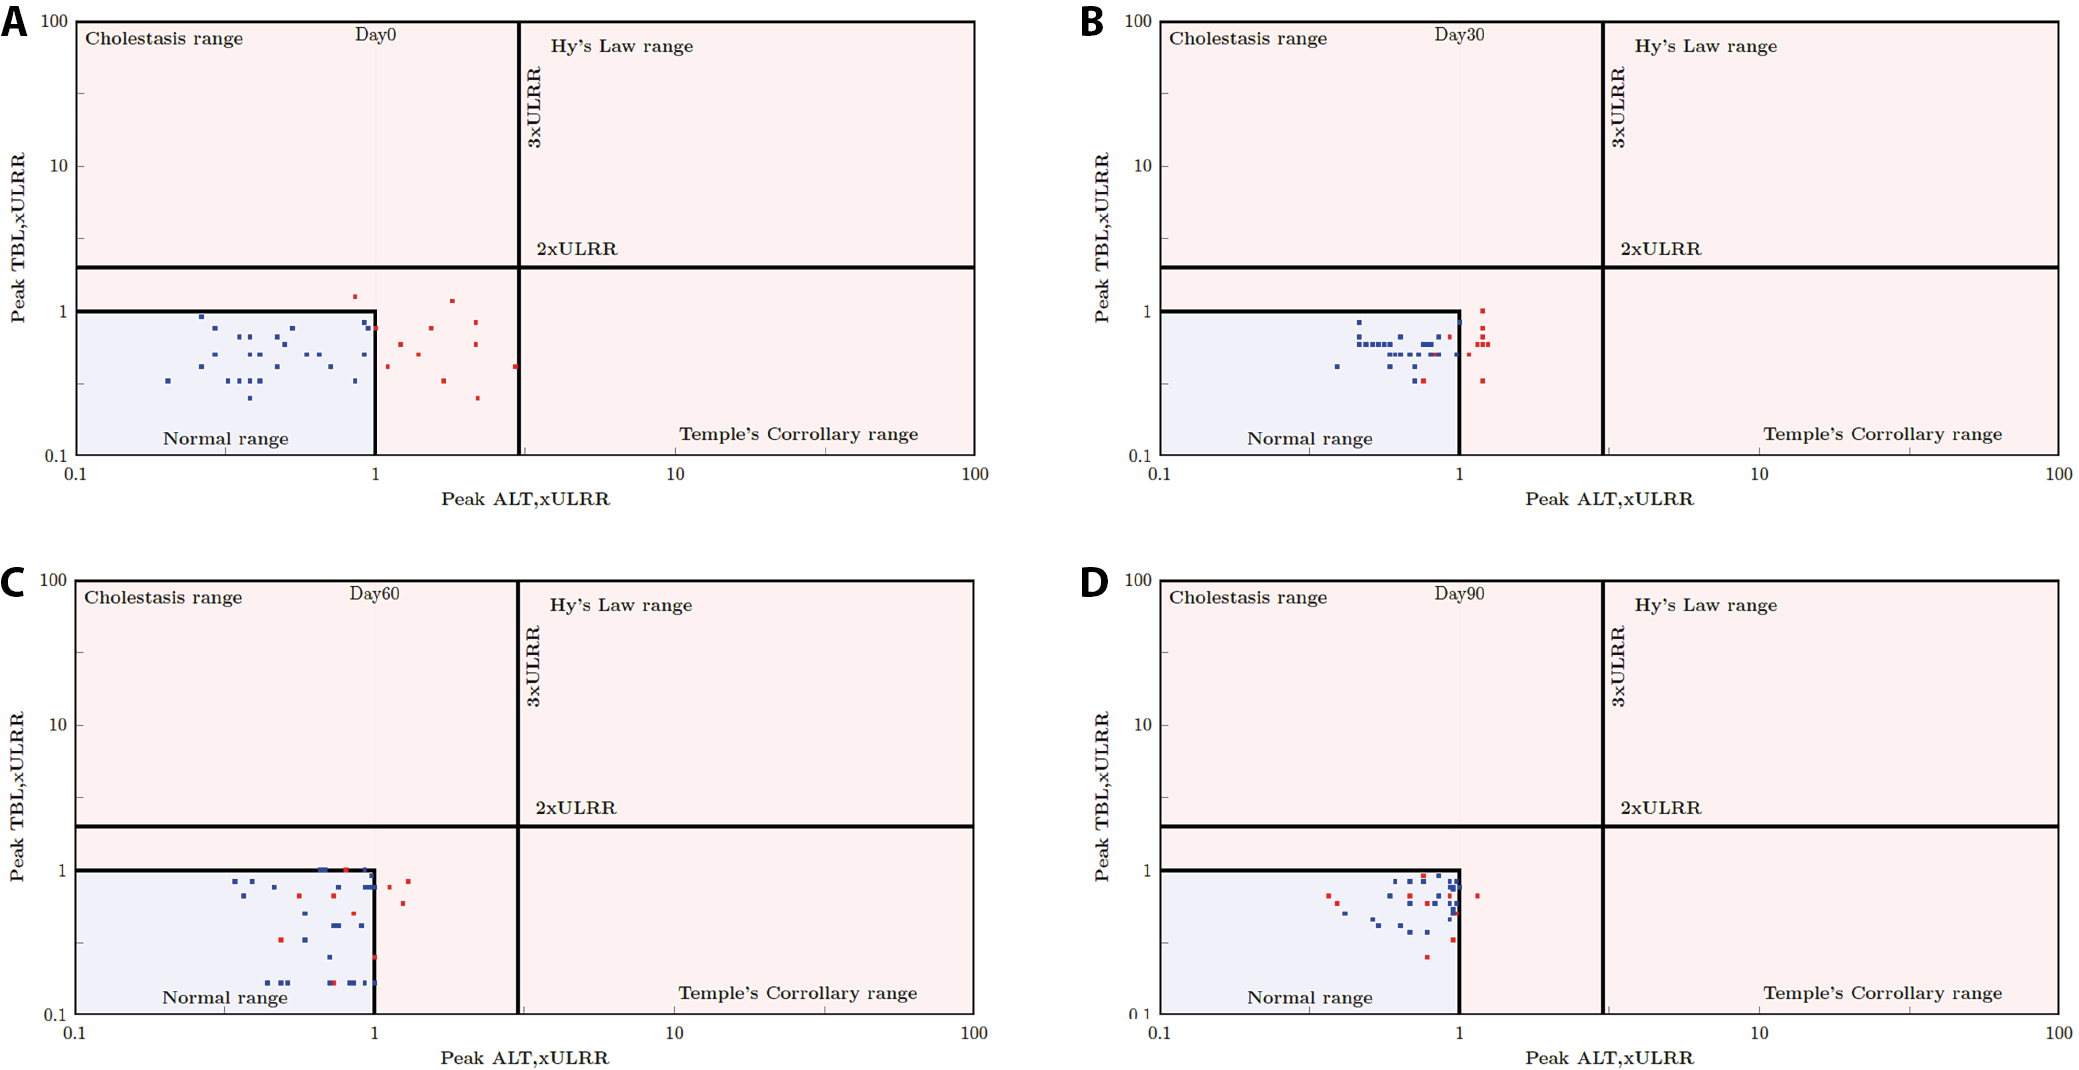
The primary graphical tool to evaluate a drug’s liver safety profile and promptly identify cases of special concern is the evaluation of drug-induced serious hepatotoxicity plot (eDISH). This plot displays a log/log correlation between peak total bilirubin (TBL) and ALT, both measured in multiples of the ULN. Horizontal and vertical lines on the plot indicate the thresholds of Hy’s law: ALT = 3 × ULN and total bilirubin = 2 × ULN. Study participants potentially meeting the Hy’s law criteria are clearly visible in the upper right quadrant of the graph. Data points in the lower right quadrant, exceeding 3 × ULN for ALT, but remaining below 2 × ULN for total bilirubin, also suggest an increased risk for liver injury (Temple’s Corollary range). According to the U.S. Food and Drug Administration (FDA) guidance on drug-induced liver injury, the identification of 1 case meeting Hy’s law criteria in the clinical trial database is a cause for concern. However, the detection of 2 such cases is highly predictive that the drug has the potential to induce severe DILI when administered to a larger population.
Figure 2 illustrates the concept of the eDISH method. Each dot on the plane represents 1 subject in the clinical study. For each subject, the peak TBL multiplied by the upper limit of the reference range (ULRR) is plotted against the peak ALT multiplied by the ULRR, utilizing a log10 scale. Figure 2 illustrates the approach proposed by Zimmerman6 to use both the indicator of hepatocellular injury, i.e., ALT, and the measure of impaired liver function (TBL) together. Figure 2 includes 2 reference lines: 2 × ULRR for TBL × ULRR and 3 × ULRR for ALT × ULRR, dividing the plane into 4 quadrants (Table 7). Normal cases are situated in the lower left quadrant. Notably, the upper right quadrant is known as Hy’s law quadrant, encompassing potentially DILI cases. Any subject falling within the Hy’s law quadrant required additional investigation to adjudicate the case.
In our study, Figure 2 shows that all study participants fall in the lower left quadrant (normal) at baseline, day 30, day 60, and day 90. None of the study participants were in the Hy’s criteria range, the temples corollary range or the cholestasis range, which is a safe indication that the product does not induce any hepatotoxicity. Further analysis of the Hy’s criteria using Cochran’s Q test and McNemar’s test showed that all study participants were in the normal first quadrant. However, there was a significant change in the proportion of study participants and study participants moving into the inner normal range when baseline was compared to day 60 and day 90 (Table 8, Table 9).
Renal function test
Renal function tests, including GFR and urine analysis, are important parameters in the safety assessment of any formulation.
Renal function assessment, involving measurements of Cr and/or blood urea nitrogen (BUN), is deemed essential for most clinical studies, alongside liver function tests such as serum glutamic oxaloacetic transaminase (SGOT), serum glutamic pyruvate transaminase (SGPT) and ALP. This assessment holds particular significance in the development of new drug or nutraceuticals. Renal function tests play a critical role in monitoring the kidney’s response to treatment and measuring the progression of kidney disease. The BUN, a byproduct of liver function and protein digestion, serves as an indicator of renal function. Creatinine, derived from the creatine breakdown in muscle metabolism, is another waste product indicative of renal function. However, the Cr clearance may be influenced by patient muscle mass, diminishing with age despite serum Cr levels staying within the normal range due to age-related muscle mass reduction.
Glomerular filtration rate stands as the gold standard test for assessing kidney function, reflecting the rate at which fluid is filtered through the kidney and indicating the stage of renal disease. While serum Cr concentration is commonly interpreted as a measure of GFR and used as an index of renal function in clinical settings, it is important to note that glomerular filtration of Cr is only one determinant of its serum concentration. The GFR is estimated with serum Cr level using appropriate formula.
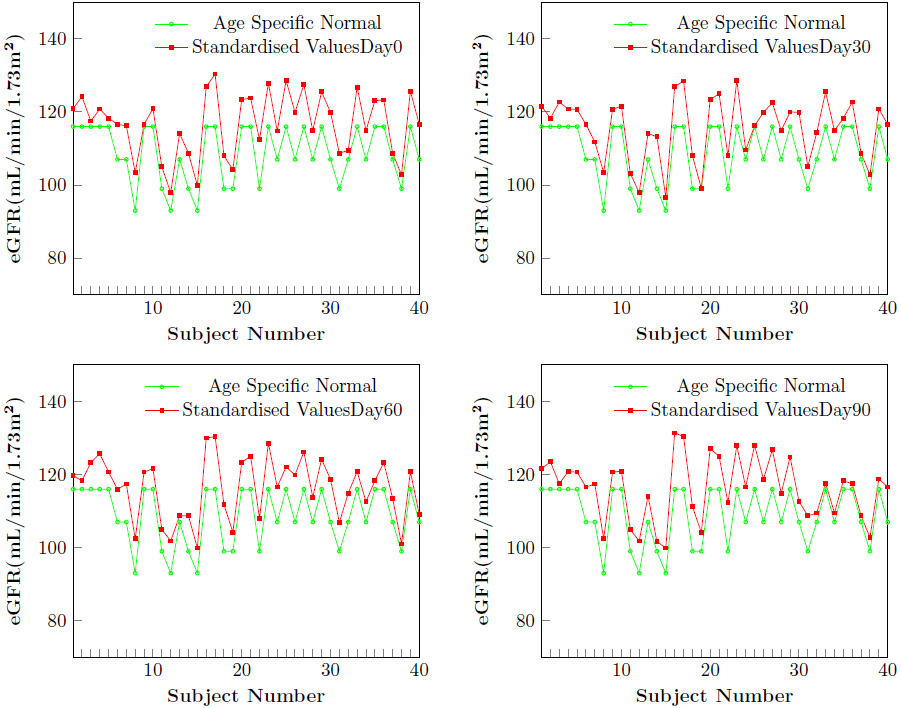
Glomerular filtration rate declines with age, even in people without kidney disease. The graph (Figure 3) shows that the estimated GFR has never gone below the normal values at any time point for any individual.
The present study indicated a normal eGFR, BUN, Cr, Cr clearance, and BUN/Cr ratio throughout the study period and there was no significant change between these values at 4 time points (Table 10).
Urine analysis
Urine analysis can provide valuable information about kidney function and overall health. It includes a standard battery of tests of physical character (appearance, color, specific gravity), chemical analysis (pH, ketones, proteins, glucose, and bile) and microscopic evaluation of sediments (RBC, WBC, bacteria, and epithelial cells). The specific gravity measures the kidneys’ capacity to reabsorb dissolved components of urine. Urine can vary widely in concentration. Table 10 shows that there was no significant change in the specific gravity and pH of urine throughout the study period and that these parameters were always within the normal range.
Ketones were absent in the urine at all time points. In a healthy individual, urine typically does not contain protein because protein molecules are too large to pass through the glomerular filtration barrier. Ketones, which are products of abnormal fat breakdown, are not typically present in urine of healthy individuals. Glucose enters the urine only when the serum glucose concentration surpasses the renal threshold for glucose reabsorption, which is typically around 180 mg/dL. In this study, since the serum glucose was well below the limit, glucose was absent in urine. The absence of bilirubin in the urine could indicate the efficient removal of breakdown products from RBCs by the liver, potentially suggesting a healthy liver. Likewise, the absence of blood in the urine suggests that the filtration barrier in the kidneys is functioning normally, effectively preventing blood from entering the urine.
Urine analysis is an effective screening tool for the assessment of an individual’s health status. The results of this study demonstrated no abnormal findings, which corroborates the findings of the LFT, renal function test (RFT) and blood analysis.
Radiological assessment
Electrocardiography and radiography were performed during screening and at the end of the study, and were found to be clinically nonsignificant and safe. It is noteworthy that none of the study participants experienced symptoms such as anorexia, nausea, vomiting, fatigue, or abdominal pain. The absence of these symptoms highlights the favorable tolerability of the product and suggests that it did not cause any gastrointestinal or systemic discomfort. It is also important to note that no adverse events or serious adverse events were observed throughout the study, which indicates that the product has a favorable safety profile.
Discussion
The present study aimed to investigate the safety profile of TBSF with SPEEDTECH (Rhuleave-K). The integration of these natural compounds, known for their anti-inflammatory properties, represents a novel approach in addressing musculoskeletal health. Our findings indicated that TBSF, administered at a dosage of 2,000 mg per day over a 90-day period, demonstrated a favorable safety profile in humans. Notably, the incorporation of TBSF with SPEEDTECH (Rhuleave-K) in the solubilization process of turmeric and boswellia extract within sesame seed oil distinguishes this formulation from traditional blends. This innovative approach not only enhances the efficacy of the product but also contributes to its safety. Comprehensive safety assessments, including monitoring for potential adverse effects, were conducted to ensure study participants’ wellbeing.
Complete blood count provides information about the effects of the drug or substance on the blood cells, which can be used to assess the potential toxicity and adverse effects of the drug or substance on the hematological system. For example, a decrease in the RBC count, Hb or HCT may indicate anemia, which can be a side effect of certain drugs or substances. Similarly, an increase in the WBC count may indicate an immune response to the drug or substance. Platelet count is also important as it can indicate potential bleeding risks. In summary, CBC can help to detect potential toxicity and adverse effects on the hematological system.
The NLR and PLR are both calculated from values obtained in CBC. They are simple and cost-effective biomarkers that have been proposed as indicators of inflammation and immune status in various conditions. In the context of safety assessment, NLR and PLR can provide useful information about the immune response of an individual, which may be relevant to the safety of an intervention. For example, an increase in NLR or PLR may indicate a heightened inflammatory response, which could be indicative of adverse effects or toxicity. Additionally, PLR and NLR have been proposed as predictors of disease severity and prognosis in a variety of conditions, which could be useful in safety assessment.7, 8, 9, 10, 11
Lipids are an important class of biomolecules with diverse functions within the body, serving as an energy source, contributing to the structural integrity of cell membranes, and acting as precursors to hormones and other signaling molecules. However, abnormal lipid metabolism can lead to various health problems, including cardiovascular disease (CVD). Abnormalities in lipid profile can indicate a higher risk of CVD. For example, elevated levels of LDL-C are linked with an increased risk of coronary heart disease and atherosclerosis. Elevated levels of HDL-C correlate with a reduced risk of CVD. Assessing changes in lipid profile during drug development can help identify potential safety issues and inform dosing recommendations. The HDL-C has been linked to renal dysfunction in heart failure patients, but the apolipoprotein A1 (ApoA1) and apolipoprotein B (ApoB), TC, TG, and LDL-C exhibit no such association.11, 12 Some research indicated that low HDL-C levels are linked to a faster progression of kidney disease.13 Moreover, a recent randomization analysis reported that genetically higher concentration of HDL-C were linked to improved kidney function, based on large samples form the largest lipid and chronic kidney disease (CKD) cohorts.7 Visconti et al.14 observed that lipid disorders in CKD are marked by decreased HDL-C, elevated triglycerides and LDL-C levels that are either normal or slightly reduced. Although the mechanism behind this association remains unclear, previous studies15, 16, 17, 18 have demonstrated that HDL-C possess antioxidant, anti-inflammatory and antithrombotic properties. These functions may mitigate atherosclerosis in renal and other arteries, suggesting a potential protective role for HDL-C in renal functions.19
Elevated liver enzymes can be an indicator of liver damage, inflammation or disease. Abnormal bilirubin levels can indicate liver or bile duct disease. Therefore, LFTs are an important component of safety assessment for drugs or other substances that may potentially cause liver damage or dysfunction. Alkaline phosphatase increases when there is injury to the bile ducts or obstruction of bile flow. Elevations in serum enzyme levels (ALP, ALT and AST) are indicators of liver injury, whereas rise in bilirubin levels may indicate the overall functioning of the liver.
The results of this study demonstrated that TBSF was well-tolerated and did not induce any adverse effects based on the assessments conducted.
Curcumin, the active compound in turmeric, has been extensively studied for its safety and therapeutic efficacy. Multiple clinical trials evaluating curcumin supplementation have consistently reported no major safety concerns or cases of DILI.20, 21 Similarly, boswellia, derived from the resin of Boswellia serrata, has been widely used in traditional medicine and clinical studies reported its safety without significant liver-related adverse events.2
In the context of herbal supplements, it is crucial to acknowledge the potential risks associated with certain products, particularly DILI. Some studies reported cases of liver injury or DILI associated with certain herbal products, highlighting the importance of thorough safety evaluations.22, 23 For example, a case-control study reported a correlation between the use of specific herbal supplements and liver injury, reinforcing the need for further investigation.24 Caution is warranted as some studies reported potential hepatotoxicity associated with high doses of piperine.25 However, TBSF evaluated in this study showed no evidence of hepatotoxicity.
In this study, results of liver function tests, including AST, ALT and bilirubin, were within normal limits at all time points, indicating the safety of the formulation. The R value and Hy’s criteria were also evaluated to assess the risk of DILI. The R value was less than 5 in all participants, indicating a low risk of liver injury.
The lipid profile is an essential indicator of cardiovascular health and is often evaluated during safety assessments. Our study found no significant changes in the lipid profile of patients taking TBSF, indicating that it did not have any adverse effects on lipid metabolism. Renal function tests, including BUN and serum Cr, were evaluated in this study, and no significant changes were observed, indicating that TBSF did not have a negative effect on renal function.
Complete blood count is an essential test for evaluating the safety of any treatment or medication. The study found no significant changes in the CBC of patients taking TBSF, indicating its safety. The study results showed that TBSF was safe and had no adverse effects on liver function, lipid profile, renal function, CBC, radiological assessment, and urine analysis.
The study findings support the hypothesis that TBSF, when integrated with SPEEDTECH (Rhuleave-K), is a well-tolerated and safe option for long-term use. These findings provide a valuable insight into the safety profile of TBSF, paving the way for its potential clinical applications.
Limitations
The study included a small sample size of participants, which may limit the generalizability of the results, and a short 90-day observation period, which may be inadequate to detect long-term effects. In addition, the focus of the study was on healthy adults, which limited its applicability to a broader population. In addition, the study lacked a comparison group, making direct comparisons with alternative treatment options difficult. Another limitation of the study was that some of the key markers, such as cystatin C, kidney injury molecule 1 (KIM-1) and interleukin 6 (IL-6) levels were not included in the analysis. To confirm and extend the study results, further research and larger studies are warranted.
Conclusions
The results of the study demonstrated that TBSF (Rhuleave-K) is safe and has no adverse effects on liver function, lipid profile, renal function, CBC, radiological assessment, and urine analysis. The study provides a valuable insight into the safety profile of TBSF for long-term use.
Supplementary data
The Supplementary materials are available at https://zenodo.org/doi/10.5281/zenodo.13757433. The package includes the following files:
Supplementary Table 1. Results from Shapiro–Wilk test of normality for weight and vitals.
Supplementary Table 2. Results from Shapiro–Wilk test of normality for hematology parameters.
Supplementary Table 3. Results from Shapiro–Wilk test of normality for lipid test parameters.
Supplementary Table 4. Results from Shapiro–Wilk test of normality for LFT test parameters.
Supplementary Table 5. Results from Shapiro–Wilk test of normality for urine sample test parameters.
Supplementary Table 6. Results from Machuly’s test of sphericity for normally distributed hematology, lipid, LFT, and urine sample test parameters.
Data availability
The datasets generated and/or analyzed during the current study are available from the corresponding author on reasonable request.
Consent for publication
Not applicable.