


Abstract
Background. Evaluating predictors of coronavirus disease 2019 (COVID-19) and severity among children may help clinicians manage the high rate of hospital admissions for suspected cases.
Objectives. This study aimed to evaluate the demographic, clinical and laboratory characteristics of children during the pandemic, and determine the predictors of COVID-19 and moderate-to-severe disease.
Materials and methods. This retrospective cohort study included all consecutive COVID-19 cases in patients aged <18 years who presented to the Pediatric Emergency Department at Haseki Training and Research Hospital (Istanbul, Turkey) between March 15 and May 1, 2020, and underwent severe acute respiratory syndrome coronavirus 2 (SARS-CoV-2) polymerase chain reaction (PCR) analysis of oro-nasopharyngeal swabs (n = 1137).
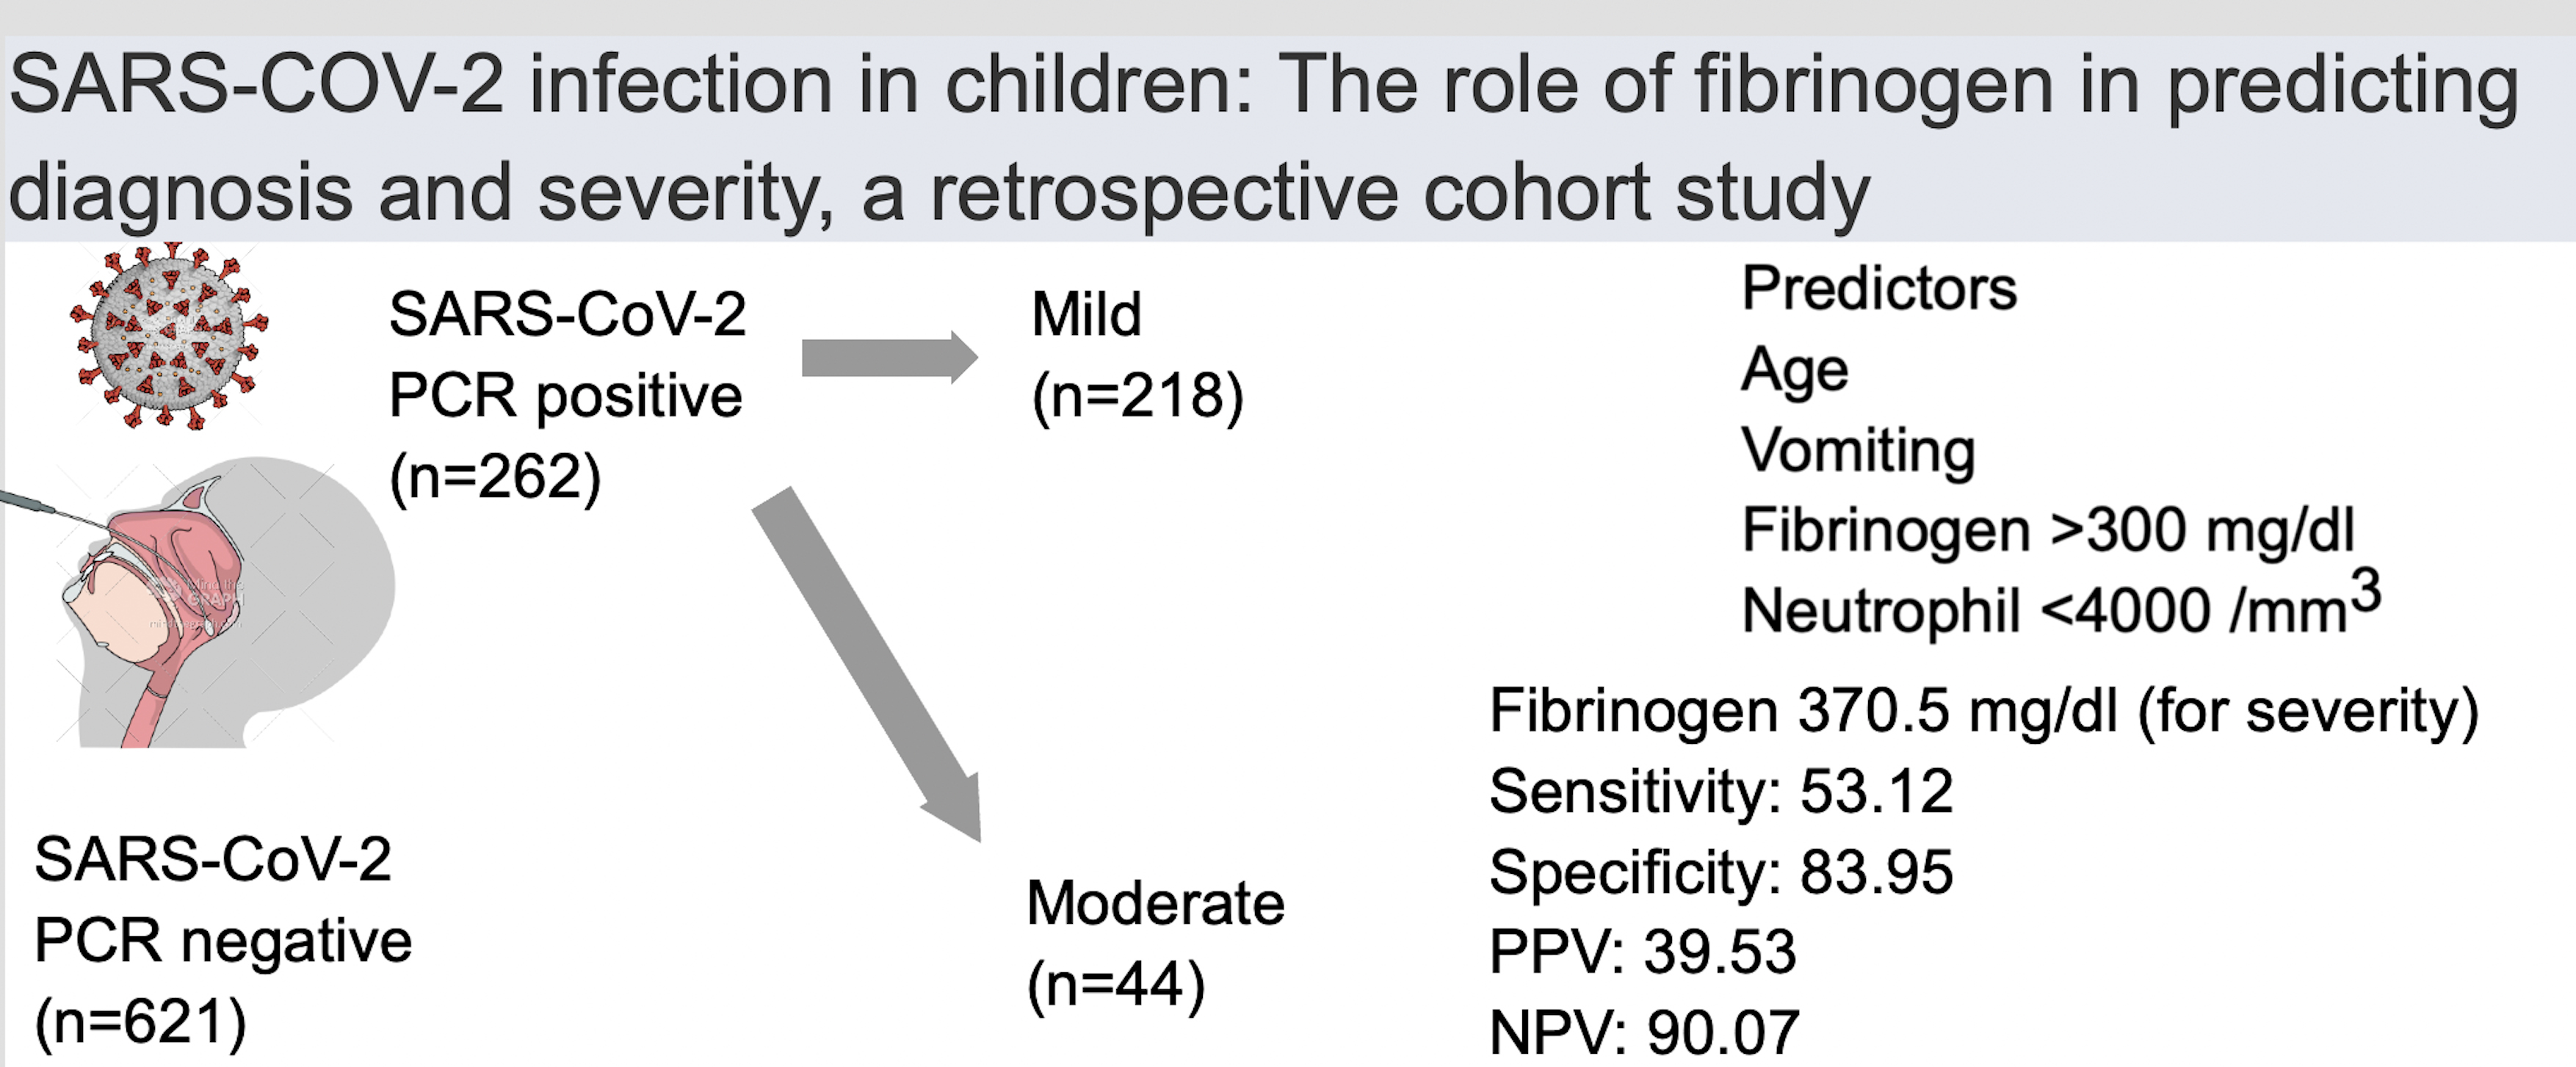
Results. The frequency of SARS-CoV-2 PCR positivity was 28.6%. The COVID-19 (+) group presented with sore throat, headache and myalgia significantly more frequently than the COVID-19 (–) group. Multivariate logistic regression models showed independent predictors of SARS-CoV-2 positivity as follows: age, contact history, lymphocyte count <1500/mm3, and neutrophil count <4000/mm3. In addition, higher age, neutrophil count and fibrinogen levels were independent predictors of severity. The diagnostic cutoff value for fibrinogen (370.5 mg/dL) had a sensitivity of 53.12, specificity of 83.95, positive predictive value (PPV) of 39.53, and negative predictive value (NPV) of 90.07 for predicting severity.
Conclusions. Symptomatology, whether alone or in combination with other approaches, may be an appropriate strategy to guide the diagnosis and management of COVID-19.
Key words: children, fibrinogen, severity, COVID-19, SARS-CoV-2 PCR
Background
In late 2019, the novel severe acute respiratory syndrome coronavirus 2 (SARS-COV-2) was reported to be spreading globally and causing coronavirus disease 2019 (COVID-19). On February 11, 2020, the World Health Organization (WHO) declared this to be a pandemic.1
So far, around 2.5–15% of all reported COVID-19 cases have been in children, and this rate has increased over time.2, 3 The clinical course of COVID-19 in children has ranged from being asymptomatic to requiring intensive-care monitoring; however, a mild disease course has been the most common.2, 3 In children, the most frequent symptoms have been fever and cough, with respective incidence of 46% and 37% in those aged <9 years, and 35% and 41% in those aged ≥10 years.3 Hospitalization rates have been lower in juveniles than in adult patients, with approx. 20% of pediatric cases requiring hospitalization.4
Although most children diagnosed with COVID-19 have been asymptomatic or have had a mild clinical course, the rate of juvenile patients admitted to hospitals has been increasing due to growing concerns about the pandemic. A severe disease course has been seen among juvenile cases, although at a lower incidence than among adults. Therefore, evaluating predictors of COVID-19 and a severe disease course among children may help clinicians to manage the high rate of hospital admissions of suspected cases.
Objectives
The primary objective of this study was to evaluate the demographic, clinical and laboratory characteristics of children with and without COVID-19 who were reported to our pediatric emergency department during the pandemic. The secondary objectives were to determine the predictors of COVID-19 and the predictors of a moderate-to-severe clinical course.
Materials and methods
Patients
The population for this retrospective cohort study included all consecutive pediatric cases aged <18 years who presented to the Pediatric Emergency Department at Haseki Training and Research Hospital (Istanbul, Turkey) between March 15 and May 1, 2020, and underwent SARS-CoV-2 real-time polymerase chain reaction (PCR) analysis of oro- and nasopharyngeal swabs (n = 1137 patients). Children with an indeterminate SARS-CoV-2 PCR result (n = 13) and those with a clinically high suspicion and a negative result (n = 25) were excluded from the study group. In total, 1099 children were enrolled in the study. Asymptomatic cases were excluded, and the remaining patients were divided into 2 groups according to the PCR test results: COVID-19-positive (COVID-19 (+); n = 262) and COVID-19-negative (COVID-19 (−); n = 621). The study population is detailed in Figure 1.
The SARS-CoV-2 PCR-positive cases, according to clinical findings, were divided into 3 groups as follows: 1) an asymptomatic group, in which patients had undergone a PCR test due to contact history and had no symptoms; 2) a mild group, in which patients had nonspecific symptoms such as cough, fever, malaise, and myalgia; and 3) a moderate-to-severe group, in which patients had pneumonia that was confirmed with physical examination and imaging (chest X-ray and/or computed tomography (CT)), with or without a requirement for oxygen supplementation.
Data collection
Demographic features, clinical data, and laboratory and imaging (chest X-ray and thorax CT) findings on admission were recorded retrospectively. Potential COVID-19 cases were routinely tested to determine complete blood count, erythrocyte sedimentation rate (ESR) and levels of C-reactive protein (CRP), procalcitonin, biochemical coagulation parameters, fibrinogen, and d-dimers. The SARS-CoV-2 presence was investigated using a reverse-transcription quantitative PCR (RT-qPCR) detection kit with oro-nasopharyngeal swabs (Bioksen ArGe Teknik Co. Ltd, Istanbul, Turkey; Biospeedy®).
The study protocol was in accordance with the Declaration of Helsinki. The protocol was approved by the Ethics Committee of the Haseki Training and Research Hospital (approval No. 2020-80).
Statistical analyses
Statistical analyses were performed using IBM SPSS v. 22.0 software (IBM Corp, Armonk, USA). The Shapiro–Wilk test was used to determine whether the variables were normally distributed. Numbers and percentages were used to express categorical variables. The mean ± standard deviation (M ±SD) or the median with the 25th and 75th percentiles were used to express continuous variables depending on whether they showed a parametric or nonparametric distribution. For the multivariate analysis, all variables were subject to a logistic regression analysis to determine independent predictors of COVID-19. All variables in the sample group without collinearity were included in a logistic regression model to determine the independent predictors of the latter. The Hosmer–Lemeshow test was used to assess the goodness-of-fit of the model. A 5% type-I error level was used to infer statistical significance. Akaike’s information criterion (AIC) and Schwarz’s Bayesian information criterion (BIC) values for logistic regression analysis models were measured using Jamovi statistical software v. 2.3.18 (https://www.jamovi.org/). A variance influence factor (VIF) of 3 was set as the cutoff value. The VIF values less than 3 indicated a low correlation among the variables included in the model. Since the number of observations totaled 726, the minimum sample size requirement was also met. The Box–Tidwell test was used to test the linearity between the predictors and the logit. Log-transformed interaction terms between the continuous independent variables and their natural logs were added to the model. Then, we re-ran the logistic model with the interaction terms. There were no statistically significant results in interaction terms (p > 0.05). Continuous independent variables were linearly related to the logit of the outcome variable, implying that the assumption was met. The capacity of fibrinogen levels in predicting moderate-to-severe clinical courses was analyzed using receiver operating characteristics (ROC) curve analysis. For fibrinogen, sensitivity, specificity, positive predictive value (PPV), negative predictive value (NPV), positive likelihood ratio (LR (+)), negative LR (LR (–)), accuracy, and area under the ROC curve (AUC) were calculated as diagnostic tools for predicting a moderate-to-severe clinical course. When evaluating the AUC, a 5% type-I error level was used to define a statistically significant predictive value for the test variables.
Results
The study population is summarized in Figure 1. The frequency of SARS-CoV-2 PCR positivity was 28.6% (n = 322/1124) during the study period.
The clinical and laboratory findings of the COVID (+) and COVID (–) groups
The demographic and clinical characteristics of the COVID-19 (+) (n = 262) and COVID-19 (−) (n = 621) groups are shown in Table 1. The ratio of hospitalization was significantly different between the COVID-19 (+) and COVID-19 (–) groups: 38 patients (14.5%) compared to 55 patients (8.9%), respectively (p = 0.013). All hospitalized patients were discharged with a good outcome, and none of the hospitalized patients required intensive care.
Among the 883 symptomatic cases, laboratory studies were performed in 726 patients (82.2%) within the first 3 days. The laboratory findings of COVID-19 (+) (n = 228) and COVID-19 (−) (n = 498) groups are shown in Table 2.
Predictors of COVID-19
All variables in the 2 groups were included in the logistic regression analysis. The logistic regression analysis found that age, contact history, lymphocyte count below 1500/mm3, and neutrophil count below 4000/mm3 on admission were independent predictors of SARS-CoV-2 PCR positivity (Table 3).
Characteristics of the COVID-19 (+) group
A total of 322 COVID-19 (+) patients were evaluated. The median age was 151 months (81; 192), and 164 (50.9%) were female. According to clinical severity, an asymptomatic course was observed in 18.6% (n = 60), a mild course in 67.7% (n = 218) and a moderate-to-severe course in 13.7% (n = 44) of the patients. Twenty-two cases (7.2%) had underlying comorbidities, the most common of which were asthma, cerebral palsy and familial Mediterranean fever. The most common symptoms were cough, fever and sore throat in the mild subgroup (61.0%, 54.1% and 25.2%, respectively), and cough, fever and shortness of breath in the moderate-to-severe subgroup (84.1%, 59.1% and 31.8%, respectively; Table 1). Thoracic CTs were performed in 39.1% (n = 126) of the COVID-19 (+) group, and 27.7% showed abnormal findings (Supplementary Table 1).
Among the 262 symptomatic COVID-19 (+) cases, laboratory studies were performed in 228 (87.0%) within the first 3 days. The laboratory findings of the COVID-19 (+) subgroup are shown in Table 2.
Predictors of a moderate-to-severe
disease course
All variables in the 2 groups were included in the logistic regression analysis. The logistic regression analysis found higher age, neutrophil count and fibrinogen level to be independent predictors of moderate-to-severe disease (Table 4).
A ROC curve was used to assess the predictive efficacies of fibrinogen levels, which reached AUC values of 0.706 (Figure 2). Table 5 shows the sensitivity, specificity, PPV, NPV, LR (+) and LR (–) accuracy, and the AUC value for fibrinogen levels in predicting a moderate-to-severe clinical course.
Discussion
We comprehensively evaluated the demographic and clinical characteristics and laboratory features of patients who underwent a SARS-CoV-2 infection evaluation. In our study sample, the positive test result rate was 1 in 3 for all groups. The relatively large number of COVID-19 (+) children (n = 322) in this cohort provided an opportunity to report on the descriptive, clinical and laboratory features of COVID-19 in children.
The frequency of SARS-CoV-2 PCR positivity in this study group was 28.6%, while a 38% rate was reported in adults during the early stages of the pandemic in China.5 Despite the fact that SARS-CoV-2 infections were observed in children and juveniles of various age, 61.5% of our cases were under the age of 10 compared to previously reported rates of 46.1% to 56.8% among COVID-19 cases in children.6, 7 Asymptomatic cases were found in 18.6% of children in our study, while this rate was 10–35% in other reports concerning COVID-19 in children.7, 8, 9, 10, 11 The ratio of asymptomatic cases did not reflect the true prevalence of asymptomatic disease as we performed PCR tests on children due to contact history, and this was not a screening study for a population.
According to the literature, a mild disease course with upper respiratory tract illness has been the most common presentation of COVID-19 in children, and the incidence rate has ranged between 33% and 79% across studies.6, 8, 10, 12, 13 In the current study, the incidence of mild disease was 67.7%, and the most frequent symptoms were cough, fever and sore throat. The rates of fever and cough were 42–52% and 44–48%, respectively, in mild cases.8, 14, 15 The possible reasons for children having a relatively mild disease course have not been validated but are thought to include less intense immune and inflammatory responses, differences in airway epithelial and angiotensin-converting enzyme-2 (ACE2) receptor expression and upregulation, pre-existing immunity to common coronaviruses, better control of viral replication, and fewer preexisting comorbidities.16, 17, 18, 19, 20, 21, 22
In the current study, a moderate-to-severe disease course was seen in 13.7% of the COVID-19 (+) cases. Although a mild COVID-19 disease course has so far been the most common among children, a moderate-to-severe disease course has been reported in between 9.1% and 33.3% of cases.13, 23 These were mostly comprised of hospitalized patients, which account for 2.3–18.2% of all confirmed pediatric COVID-19 cases.4, 7, 24 Therefore, correctly identifying patients with a moderate-to-severe COVID-19 course is essential for healthcare professionals to perform appropriate management and treatment. In the current study, we found that higher age was an independent risk factor for moderate-to-severe COVID-19. Consistent with our results, differences in ACE2 expression during puberty and other age-related factors have been reported to have an important effect on the severity of COVID-19.16, 17, 18, 19, 20, 21, 22
Moreover, the current study revealed that high fibrinogen levels were an independent predictor of moderate-to-severe COVID-19 course. Fibrinogen concentrations can increase in a setting of injury, inflammation and infection.25 High fibrinogen levels have been associated with a moderate-to-severe disease course in children.26 In a meta-analysis by Nugroho et al., a high fibrinogen level on admission was found in patients with a severe disease course.27 Patients who had high fibrinogen levels (>4 g/L) were more commonly treated in an intensive care unit (ICU) than in a general ward compared to adult COVID-19 cases.28 Moreover, Bi et al. found that fibrinogen levels were higher in individuals with severe illness.29 In children, fibrinogen level may be a useful tool to predict severity. However, the cutoff point for this parameter has not been well-defined in children.23
The correct identification of patients with a high suspicion of infection by SARS-CoV-2 will be an important tool for physicians in determining which patients should be prioritized for further testing. Some researchers have developed predictive models for the diagnosis of COVID-19 to be used in settings where diagnostic tests may not be available to first-contact physicians.30, 31, 32 In the current study, there was a strong association between higher age and the rate of positive test results in the model. Murillo-Zamora et al. found that age of 13–15 years was associated with a twofold increase in the odds of testing positive for SARS-CoV-2.33 These results support the finding that younger children (<10 years) are protected (to some extent) from SARS-CoV-2 infection by the possible reason of changes in ACE2 expression and activity in puberty.16, 34 Among the significant symptoms, there was an association between headache and having at least 2 episodes of fever, cough or shortness of breath and COVID-19 infection. Mutiawati et al. revealed that headache was approximately twice more common in COVID-19 patients than in non-COVID-19 patients (with other viral infections).35 We found that contact history was the major predictor and accounted for the highest increase in the rate of COVID-19 diagnosis, in line with several other studies.36, 37, 38 Moreover, in the current study, experiencing at least 2 episodes of fever, cough and shortness of breath was significantly associated with SARS-CoV-2 positivity, similarly to previous reports.39, 40
Abnormal laboratory findings such as lymphopenia, leukopenia, thrombocytopenia, and elevated inflammatory markers (CRP and procalcitonin) were found in this cohort of pediatric COVID-19 patients, which was consistent with the literature.9, 41, 42 It was found that a lymphocyte count below 1500/mm3 and a neutrophil count below 4000/mm3 were independent predictors of SARS-CoV-2 PCR positivity. Lower leukocyte, neutrophil, lymphocyte, and platelet counts were seen in cases of COVID-19 pneumonia compared to cases of non-COVID-19 pneumonia.43 In addition, some studies showed that low lymphocyte counts were independent predictors of SARS-CoV-2 infections.44, 45 The SARS-CoV-2 RT-qPCR assay is considered the gold standard test for COVID-19.46 Nonetheless, determining the predictors of COVID-19 infection and correctly identifying patients with a high suspicion of infection by SARS-CoV-2 are essential for emergency service practitioners before RT-qPCR results are available. Finally, including the symptoms and laboratory findings significantly associated with SARS-CoV-2 infection in a predictive model will allow for a faster and more accurate final diagnosis.
Limitations of the study
There were several limitations to this study. We enrolled all consecutive patients who had undergone a test, so the subgroups were not equal in size. Furthermore, this was a single-center study and it retrospectively evaluated children who had been admitted to the hospital.
However, our study group comprised a significant number of symptomatic patients, which means that the findings and inferences are relevant. The relatively large number of COVID-19 (+) patients (n = 322) in our cohort allowed us to report on the descriptive, clinical and laboratory features of COVID-19 among children. The large number of pediatric cases enrolled and the use of RT-qPCR as a gold standard for SARS-CoV-2 diagnosis of clinical specimens are strengths of this study.
Conclusions
Determining the factors associated with diagnosis and clinical severity are important for childhood COVID-19 cases. The current study sheds light on the absence of specificity regarding the severity of disease and symptoms in children with and without COVID-19. Symptomatology, whether alone or in combination with other approaches, may be an appropriate strategy to use in an emergency department setting to guide the diagnosis and management of the disease. While our models do not justify presumptive SARS-CoV-2 diagnosis without an RT-qPCR assay, they can contribute to developing further screening strategies.
Supplementary data
The Supplementary materials are available at https://doi.org/10.5281/zenodo.7827579. The package contains the following files:
Supplementary Table 1. Radiological characteristics of all COVID-19 (+) cases.

