Advances in Clinical and Experimental Medicine

Title abbreviation: Adv Clin Exp Med
JCR Impact Factor (IF) – 2.1
5-Year Impact Factor – 2.2
Scopus CiteScore – 3.4
Index Copernicus  – 168.52; MEiN – 140 pts

ISSN 1899–5276 (print)
ISSN 2451-2680 (online)
Periodicity – monthly

Download original text (EN)

Advances in Clinical and Experimental Medicine

Ahead of print

doi: 10.17219/acem/152635

Publication type: original article

Language: English

License: Creative Commons Attribution 3.0 Unported (CC BY 3.0)

Download citation:

  • BIBTEX (JabRef, Mendeley)
  • RIS (Papers, Reference Manager, RefWorks, Zotero)

Cite as:


Zhou J, Feng L, Zhang Y, Huang S, Jiang H, Wang W. High red blood cell distribution width is associated with the mortality of critically ill cancer patients: A propensity-matching study [published online as ahead of print on October 13, 2022]. Adv Clin Exp Med. 2023. doi:10.17219/acem/152635

High red blood cell distribution width is associated with the mortality of critically ill cancer patients: A propensity-matching study

Jiahao Zhou1,A,D, Linya Feng1,B, Yan Zhang1,E, Shuangshuang Huang2,C, Hao Jiang3,C, Weijian Wang1,F

1 Department of Anesthesiology, The First Affiliated Hospital of Wenzhou Medical University, China

2 Yueqing Affiliated Hospital of Wenzhou Medical University, China

3 Department of Ultrasonography, The First Affiliated Hospital of Wenzhou Medical University, China

Graphical abstract


Graphical abstracts

Abstract

Background. The red blood cell distribution width (RDW) is related to the mortality of patients with malignant tumors, but the relationship between RDW and the prognosis of cancer patients in the intensive care unit (ICU) has not been fully clarified.

Objectives. To investigate the role of RDW in predicting the prognosis of critically ill cancer patients.

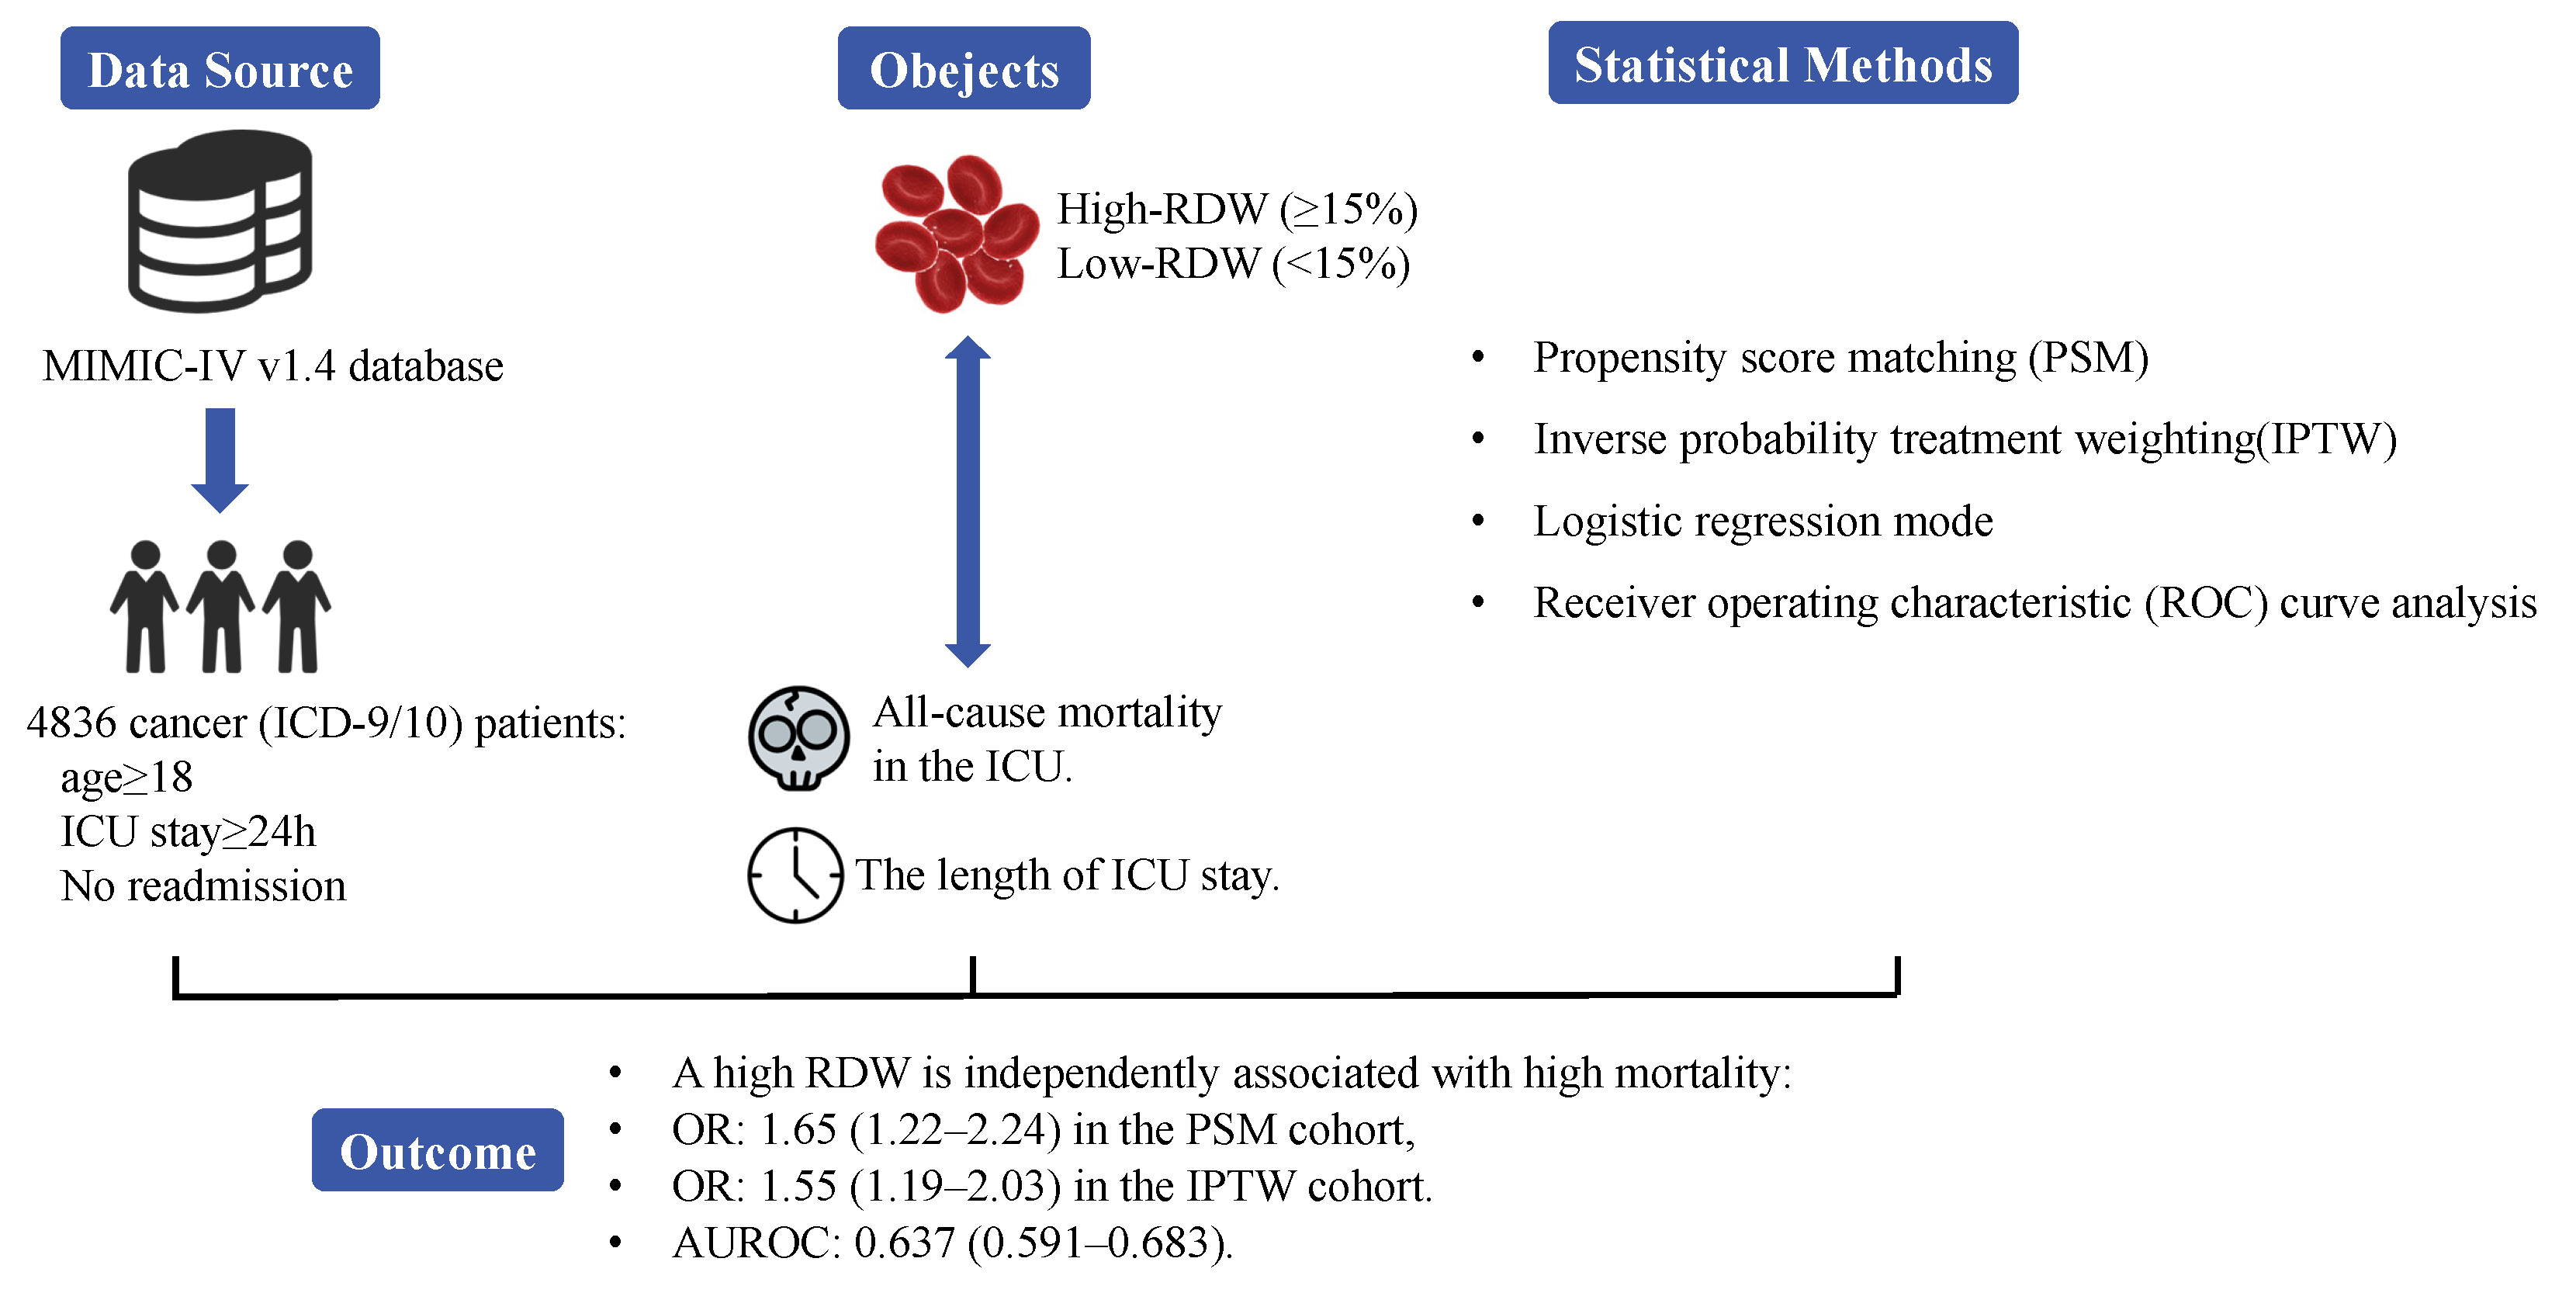
Materials and methods. A propensity score matching (PSM) study was conducted using data from adult patients with cancer, admitted to the ICU from the Intensive Care Medical Information Market IV (MIMIC-IV, v. 1.4) database. The correlation between RDW and ICU all-cause mortality was evaluated using a logistic regression model; stratification factors were considered. Additionally, a receiver operating characteristic (ROC) curve analysis was performed to compare the prognostic values of various blood biomarkers.

Results. Overall, 4836 cancer patients were included. The optimal critical RDW value was 15%. The RDW levels were independently correlated with ICU mortality in critically ill cancer patients, with odds ratios (ORs) of 1.56 (1.12–2.18) in the original cohort, 1.64 (1.27–2.12) in the imputation cohort, 1.65 (1.22–2.24) in the matched cohort, and 1.55 (1.19–2.03) in the weighted cohort. The forecasted performance of RDW is better than other blood biomarkers with an area under the ROC curve (AUC) of 0.637 (0.591–0.683).

Conclusions. The RDW has a prognostic value in critically ill cancer patients and a high RDW is independently associated with high mortality.

Key words: cancer, intensive care unit, red blood cell distribution width


Background

Due to high incidence and mortality rates,1 cancer has become an inevitable burden worldwide. Recently, cancer-related mortality rates have declined due to the advances in the strength of treatments. However, because of cancer-related complications and the side effects of cancer treatments, the number of patients with cancer being admitted to the intensive care unit (ICU) is increasing.2, 3 Approximately 1 in 20 cancer patients are transferred to the ICU within 2 years of their cancer diagnosis.4 Moreover, nearly 1 in 7 patients in the ICU have malignant tumors.5 Notably, the mortality rate of cancer patients is 30–77%, and the mortality rate for cancer patients requiring mechanical ventilation in the ICU exceeds 45%.6

Although the ICU provides life support and organ protection, it creates a heavy cost burden for treatment. Therefore, studies aimed at identifying effective prognostic indicators to identify a reasonable expectation of survival after treatment are urgently needed.7

Red blood cell distribution width (RDW) is a reflection of the volume dispersion of red blood cells, typically expressed as the coefficient of variation in red blood cell volumes. Recently, RDW was reported to be an independent predictor of mortality in cardiovascular disease (CVD)8 and various types of cancer.9, 10, 11, 12 Additionally, RDW is independently related to mortality in critically ill patients admitted to the ICU due to various etiologies.13, 14, 15 Although the mechanism between the association of RDW and mortality has not been elucidated, it may be involved in oxidative stress and inflammation.16 However, the relationship between RDW and the prognosis of cancer patients admitted to the ICU is unclear. Therefore, studies evaluating the correlation between RDW and the prognosis of critically ill cancer patients may help in predicting their survival and optimizing the clinical management of these patients. We hypothesized that RDW can predict ICU mortality in critically ill cancer patients.

Objectives

To investigate the role of RDW in predicting the prognosis of critically ill cancer patients.

Materials and methods

Data source

The data were retrieved from the Intensive Care Medical Information Market IV MIMIC-IV v. 1.4,17 a large, free, public, single-center database (https://mimic.mit.edu/). This database contains clinical information on 53,150 distinct patients admitted to the ICU at the Beth Israel Deaconess Medical Center in Boston, USA, from 2008 to 2019. The data include demographic characteristics, vital signs, laboratory data, treatment, drug use, and survival information. To protect the patients’ privacy, all identifiable patient information was removed. One of the investigators (LF) completed the collaborative institutional training program course required for ethical approval (record ID: 36309108).

Study cohort

Malignancies were identified using the International Classification of Diseases, version 9/10 (ICD-9/10): digestive system (140–159/C00–C26, C48), respiratory system and thoracic cancer (160–165/C30–C39), connective tissue (170–171, 176/C40–C41, C45–C46, C49), genitourinary system (179–189/C51–C68), nervous system (190–192/C47, C69–C72), hematological and lymphatic system (200–208/C81–C96), connective tissue (170–171, 176/C40–C41, C45–C46, C49), other (172–175, 193–195, 2090–2093/C43–C44, C50, C73–C76, C97), and metastatic (196–199, 2097/C77–C80).

The inclusion criteria (Figure 1) included: 1) age ≥18 years and 2) duration of ICU stay ≥24 h. Patients with hematological tumors or those repeatedly admitted to the ICU were excluded.

Data collection

Structured Query Language (SQL) in Navicat Premium (v. 12.0.18; PremiumSoft CyberTech Limited, Hong Kong, China) was applied to extract data from the MIMIC-IV within 24 h of ICU admission for a given patient. For laboratory measurements, the mean values ((maximum+minimum)/2) were selected. Data included demographic information (age, sex, race), type of care unit, type of cancer, comorbidities (congestive heart disease (CHD), chronic kidney disease (CKD), anemia, atrial fibrillation (AFib), coronary atherosclerotic heart disease (CAD), stroke, chronic obstructive pulmonary disease (COPD), and liver disease), use of mechanical ventilation, vasopressors and continuous renal replacement therapy (CRRT), laboratory data (RDW, red blood cell count (RBC), white blood cell count (WBC), platelet count (PLT), hemoglobin (Hb), blood urea nitrogen (BUN), creatinine, glucose (GLU), neutrophil/lymphocyte ratio (NLR), monocyte/lymphocyte ratio (MLR), and platelet/lymphocyte ratio (PLR)), and scoring systems (sequential organ failure assessment (SOFA) and simplified acute physiology score II (SAPSII)).

The diagnosis of acute respiratory distress syndrome (ARDS), acute kidney injury (AKI) and sepsis was based on the Berlin Definition, Kidney Disease: Improving Global Outcome guidelines18 and The Third International Consensus Definitions for Sepsis and Septic Shock (Sepsis-3),19 respectively.

Outcomes

The primary outcome of this study was all-cause mortality in the ICU. The secondary outcome was the length of ICU stay.

Statistical analyses

The random forest model was used to impute missing values and missing data (Figure 2). After imputation, the largest Youden’s index of the receiver operating characteristic (ROC) curves were used to determine the best RDW cutoff value based on ICU mortality. Then, the imputation dataset was stratified by RDW into a high-RDW group and a low-RDW group.

Propensity score matching (PSM) and inverse probability treatment weighting (IPTW)20 were applied to construct 2 models for controlling confounding factors. The patients were matched using the nearest neighbor algorithm of 1:1 according to propensity scores estimated using the following covariates: sex, age, race, care unit, type of cancer, comorbidities, use of ventilation, vasopressor, CRRT, ARDS, AKI, sepsis, SOFA, and SAPSII.

Baseline characteristics of all cohorts were reported. Continuous variables were represented by median (1st quartile (Q1), 3rd quartile (Q3)), while categorical variables were represented by frequency (percentage). The Kruskal–Wallis test was used to determine the statistical relevance of the study outcomes for continuous variables, while the Fisher’s exact test or χ2 test was used for categorical variables, as appropriate. The standardized mean difference (SMD), difference quotient between 2 means, and pooled standard deviation (SD) were also calculated to assess the balance between the high-RDW group and the low-RDW group.

A univariate logistic regression model was applied to determine the correlation between RDW and ICU mortality. Additionally, to assess the independent effects of RDW on ICU mortality, 2 multivariate logistic regression models were developed. In model I, we only adjusted for demographic information (age, sex and race). In model II, demographic information, type of cancer, comorbidities, use of mechanical ventilation, vasopressors, CRRT, acute diseases (ARDS, AKI and sepsis), and laboratory data (RBC, WBC, PLT, Hb, BUN, creatinine, and GLU) were included. Then, we conducted a sensitivity analysis on the original, imputed, PSM, and IPTW cohorts to evaluate the robustness of the results. The secondary outcome was evaluated by means of multivariate linear regression using model II.

All analyses and figures were carried out using the R v. 4.0.1 (packages: missForest, ggplot2, Matching, tableone, mice, and pROC; R Foundation for Statistical Computing, Vienna, Austria). A bilateral p-value <0.05 was considered statistically significant and a SMD < 0.1 was considered balanced.

Additional analyses

Stratified analysis was performed on the imputation cohort according to age, sex, race, type of cancer, comorbidities, and scoring system to evaluate the impact of RDW on ICU mortality among the different subgroups. The likelihood ratio test was used to estimate the effects between the stratified factors and RDW.

Finally, the ROC curves were drawn to compare the prognostic values of RDW, NLR, PLR, and MLR. Since the missing values for NLR, MLR and PLR were not imputed, the ROC curves were only drawn using the original dataset.

Results

Characteristics of subjects

We enrolled 4836 subjects who met the inclusion criteria. The baseline patient characteristics of the original cohort are shown in Table 1. The median age of all patients was 67.00 (59.00, 76.00) years, and the median RDW was 14.95% (13.75, 16.70). Among all the patients, malignant tumors of the digestive system were the most common (33.8%), followed by tumors of the respiratory system (22.3%), genitourinary system (16.2%), other tumor sites (6.8%), nervous system (5.9%), and connective tissues (2.0%). Metastatic tumors were present in 2560 (52.9%) patients. The prevalence of AKI and sepsis was 63.8% and 38.3% (3085 and 1851 patients), respectively. During the first 24 h following ICU admission, 1261 patients (26.1%) were placed on mechanical ventilation and 1314 patients (27.2%) required vasopressors. Patients were divided into high-RDW (≥15%) and low-RDW (<15%) groups consisting of 2483 and 2353 patients, respectively (Table 2). Patients with a high RDW were more likely to have digestive tumors (40.8% compared to 26.3%), distant metastases (60.0% compared to 45.5%), AKI (69.7% compared to 57.6%), and sepsis (46.6% compared to 29.5%), all with a SMD > 0.1. Additionally, patients in the high-RDW group had higher SOFA scores (4.00 (2.00, 6.00) compared to 2.00 (1.00, 4.00) in the low-RDW group) and higher SAPSII scores (40.00 (32.00, 48.00) compared to 34.00 (28.00, 41.00) in the low-RDW group), both with a SMD > 0.1.

Association between RDW
and primary outcomes

After matching and weighting, the baseline characteristics of the 2 groups tended to be balanced (Figure 3). The characteristics of the imputation, matched and weighted cohorts are shown in Table 2. The high-RDW group showed higher ICU mortality (13.9% compared to 5.4%) in comparison to the low-RDW group. In line with these results, the logistic regression analysis showed that high RDW levels were associated with ICU mortality in the IPTW cohort for the unadjusted cohort (1.56 (1.22–2.00), p < 0.001), model I (1.57 (1.23–2.01), p < 0.001) and model II (1.55 (1.19–2.03), p = 0.003) (Table 3). All variables in model II had variance inflation factors <10, which indicates an absence of multicollinearity. The Durbin–Watson test verified the independence of errors (value = 1.958). For evaluating the robustness of the results, a sensitivity analysis was conducted. The same trend was observed in the high-RDW group using model II in the origin cohort (1.56 (1.12–2.18), p = 0.002), imputation cohort (1.64 (1.27–2.12), p < 0.001) and PSM cohort (1.65 (1.22–2.24), p = 0.003) (Table 3).

Association between RDW
and secondary outcomes

There was no difference in the duration of ICU stays between the high-RDW group and the low-RDW group (2.40 (1.70, 4.10) compared to 2.30 (1.60, 4.00), with a SMD < 0.1). As shown in Table 4, the RDW had no effect on the length of ICU stay for the origin cohort (R2 = 0.15, p = 0.270), imputation cohort (R2 = 0.14, p = 0.140) and PSM cohort (R2 = 0.16, p = 0.050).

Additional analyses

The results of subgroup analysis for the imputation cohort are shown in Figure 2. Interactions were observed only in subgroups with respect to age (p = 0.014), respiratory and thoracic tumors (p = 0.028), AFib (p = 0.021), CHF (p = 0.026), and no differences were found in associations between RDW and the primary outcomes in the remaining subgroups. In patients with connective tissue tumors, RDW was not related to outcomes. RDW has higher predictive significance in patients with higher SOFA scores, which was the opposite for SAPSII. Additionally, patients with liver disease showed a significantly higher RDW-associated ICU risk of death (3.85 (1.8–9.53)). A high RDW was also associated with prognosis in both men and women. Notably, the relationship between a high RDW and mortality was weaker in older adults (age ≥60 years).

In the 1347 patients without any missing values for RDW, NLR, PLR, and MLR, we calculated the areas under the ROC curve (AUCs) to compare the predictive value of RDW, NLR, PLR, and MLR on ICU mortality (Figure 4). The AUC for RDW, NLR, PLR, and MLR in the context of ICU mortality in critically ill cancer patients were 0.637 (0.591–0.683), p < 0.001; 0.559 (0.510–0.608), p = 0.014; 0.485 (0.438–0.532), p = 0.530; and 0.501 (0.454–0.547), p = 0.982, respectively. The ROC analysis suggested that RDW is superior to NLR, PLR and MLR for predicting the prognosis of critically ill cancer patients.

Discussion

Our results suggest that a higher RDW is related to an increased risk of death in cancer patients admitted to the ICU. However, considering that the effects of blood cell parameters were evaluated, cases involving hematological and lymphatic malignancies were excluded from the final cohort. Importantly, similar trends were observed in the 2 models adjusted for different variables. This suggests that RDW is an independent predictor of the prognosis in critically ill cancer patients. The mean lifespan of a red blood cell is 120 days, and its homeostasis can be affected by many chronic diseases. To exclude bias introduced by chronic diseases, we conducted subgroup analyses in patients with common comorbidities. A forest plot indicated that there were interactions between AFib and CHF and RDW. This can be explained by the fact that risk factors related to the incidence of AFib and CHF are also the factors associated with increased RDW values, such as endothelial dysfunction, genetic susceptibility, aging, and others.21, 22

Many studies have confirmed RDW to have prognostic value in various cancers such as gastric,10 ovarian11 and lung cancer.12 For established cancers, there is growing evidence showing that local immune responses and systemic inflammation play a role in tumor progression and the overall survival (OS) rate in patients with cancer.23 The RDW is also a laboratory indicator for many chronic diseases and thus can be regarded as a nonspecific but outcome-related chronic disease marker.24 Cancer is often associated with chronic consumption and cachexia.25

Besides, plenty of studies have shown RDW to be a good prognostic predictor in ICU patients on account of acute overall inflammation,26, 27, 28 oxidative stress29 and arterial underfilling.30 The RDW is a risk factor for a severe prognosis in diseases such as sepsis,31 acute heart failure,32 autoimmune diseases, and liver diseases.33 However, during subgroup analysis, bias caused by comorbidities and acute ICU diseases (sepsis, AKI and ARDS) was not detected.

The exact biological mechanisms between RDW and cancer in ICU patients remain unclear. The underlying mechanism based on the available literature is that an altered myeloid lineage, abnormal iron metabolism and diminished response to erythropoietin34, 35 occurs in the setting of chronic and acute systemic inflammation, leading to reduced erythrocyte survival and an increased entry of premature erythrocytes into the circulation.36 Therefore, the lower survival in patients with a high RDW might be secondary to inflammation itself. Given the increasing number of cancer patients admitted to the ICU,2, 3 these patients might to some extent be considered as a separate subtype of ICU patients. Additionally, the exact indications for the use of RDW in such a background are unclear, although a high RDW was a risk factor in the vast majority of subgroups (Figure 5). All in all, the potential mechanisms and indications for the application of RDW in critically ill cancer patients need further exploration.

In addition to RDW, several prognostic parameters based on systemic inflammation have been proposed in cancer patients, including NLR,37 PLR38 and MLR.39 In this study, the performance of RDW was compared to these biochemical indicators. Importantly, the ROC curve analysis suggested that RDW had the best prognostic ability among these indicators.

Limitations

This study had some limitations. First, the data were obtained from the MIMIC-IV database. Although the large sample size was an advantage in this study, the data contained in this database cover a long period (2008–2019). Therefore, some information may be obsolete or missing, such as iron, B12 and other factors necessary for hematopoiesis. This, coupled with chemotherapy that can affect hematopoiesis, may influence the RDW in cancer patients. Second, this was a single-center retrospective study with incomplete numerical records and outliers in the database, which may have led to deviations. Third, we only selected the RDW measurement performed in the first 24 h after the admission to the ICU and did not monitor the dynamic trends in RDW levels. In an environment like the ICU, with numerous operations and treatments, such as blood transfusions, anti-inflammatory drugs, anticoagulant drugs, etc., the measured value of RDW can be greatly affected and should be interpreted carefully.

Conclusions

We showed that a high RDW in critically ill cancer patients is independently associated with ICU mortality. As a simple, inexpensive and routine laboratory index, RDW levels can indicate disease severity to a certain extent in cancer patients transferred to the ICU and guide the monitoring of these patients. However, large multi-center prospective studies are needed to confirm our results. The biological mechanisms underlying why RDW has a statistical significance among various clinical parameters are uncertain. Therefore, it is necessary to further explore the relationship between the dynamic changes of RDW and the prognostic and biological mechanisms to obtain a better clinical interpretation.

Tables


Table 1. Baseline characteristics of origin of the patient cohort

Variables

Overall

Low-RDW group

High-RDW group

p-value

Test value

Number of patients

4836

2346

2317

Gender, F (%)

2019 (41.7)

936 (39.9)

998 (43.1)

0.030

4.842+

Age

67.00 (59.00, 76.00)

67.00 (59.00, 75.00)

67.00 (59.00, 76.00)

0.209

1.580*

Race (%)

Black

449 (9.3)

171 (7.3)

252 (10.9)

<0.001

18.185+

Other

937 (19.4)

465 (19.8)

441 (19.0)

White

3450 (71.3)

1710 (72.9)

1624 (70.1)

ICU mortality (%)

471 (9.7)

127 (5.4)

316 (13.6)

<0.001

ICU stay

8.30 (5.30, 13.70)

8.30 (5.50, 13.10)

8.40 (5.30, 14.60)

0.538

3.682*

Type of cancer

Digestive (%)

1634 (33.8)

617 (26.3)

937 (40.4)

<0.001

104.895+

Respiration/thoracic (%)

1077 (22.3)

606 (25.8)

450 (19.4)

<0.001

27.338+

Connective tissue (%)

96 (2.0)

49 (2.1)

46 (2.0)

0.884

0.062+

Genitourinary (%)

784 (16.2)

393 (16.8)

366 (15.8)

0.399

0.781+

Nervous (%)

287 (5.9)

246 (10.5)

36 (1.6)

<0.001

163.687+

Other (%)

331 (6.8)

168 (7.2)

144 (6.2)

0.217

1.672+

Metastatic (%)

2560 (52.9)

1067 (45.5)

1381 (59.6)

<0.001

93.214+

Ventilation (%)

1261 (26.1)

613 (26.1)

623 (26.9)

0.580

0.344+

Vasopressor (%)

1314 (27.2)

551 (23.5)

724 (31.2)

<0.001

35.338+

CRRT (%)

32 (0.7)

7 (0.3)

22 (0.9)

0.008

7.996+

Comorbidities

AFib (%)

1216 (25.1)

548 (23.4)

622 (26.8)

0.007

7.537+

Anemia (%)

945 (19.5)

365 (15.6)

519 (22.4)

<0.001

35.511+

CHF (%)

751 (15.5)

266 (11.3)

446 (19.2)

<0.001

56.383+

CKD (%)

722 (14.9)

251 (10.7)

434 (18.7)

<0.001

60.009+

COPD (%)

878 (18.2)

391 (16.7)

464 (20.0)

0.003

8.785+

CAD (%)

833 (17.2)

373 (15.9)

425 (18.3)

0.030

4.906+

Liver (%)

443 (9.2)

150 (6.4)

264 (11.4)

<0.001

36.025+

Stroke (%)

259 (5.4)

158 (6.7)

95 (4.1)

<0.001

15.770+

Sepsis (%)

1851 (38.3)

693 (29.5)

1081 (46.7)

<0.001

144.877+

AKI (%)

3085 (63.8)

1353 (57.7)

1619 (69.9)

<0.001

75.094+

ARDS (%)

207 (4.3)

101 (4.3)

97 (4.2)

0.898

0.040+

Laboratory data

RDW

14.95 (13.75, 16.70)

13.75 (13.10, 14.35)

16.70 (15.75, 18.10)

<0.001

3496.617*

RBC

3.41 (3.01, 3.92)

3.64 (3.23, 4.12)

3.21 (2.84, 3.66)

<0.001

442.684*

Hb

10.30 (9.00, 11.90)

11.30 (9.90, 12.65)

9.55 (8.41, 10.75)

<0.001

777.953*

PLT

205.00 (141.50, 279.50)

215.00 (158.50, 279.50)

195.50 (128.25, 281.50)

<0.001

40.863*

WBC

10.70 (7.70, 14.46)

11.00 (8.25, 14.50)

10.47 (7.20, 14.60)

<0.001

12.288*

BUN

18.00 (13.00, 25.00)

17.00 (12.50, 22.50)

20.00 (14.00, 28.50)

<0.001

120.939*

Creatinine

0.85 (0.65, 1.20)

0.85 (0.65, 1.10)

0.90 (0.70, 1.30)

<0.001

47.724*

GLU

7.10 (6.10, 8.60)

7.30 (6.20, 8.70)

7.00 (5.90, 8.60)

<0.001

23.358*

NLR

10.00 (5.50, 17.50)

9.80 (5.32, 16.60)

10.40 (5.70, 18.30)

0.075

3.171*

PLR

237.60 (131.20, 399.50)

240.90 (129.40, 400.20)

242.20 (134.73, 403.22)

0.672

0.179*

MLR

0.60 (0.30, 0.90)

0.50 (0.30, 0.90)

0.60 (0.40, 0.90)

0.025

5.005*

SOFA

3.00 (1.00, 5.00)

2.00 (1.00, 4.00)

4.00 (2.00, 6.00)

<0.001

270.736*

SAPSII

36.00 (29.00, 44.00)

34.00 (27.00, 41.00)

39.00 (31.00, 47.00)

<0.001

243.699*

F – female; AFib – atrial fibrillation; CHF – congestive heart failure; CKD – chronic kidney disease; COPD – chronic obstructive pulmonary disease; CAD – coronary atherosclerotic heart disease; CRRT – continuous renal replacement therapy; ICU – intensive care unit; RDW – red blood cell distribution width; AKI – acute kidney injury; ARDS – acute respiratory distress syndrome; RBC – red blood cell count; Hb – hemoglobin; PLT – platelet count; WBC – white blood cell count; BUN – blood urea nitrogen; GLU – glucose; NLR – neutrophil–lymphocyte ratio; PLR – platelet–lymphocyte ratio; MLR – monocyte–lymphocyte ratio; SOFA – sequential organ failure assessment; SAPSII – simplified acute physiology score II. Continuous variables: median (1st quartile (Q1), 3rd quartile (Q3)). Categorical variables: frequency (percentage). * H value for Kruskal–Wallis test; + χ2 value for χ2 test.
Table 2. Baseline characteristic between unmatched, matched and weighted cohort

Variables

Imputation cohort

PSM cohort

IPTW cohort

low-RDW group

high-RDW group

SMD

low-RDW group

high-RDW group

SMD

low-RDW group

high-RDW group

SMD

N

2353

2483

1619

1619

4835

4851.3

Sex, F (%)

940 (39.9)

1079 (43.5)

0.071

662 (40.9)

679 (41.9)

0.021

1983.4 (41.0)

1991.4 (41.0)

0.001

Age

67.00

(58.00, 75.00)

67.00

(59.00, 76.00)

0.031

67.00

(59.00, 76.00)

67.00

(59.00, 76.00)

0.026

67.00

(59.00, 76.00)

67.00

(59.00, 76.00)

0.006

Race (%)

Black

172 (7.3)

277 (11.2)

0.133

141 (8.7)

137 (8.5)

0.009

464.5 (9.6)

451.8 (9.3)

0.011

Other

468 (19.9)

469 (18.9)

306 (18.9)

306 (18.9)

932.2 (19.3)

931.7 (19.2)

White

1713 (72.8)

1737 (70.0)

1172 (72.4)

1176 (72.6)

3438.4 (71.1)

3467.7 (71.5)

ICU mortality (%)

127 (5.4)

344 (13.9)

0.29

102 (6.3)

162 (10.0)

0.136

367.7 (7.6)

553.3 (11.4)

0.13

ICU stay

2.30

(1.60, 4.00)

2.40

(1.70, 4.10)

0.013

2.30

(1.70, 4.00)

2.20

(1.60, 3.90)

0.081

2.40

(1.70, 4.20)

2.30

(1.60, 4.00)

0.041

Types of cancer

Digestive (%)

620 (26.3)

1014 (40.8)

0.31

535 (33.0)

542 (33.5)

0.009

1622.4 (33.6)

1632.9 (33.7)

0.002

Respiration/thoracic (%)

608 (25.9)

469 (18.9)

0.167

386 (23.8)

377 (23.3)

0.013

1084.2 (22.4)

1116.7 (23.0)

0.014

Connective tissue (%)

49 (2.1)

47 (1.9)

0.014

39 (2.4)

38 (2.3)

0.004

97.4 (2.0)

98.2 (2.0)

0.001

Genitourinary (%)

395 (16.8)

389 (15.7)

0.029

275 (17.0)

273 (16.9)

0.003

784.2 (16.2)

784.0 (16.2)

0.002

Nervous (%)

246 (10.5)

41 (1.7)

0.376

49 (3.0)

41 (2.5)

0.03

287.5 (5.9)

290.8 (6.0)

0.002

Other (%)

168 (7.1)

163 (6.6)

0.023

102 (6.3)

113 (7.0)

0.027

306.7 (6.3)

306.4 (6.3)

0.001

Metastatic (%)

1071 (45.5)

1489 (60.0)

0.293

865 (53.4)

888 (54.8)

0.029

2554.0 (52.8)

2540.0 (52.4)

0.009

Ventilation (%)

613 (26.1)

648 (26.1)

0.001

425 (26.3)

415 (25.6)

0.014

1253.4 (25.9)

1266.9 (26.1)

0.004

Vasopressor (%)

551 (23.4)

763 (30.7)

0.165

417 (25.8)

409 (25.3)

0.011

1313.2 (27.2)

1310.7 (27.0)

0.003

CRRT (%)

7 (0.3)

25 (1.0)

0.088

7 (0.4)

8 (0.5)

0.009

38.7 (0.8)

32.2 (0.7)

0.016

Comorbidities

AFib (%)

550 (23.4)

666 (26.8)

0.08

415 (25.6)

399 (24.6)

0.023

1212.3 (25.1)

1230.7 (25.4)

0.007

Anemia (%)

367 (15.6)

578 (23.3)

0.195

298 (18.4)

319 (19.7)

0.033

948.8 (19.6)

959.9 (19.8)

0.004

CHF (%)

267 (11.3)

484 (19.5)

0.227

252 (15.6)

236 (14.6)

0.028

757.8 (15.7)

771.5 (15.9)

0.006

CKD (%)

252 (10.7)

470 (18.9)

0.233

229 (14.1)

224 (13.8)

0.009

738.3 (15.3)

725.3 (15.0)

0.009

COPD (%)

393 (16.7)

485 (19.5)

0.074

322 (19.9)

309 (19.1)

0.02

922.8 (19.1)

907.6 (18.7)

0.01

CAD (%)

374 (15.9)

459 (18.5)

0.069

294 (18.2)

272 (16.8)

0.036

849.7 (17.6)

865.3 (17.8)

0.007

Liver (%)

151 (6.4)

292 (11.8)

0.187

137 (8.5)

123 (7.6)

0.032

437.8 (9.1)

445.3 (9.2)

0.004

Stroke (%)

158 (6.7)

101 (4.1)

0.117

82 (5.1)

80 (4.9)

0.006

261.0 (5.4)

258.3 (5.3)

0.003

Sepsis (%)

695 (29.5)

1156 (46.6)

0.356

583 (36.0)

586 (36.2)

0.004

1863.1 (38.5)

1867.3 (38.5)

0.001

AKI (%)

1355 (57.6)

1730 (69.7)

0.253

1033 (63.8)

1018 (62.9)

0.019

3068.6 (63.5)

3104.8 (64.0)

0.011

ARDS (%)

101 (4.3)

106 (4.3)

0.001

67 (4.1)

73 (4.5)

0.018

217.9 (4.5)

214.8 (4.4)

0.004

Laboratory data

RDW

13.75

(13.10, 14.35)

16.70

(15.75, 18.03)

2.632

67.00

(59.00, 76.00)

67.00

(59.00, 76.00)

2.549

13.85

(13.20, 14.40)

16.50

(15.70, 17.85)

2.522

RBC

3.65

(3.23, 4.12)

3.20

(2.84, 3.66)

0.639

13.85

(13.20, 14.40)

16.45

(15.70, 17.80)

0.414

3.56

(3.13, 4.03)

3.25

(2.90, 3.73)

0.406

Hb

11.30

(9.90, 12.65)

9.50

(8.40, 10.70)

0.911

3.55

(3.14, 4.02)

3.26

(2.90, 3.72)

0.691

11.00

(9.70, 12.45)

9.65

(8.50, 10.90)

0.677

PLT

217.50

(160.00, 280.50)

197.00

(127.00, 281.25)

0.184

11.00

(9.70, 12.40)

9.60

(8.50, 10.85)

0.017

208.50

(148.50, 276.66)

205.00

(137.50, 285.28)

0.042

WBC

11.10

(8.30, 14.45)

10.50

(7.20, 14.30)

0.103

214.00

(150.00, 279.50)

211.50

(143.25, 291.75)

0.128

11.10

(8.15, 14.60)

10.35

(7.20, 14.10)

0.122

Creatinine

0.85

(0.65, 1.15)

1.00

(0.70, 1.43)

0.299

11.10

(8.05, 14.45)

10.30

(7.15, 13.92)

0.08

0.90

(0.70, 1.30)

0.90

(0.65, 1.30)

0.043

BUN

17.00

(12.50, 23.00)

21.50

(14.50, 31.99)

0.438

0.90

(0.70, 1.25)

0.85

(0.65, 1.20)

0.102

18.50

(13.00, 26.00)

20.00

(14.00, 28.50)

0.12

GLU

7.40

(6.30, 8.60)

7.00

(5.90, 8.40)

0.14

18.00

(13.00, 25.00)

19.00

(13.50, 27.50)

0.17

7.40

(6.20, 8.70)

7.00

(6.00, 8.30)

0.169

Scores

SOFA

2.00

(1.00, 4.00)

4.00

(2.00, 6.00)

0.559

3.00

(1.00, 4.00)

3.00

(1.00, 4.00)

0.007

3.00

(1.00, 5.00)

3.00

(1.00, 5.00)

0.01

SAPSII

34.00

(28.00, 41.00)

40.00

(32.00, 48.00)

0.519

36.00

(30.00, 43.00)

36.00

(30.00, 44.00)

0.005

37.00

(29.00, 45.00)

36.00

(29.00, 45.00)

0.004

F – female; AFib – atrial fibrillation; CHF – congestive heart failure; CKD – chronic kidney disease; COPD – chronic obstructive pulmonary disease; CAD – coronary atherosclerotic heart disease; CRRT – continuous renal replacement therapy; ICU – intensive care unit; RDW – red blood cell distribution width; AKI – acute kidney injury; ARDS – acute respiratory distress syndrome; RBC – red blood cell count; Hb – hemoglobin; PLT – platelet count; WBC – white blood cell count; BUN – blood urea nitrogen; GLU – glucose; SOFA – sequential organ failure assessment; SAPSII – simplified acute physiology score II; SMD – standardized mean difference; PSM – propensity score matching; IPTW – inverse probabilistic treatment weighting. Continuous variables: median (1st quartile (Q1), 3rd quartile (Q3)). Categorical variables: frequency (percentage).
Table 3. The primary outcome and sensitivity analysis. Odds ratio (OR; 95% confidence interval (95% CI)) of the ICU mortality in different models based on RDW grouping

Model

OR

95% CI

p-value

Origin

unadjusted

2.76

2.23–3.43

<0.001

model I

2.65

2.14–3.30

<0.001

model II

1.56

1.12–2.18

0.002

Imputation

unadjusted

2.82

2.29–3.50

<0.001

model I

2.79

2.26–3.46

<0.001

model II

1.64

1.27–2.12

<0.001

PSM

unadjusted

1.65

1.28–2.15

<0.001

model I

1.66

1.29–2.16

<0.001

model II

1.65

1.22–2.24

0.003

IPTW

unadjusted

1.56

1.22–2.00

<0.001

model I

1.57

1.23–2.01

<0.001

model II

1.55

1.19–2.03

0.003

Model I adjusted for: age, sex and race. Model II adjusted for: age, sex, race, types of cancer, intervention, ARDS, AKI, sepsis, comorbidities, laboratory parameters (RBC, Hb, PLT, WBC, BUN, creatinine, GLU), SOFA, and SAPSII. AKI – acute kidney injury; ARDS – acute respiratory distress syndrome; RBC – red blood cell count; Hb – hemoglobin; PLT – platelet count; WBC – white blood cell count; BUN – blood urea nitrogen; GLU – glucose; SOFA – sequential organ failure assessment; SAPSII – simplified acute physiology score II; RDW – red blood cell distribution width; ICU – intensive care unit; PSM – propensity score matching; IPTW – inverse probability treatment weighting.
Table 4. The secondary outcome evaluated using multivariate linear regression

Model

β

Standard deviation

Adjusted β

Adjusted R2

p-value

Origin cohort

−0.16

0.15

−0.02

0.15

0.270

Imputation cohort

−0.20

0.13

−0.02

0.14

0.140

PSM cohort

−0.28

0.14

−0.03

0.16

0.050

Adjusted for: age, sex, race, types of cancer, intervention, ARDS, AKI, sepsis, comorbidities, laboratory parameters (RBC, Hb, PLT, WBC, BUN, creatinine, GLU), SOFA, andSAPSII. AKI – acute kidney injury; ARDS – acute respiratory distress syndrome; RBC – red blood cell count; Hb – hemoglobin; PLT – platelet count; WBC – white blood cell count; BUN – blood urea nitrogen; GLU – glucose; SOFA – sequential organ failure assessment; SAPSII – simplified acute physiology score II; PSM – propensity score matching.

Figures


Fig. 1. Flowchart of the inclusion and exclusion of patients. In total, 4836 patients were selected
ICU – intensive care unit.
Fig. 2. Pattern of missing data in variables of interest
RDW – red blood cell distribution width; RBC – red blood cell; Hb – hemoglobin; PLT – platelet count; WBC – white blood cell count; BUN – blood urea nitrogen; GLU – glucose; NLR – neutrophil–lymphocyte ratio; PLR – platelet–lymphocyte ratio; MLR – monocyte–lymphocyte ratio; SOFA – sequential organ failure assessment; SAPSII – simplified acute physiology score II.
Fig. 3. Balancing the propensity score matching (PSM) model and the inverse probability treatment weighting (IPTW) model
SOFA – sequential organ failure assessment; SAPSII – simplified acute physiology score II; AKI – acute kidney injury; CKD – chronic kidney disease; CHF – congestive heart failure; CRRT – continuous renal replacement therapy; AFib – atrial fibrillation; COPD – chronic obstructive pulmonary disease; CAD – coronary atherosclerotic heart disease; ARDS – acute respiratory distress syndrome; SMD – standardized mean difference.
Fig. 4. Receiver operating characteristic (ROC) curve for red blood cell distribution width (RDW), neutrophil/lymphocyte ratio (NLR), platelet/lymphocyte ratio (PLR), monocyte/lymphocyte ratio (MLR), and simplified acute physiology score II (SAPSII) based on the intensive care unit (ICU) mortality
Fig. 5. Forest plot of subgroup analysis for the intensive care unit (ICU) mortality. Odds ratios (ORs) and 95% confidence intervals (95% CIs) were acquired using a univariate logistic regression model. The OR of a low-red blood cell distribution width (RDW) group amounted to 1 for the reference value. In the 33 subgroups, the scores were grouped according to the best cutoff value obtained with the largest Youden’s index based on ICU mortality
F – female; M – male; AFib – atrial fibrillation; CHF – congestive heart failure; CKD – chronic kidney disease; COPD – chronic obstructive pulmonary disease; CAD – coronary atherosclerotic heart disease; AKI – acute kidney injury; ARDS – acute respiratory distress syndrome; SOFA – sequential organ failure assessment; SAPSII – simplified acute physiology score II.

References (39)

  1. Siegel RL, Miller KD, Jemal A. Cancer statistics, 2020. CA Cancer J Clin. 2020;70(1):7–30. doi:10.3322/caac.21590
  2. Ostermann M, Ferrando-Vivas P, Gore C, Power S, Harrison D. Characteristics and outcome of cancer patients admitted to the ICU in England, Wales, and Northern Ireland and national trends between 1997 and 2013. Crit Care Med. 2017;45(10):1668–1676. doi:10.1097/CCM.0000000000002589
  3. Caruso P. Prognostication of critically ill patients with cancer: A long road ahead. Crit Care Med. 2017;45(10):1787–1788. doi:10.1097/CCM.0000000000002611
  4. Puxty K, McLoone P, Quasim T, Sloan B, Kinsella J, Morrison DS. Risk of critical illness among patients with solid cancers: A population-based observational study. JAMA Oncol. 2015;1(8):1078–1085. doi:10.1001/jamaoncol.2015.2855
  5. Chen ZQ, Yu XS, Mao LJ, et al. Prognostic value of neutrophil–lymphocyte ratio in critically ill patients with cancer: A propensity score matching study. Clin Transl Oncol. 2021;23(1):139–147. doi:10.1007/s12094-020-02405-8
  6. Martos-Benítez FD, Soto-García A, Gutiérrez-Noyola A. Clinical characteristics and outcomes of cancer patients requiring intensive care unit admission: A prospective study. J Cancer Res Clin Oncol. 2018;144(4):717–723. doi:10.1007/s00432-018-2581-0
  7. Shimabukuro-Vornhagen A, Böll B, Kochanek M, Azoulay É, von Bergwelt-Baildon MS. Critical care of patients with cancer. CA Cancer J Clin. 2016;66(6):496–517. doi:10.3322/caac.21351
  8. Danese E, Lippi G, Montagnana M. Red blood cell distribution width and cardiovascular diseases. J Thorac Dis. 2015;7(10):E402–E411. doi:10.3978/j.issn.2072-1439.2015.10.04
  9. Goyal H, Hu ZD. Prognostic value of red blood cell distribution width in hepatocellular carcinoma. Ann Transl Med. 2017;5(13):271–271. doi:10.21037/atm.2017.06.30
  10. Yazici P, Demir U, Bozkurt E, Isil GR, Mihmanli M. The role of red cell distribution width in the prognosis of patients with gastric cancer. Curr Pharm Des. 2017;18(1):19–25. doi:10.3233/CBM-160668
  11. Li Z, Hong N, Robertson M, Wang C, Jiang G. Preoperative red cell distribution width and neutrophil-to-lymphocyte ratio predict survival in patients with epithelial ovarian cancer. Sci Rep. 2017;7(1):43001. doi:10.1038/srep43001
  12. Song B, Shi P, Xiao J, et al. Utility of red cell distribution width as a diagnostic and prognostic marker in non-small cell lung cancer. Sci Rep. 2020;10(1):15717. doi:10.1038/s41598-020-72585-4
  13. Fontana V, Spadaro S, Villois P, et al. Can red blood cell distribution width predict outcome after cardiac arrest? Minerva Anestesiol. 2018;84(6):693–702. doi:10.23736/S0375-9393.17.12102-4
  14. Fontana V, Bond O, Spadaro S, et al. Red cell distribution width after subarachnoid hemorrhage. J Neurosurg Anesthesiol. 2018;30(4):319–327. doi:10.1097/ANA.0000000000000459
  15. Fujita B, Franz M, Figulla HR, et al. Red cell distribution width and survival in patients hospitalized on a medical ICU. Clin Biochem. 2015;48(16-17):1048–1052. doi:10.1016/j.clinbiochem.2015.07.011
  16. Yčas JW. Toward a blood-borne biomarker of chronic hypoxemia: Red cell distribution width and respiratory disease. In: Makowski GS, ed. Adv Clin Chem. 2017;82:105–197. doi:10.1016/bs.acc.2017.06.002
  17. Johnson A, Bulgarelli L, Pollard T, Horng S, Celi LA, Mark R. MIMIC-IV (version 2.0). PhysioNet; 2022. doi:10.13026/7vcr-e114
  18. Khwaja A. KDIGO Clinical Practice Guidelines for Acute Kidney Injury. Nephron Clin Pract. 2012;120(4):c179–c184. doi:10.1159/000339789
  19. Singer M, Deutschman CS, Seymour CW, et al. The Third International Consensus Definitions for Sepsis and Septic Shock (Sepsis-3). JAMA. 2016;315(8):801–810. doi:10.1001/jama.2016.0287
  20. Kuss O, Blettner M, Börgermann J. Propensity score: An alternative method of analyzing treatment effects. Dtsch Arztebl Int. 2016;113(35–36):597–603. doi:10.3238/arztebl.2016.0597
  21. Valenti AC, Vitolo M, Imberti JF, Malavasi VL, Boriani G. Red cell distribution width: A routinely available biomarker with important clinical implications in patients with atrial fibrillation. Curr Pharm Des. 2021;27(37):3901–3912. doi:10.2174/1381612827666210211125847
  22. Lippi G, Turcato G, Cervellin G, Sanchis-Gomar F. Red blood cell distribution width in heart failure: A narrative review. World J Cardiol. 2018;10(2):6–14. doi:10.4330/wjc.v10.i2.6
  23. Bottazzi B, Riboli E, Mantovani A. Aging, inflammation and cancer. Semin Immunol. 2018;40:74–82. doi:10.1016/j.smim.2018.10.011
  24. Zurauskaite G, Meier M, Voegeli A, et al. Biological pathways underlying the association of red cell distribution width and adverse clinical outcome: Results of a prospective cohort study. PLoS One. 2018;13(1):e0191280. doi:10.1371/journal.pone.0191280
  25. Baracos VE, Martin L, Korc M, Guttridge DC, Fearon KCH. Cancer-associated cachexia. Nat Rev Dis Primers. 2018;4(1):17105. doi:10.1038/nrdp.2017.105
  26. Jia L, Cui S, Yang J, et al. Red blood cell distribution width predicts long-term mortality in critically ill patients with acute kidney injury: A retrospective database study. Sci Rep. 2020;10(1):4563. doi:10.1038/s41598-020-61516-y
  27. Liao L, Pinhu L. Red blood cell distribution width as a predictor of 28-day mortality in critically ill patients with alcohol use disorder. Alcohol Clin Exp Res. 2020;44(12):2555–2560. doi:10.1111/acer.14483
  28. Zhang FX, Li ZL, Zhang ZD, Ma XC. Prognostic value of red blood cell distribution width for severe acute pancreatitis. World J Gastroenterol. 2019;25(32):4739–4748. doi:10.3748/wjg.v25.i32.4739
  29. Joffre J, Hellman J. Oxidative stress and endothelial dysfunction in sepsis and acute inflammation. Antioxid Redox Signal. 2021;35(15):1291–1307. doi:10.1089/ars.2021.0027
  30. Bazick HS, Chang D, Mahadevappa K, Gibbons FK, Christopher KB. Red cell distribution width and all-cause mortality in critically ill patients. Crit Care Med. 2011;39(8):1913–1921. doi:10.1097/CCM.0b013e31821b85c6
  31. Zhao C, Wei Y, Chen D, Jin J, Chen H. Prognostic value of an inflammatory biomarker-based clinical algorithm in septic patients in the emergency department: An observational study. Int Immunopharmacol. 2020;80:106145. doi:10.1016/j.intimp.2019.106145
  32. Sotiropoulos K, Yerly P, Monney P, et al. Red cell distribution width and mortality in acute heart failure patients with preserved and reduced ejection fraction: Red cell distribution width and acute heart failure. ESC Heart Fail. 2016;3(3):198–204. doi:10.1002/ehf2.12091
  33. Wei TT, Tang QQ, Qin BD, et al. Elevated red blood cell distribution width is associated with liver function tests in patients with primary hepatocellular carcinoma. Clin Hemorheol Microcirc. 2016;64(2):149–155. doi:10.3233/CH-162053
  34. Anand IS, Gupta P. Anemia and iron deficiency in heart failure: Current concepts and emerging therapies. Circulation. 2018;138(1):80–98. doi:10.1161/CIRCULATIONAHA.118.030099
  35. Weiss G, Goodnough LT. Anemia of chronic disease. N Engl J Med. 2005;352(10):1011–1023. doi:10.1056/NEJMra041809
  36. de Gonzalo-Calvo D, de Luxán-Delgado B, Rodríguez-González S, et al. Interleukin 6, soluble tumor necrosis factor receptor I and red blood cell distribution width as biological markers of functional dependence in an elderly population: A translational approach. Cytokine. 2012;58(2):193–198. doi:10.1016/j.cyto.2012.01.005
  37. Wang L, Jia J, Lin L, et al. Predictive value of hematological markers of systemic inflammation for managing cervical cancer. Oncotarget. 2017;8(27):44824–44832. doi:10.18632/oncotarget.14827
  38. Mao M, Wei X, Sheng H, et al. C reactive protein/albumin and neutrophil/lymphocyte ratios and their combination predict overall survival in patients with gastric cancer. Oncol Lett. 2017;14(6):7417–7424. doi:10.3892/ol.2017.7179
  39. Huszno J, Kolosza Z. Prognostic value of the neutrophil–lymphocyte, platelet–lymphocyte and monocyte–lymphocyte ratio in breast cancer patients. Oncol Lett. 2019;18(6):6275–6283. doi:10.3892/ol.2019.10966